Супер-тенденции и стратегии сочетания ленты Брин
Автор:Чао Чжан, Дата: 2024-03-29 15:18:22Тэги:

Обзор
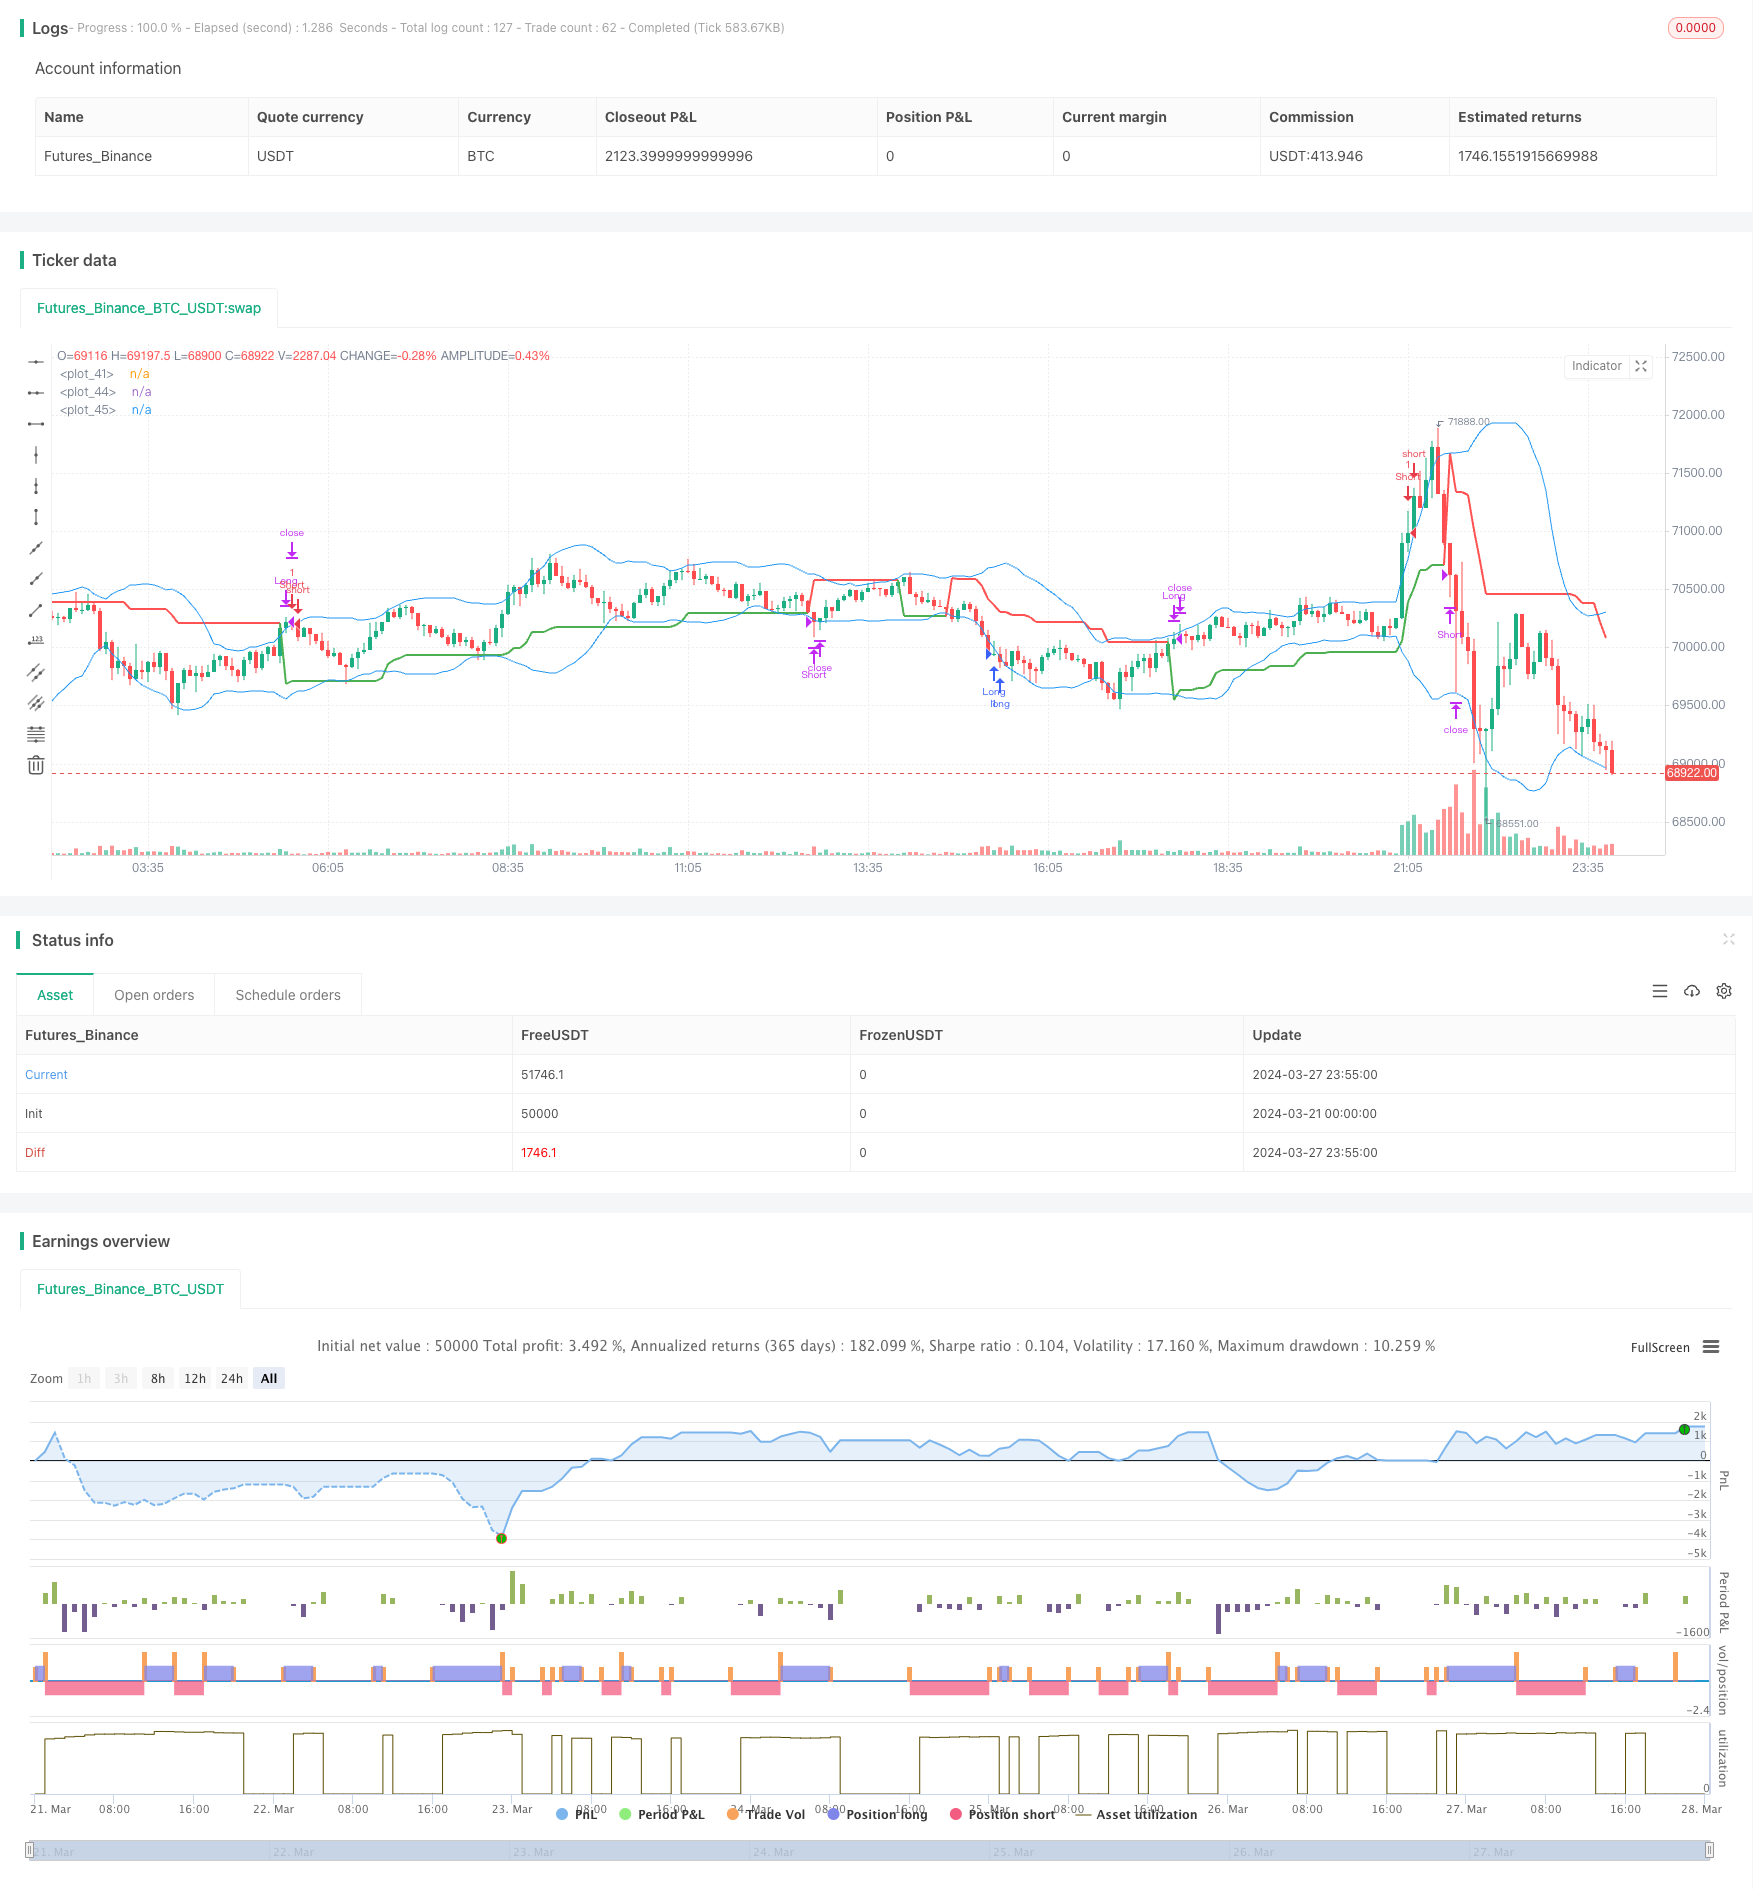
Эта стратегия сочетает в себе сверхтенденционный индикатор и индикатор Блинн-бенда, чтобы поймать тенденционные возможности рынка. Сверхтенденционный индикатор используется для определения направления тренда текущего рынка, а индикатор Блинн-бенда используется для измерения волатильности рынка.
Принципы стратегии
- Вычисляет реальные размеры (ATR) и сверхтенденционные показатели, которые используются для определения направления тренда на текущем рынке.
- Вычислить Блин-Бэнд на трассе, чтобы измерить уровень волатильности рынка.
- Когда цена закрытия выходит за пределы линии сверхтенденции и находится в полосе Брин, то появляется сигнал перевыполнения; когда цена закрытия выходит за пределы линии сверхтенденции и находится в полосе Брин, то появляется сигнал перевыполнения.
- Когда удерживается многоголовая позиция, если цена закрытия пробивается через линию сверхтенденции, то она остается равной; когда удерживается пустая позиция, если цена закрытия пробивается через линию сверхтенденции, то она остается равной.
Стратегические преимущества
- Сочетание двухмерной информации о тенденциях и волатильности позволяет более полно оценить возможности рынка.
- Если вы хотите, чтобы ваши клиенты были готовы к тому, что они будут делать, вы должны быть готовы к тому, что они будут делать.
- В бурном рынке, при сочетании с супертенденцией, Брин-ленты эффективно фильтруют ложные сигналы прорыва, снижая риск убытков в бурном рынке.
- Логика кода ясна, параметров меньше, легко понять и реализовать.
Стратегические риски
- В условиях одностороннего тренда рынок может приводить к чрезмерной частоте сделок, увеличивая стоимость сделок из-за частоты сигналов прорыва.
- Поиск прорывов зависит от сверхтенденционного индикатора, который чувствителен к параметрам, и может влиять на стратегический эффект.
- Блинтовая ширина будет изменяться с изменениями волатильности рынка, что может увеличить сдерживающие потери в условиях высокой волатильности.
Оптимизация стратегии
- Для дальнейшего повышения надежности сигналов можно рассмотреть возможность введения более эффективных условий фильтрации, таких как объем торговли, рыночные настроения и т. д.
- Для параметров сверхтенденционных индикаторов можно проводить оптимизационные тесты, выбирая оптимальные параметры для повышения стратегической устойчивости.
- При выполнении сделок могут быть введены более детальные меры управления позициями и контроля риска, такие как установка движущихся стоп-дозиров, динамическое регулирование позиций и т. д., чтобы снизить риск одной сделки.
Подведение итогов
Стратегия сверхтенденциального сочетания является стратегией трендоследания, которая позволяет более эффективно улавливать трендовые возможности путем сочетания двух рыночных элементов - тренда и волатильности. Однако эта стратегия имеет определенные ограничения, такие как чувствительность к параметрам, повышение риска в среде с высокой волатильностью и т. д. Поэтому в практическом применении также требуется соответствующая оптимизация и улучшение стратегии в соответствии с особенностями рынка и собственными рисковыми предпочтениями.
/*backtest
start: 2024-03-21 00:00:00
end: 2024-03-28 00:00:00
period: 5m
basePeriod: 1m
exchanges: [{"eid":"Futures_Binance","currency":"BTC_USDT"}]
*/

// This Pine Script™ code is subject to the terms of the Mozilla Public License 2.0 at https://mozilla.org/MPL/2.0/
// © sabhiv27

//@version=4
strategy("Supertrend & Bollinger Bands Strategy", shorttitle="ST_BB_Strategy", overlay=true)

// Input options
factor = input(3, title="Supertrend Factor")
length = input(10, title="ATR Length")
bollinger_length = input(20, title="Bollinger Bands Length")
bollinger_deviation = input(2, title="Bollinger Bands Deviation")

// Calculate True Range for Supertrend
truerange = rma(tr, length)

// Calculate Supertrend
var float up_trend = na
var float dn_trend = na
var float trend = na
up_signal = hl2 - (factor * truerange)
dn_signal = hl2 + (factor * truerange)
up_trend := close[1] > up_trend[1] ? max(up_signal, up_trend[1]) : up_signal
dn_trend := close[1] < dn_trend[1] ? min(dn_signal, dn_trend[1]) : dn_signal
trend := close > dn_trend ? 1 : close < up_trend ? -1 : nz(trend[1], 1)

// Calculate Bollinger Bands
basis = sma(close, bollinger_length)
dev = stdev(close, bollinger_length)
upper_band = basis + bollinger_deviation * dev
lower_band = basis - bollinger_deviation * dev

// Entry conditions
long_condition = crossover(close, up_trend) and close < lower_band
short_condition = crossunder(close, dn_trend) and close > upper_band

// Exit conditions
exit_long_condition = crossover(close, dn_trend)
exit_short_condition = crossunder(close, up_trend)

// Plot Supertrend
plot(trend == 1 ? up_trend : dn_trend, color=trend == 1 ? color.green : color.red, linewidth=2)

// Plot Bollinger Bands
plot(upper_band, color=color.blue)
plot(lower_band, color=color.blue)

// Generate buy and sell signals
strategy.entry("Long", strategy.long, when=long_condition)
strategy.entry("Short", strategy.short, when=short_condition)
strategy.close("Long", when=exit_long_condition)
strategy.close("Short", when=exit_short_condition)
- Стратегия отслеживания двойной сплошной EMA
- Уравненная стратегия золотых вилок
- Стратегия динамики RSI
- EMA RSI тренд следить и динамика стратегии
- Стратегия отслеживания тенденций Gaussian Channel
- Стратегия высокочастотного трейдинга в сочетании с DCA
- Поправка стратегии отслеживания тенденций относительно сильных и слабых индексов
- Некоторые из них были изнасилованы.
- EMA-MACD-SuperTrend-ADX-ATR Стратегия сигналов торговли с несколькими индикаторами
- Тенденции следуют стратегии переменных позиций
- Стратегия отслеживания трендов MACD
- Стратегия перекрестного использования двойных равномерных линий EMA
- Стратегия короткой торговли золотом (XAUUSD Scalper 1m)
- Прорыв каналов и настройка стратегии ChoCH на основе векторных диаграмм
- Прорыв в стратегии перекрестного использования EMA
- Динамическая стратегия отслеживания тенденций
- Супер-Тенденционная стратегия ATR
- Движущаяся линия среднего трехкратного индекса в сочетании с относительно сильным и слабым индексом 1-минутный график
- Стратегия отслеживания тренда в 1 час, основанная на RSI и двойных габаритах
- Индексные движущиеся средние