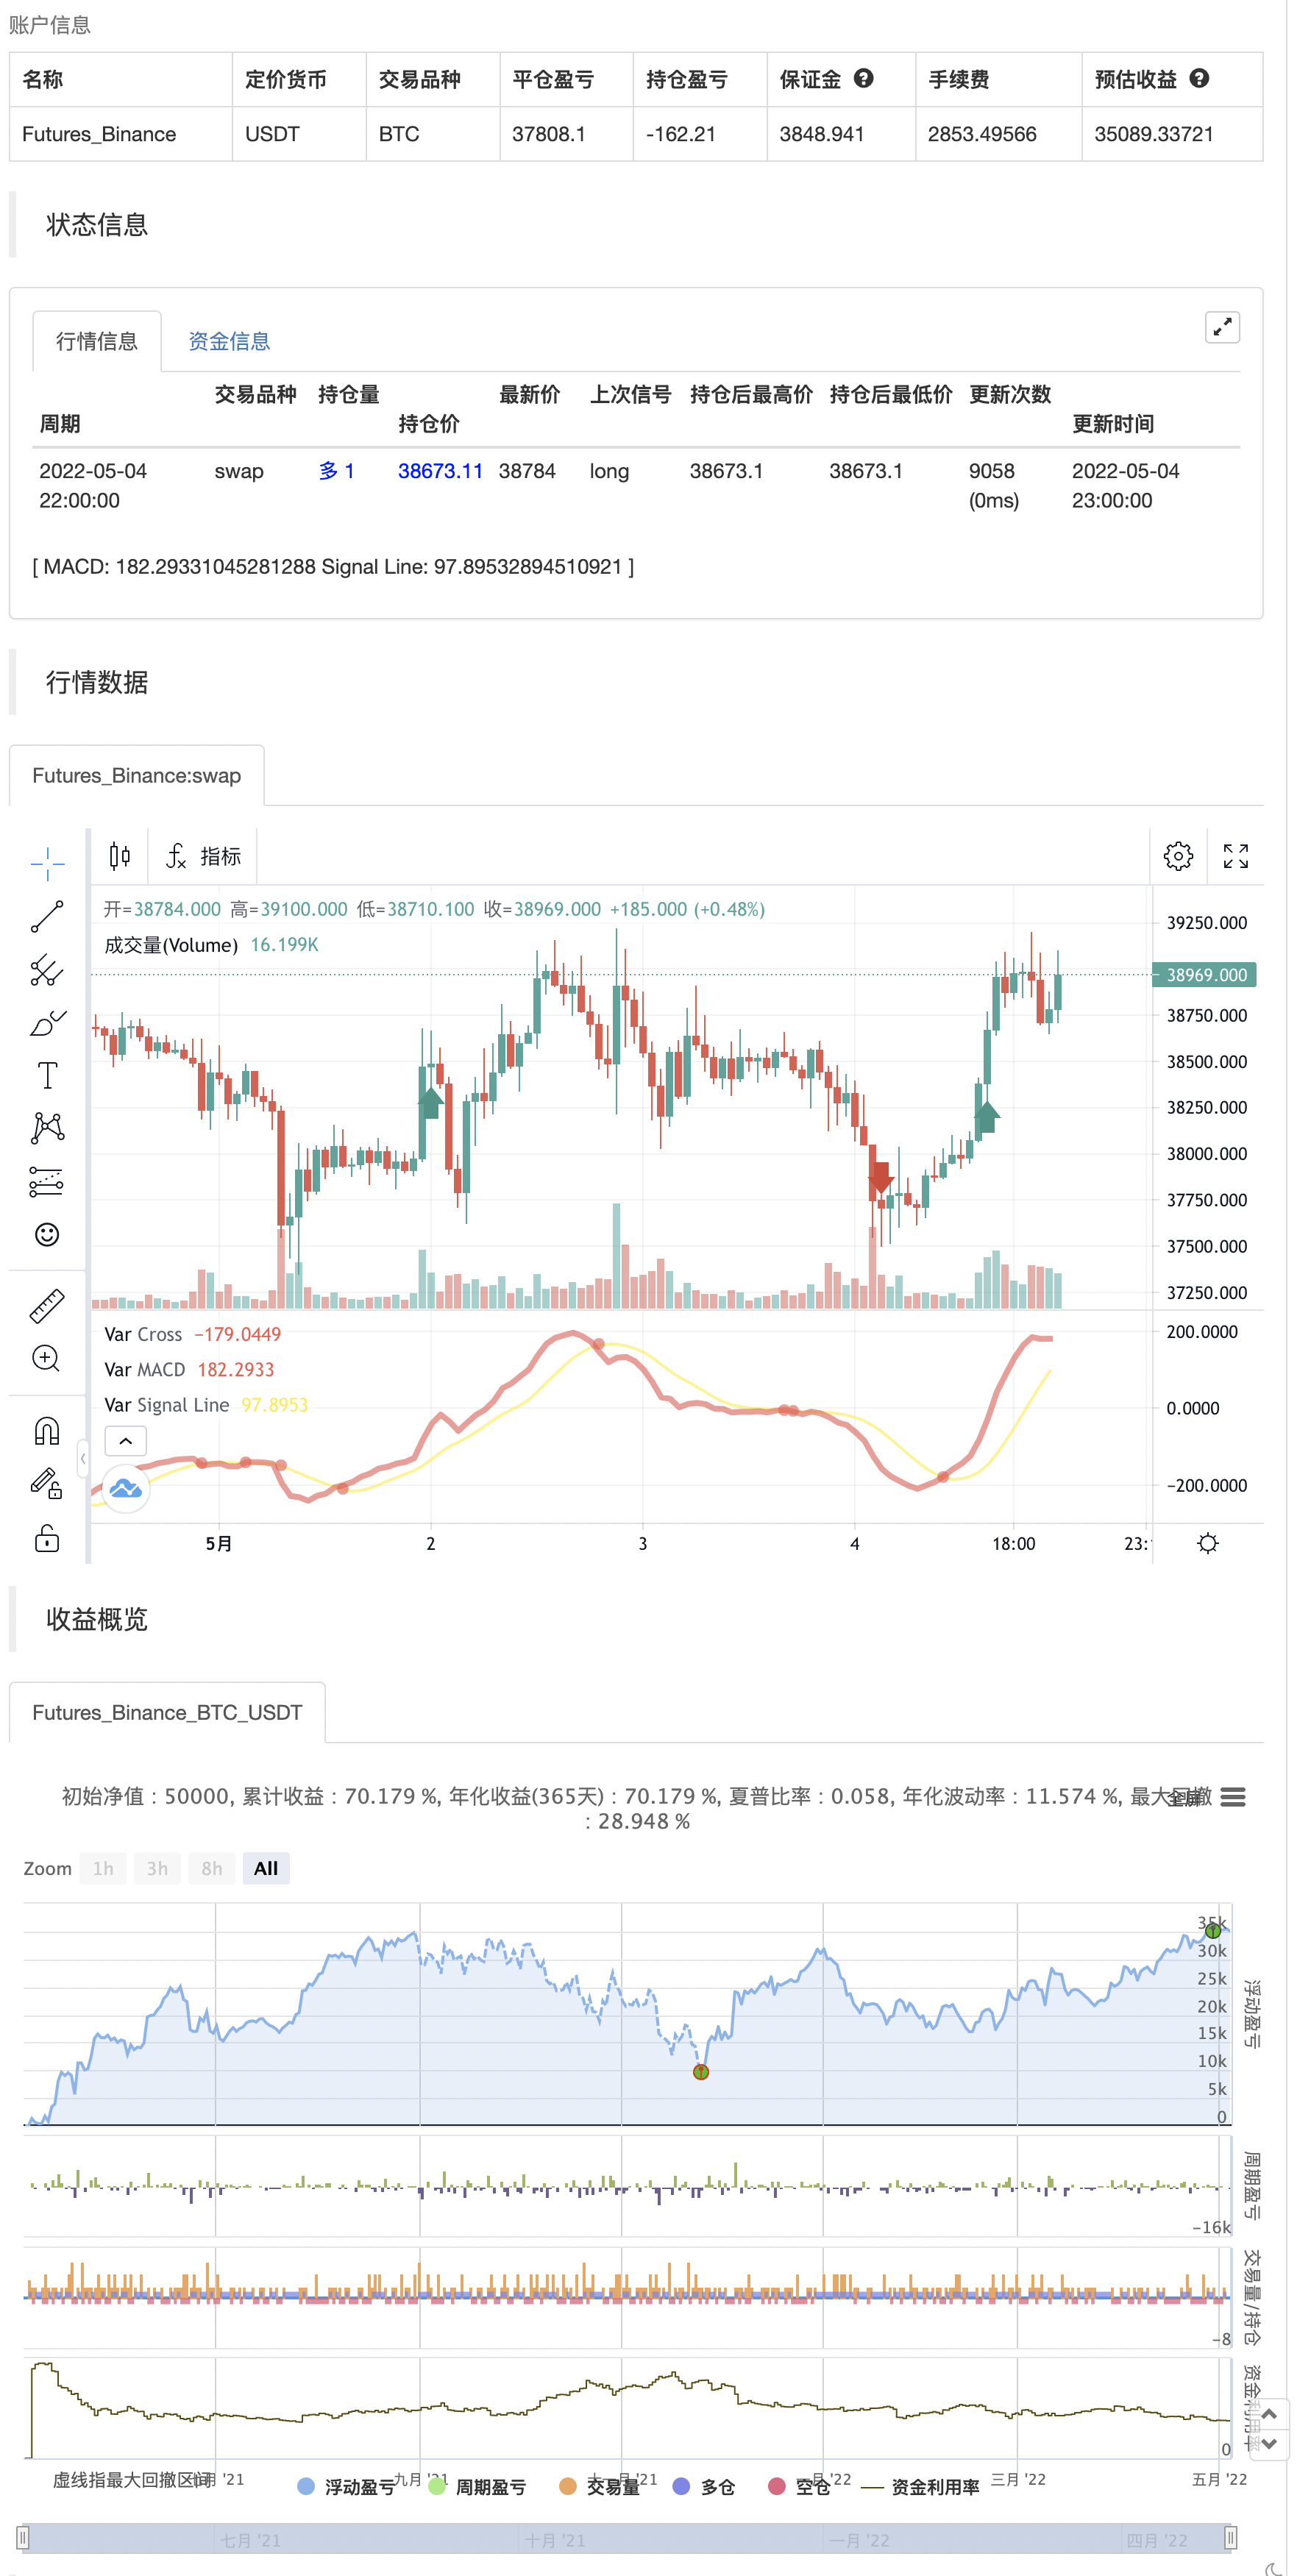
میک ڈی اپنی مرضی کے مطابق اشارے-متعدد ٹائم فریم + تمام دستیاب اختیارات!
مصنف:چاؤ ژانگ، تاریخ: 2022-05-06 20:46:48ٹیگز:ایم اے سی ڈی
ہیسٹوگرام کے ساتھ باقاعدہ MACD اشارے جو صفر لائن کے اوپر اور نیچے سمت کی بنیاد پر 4 رنگوں کا خاکہ پیش کرتا ہے
اپ ڈیٹ چیک باکس کے اختیارات، دکھائیں MacD & سگنل لائن، سگنل لائن کے کراس کی بنیاد پر MacD لائن کے رنگ میں تبدیلی دکھاتا ہے.
میک ڈی اور سگنل لائن کے کراس پر ڈاٹ دکھائیں، ہسٹوگرام 4 رنگ یا 1 دکھا سکتا ہے، ہسٹوگرام کو آن اور آف کریں۔
خصوصی شکریہ کہ ناقابل یقین شخص کے لئے تکنیکی مدد میں جو میں آپ کا نام نہیں بتاؤں گا تاکہ آپ کو ای میلز کے ساتھ بمباری نہ ہو
نوٹ کریں کہ خصوصیت تکنیکی سپورٹ نے مجھے دکھایا کہ کس طرح چارٹ ٹائم فریم کے لئے اشارے کے ڈیفالٹ ٹائم فریم کو مقرر کرنے کے لئے، لیکن آپ کو ایک مختلف ٹائم فریم منتخب کرنے کی بھی اجازت دیتا ہے.
ویسے میں مکمل طور پر ظاہر کرتا ہوں کہ میں نے مکمل طور پر
دوبارہ جانچ پڑتال

/*backtest
start: 2021-05-05 00:00:00
end: 2022-05-04 23:59:00
period: 1h
basePeriod: 15m
exchanges: [{"eid":"Futures_Binance","currency":"BTC_USDT"}]
*/

//Created by user ChrisMoody updated 4-10-2014
//Regular MACD Indicator with Histogram that plots 4 Colors Based on Direction Above and Below the Zero Line
//Update allows Check Box Options, Show MacD & Signal Line, Show Change In color of MacD Line based on cross of Signal Line.
//Show Dots at Cross of MacD and Signal Line, Histogram can show 4 colors or 1, Turn on and off Histogram.
//Special Thanks to that incredible person in Tech Support whoem I won't say you r name so you don't get bombarded with emails
//Note the feature Tech Support showed me on how to set the default timeframe of the indicator to the chart Timeframe, but also allow you to choose a different timeframe.
//By the way I fully disclose that I completely STOLE the Dots at the MAcd Cross from "TheLark"

study(title="CM_MacD_Ult_MTF", shorttitle="CM_Ult_MacD_MTF")
source = close
useCurrentRes = input(true, title="Use Current Chart Resolution?")
resCustom = input(title="Use Different Timeframe? Uncheck Box Above", defval="60")
smd = input(true, title="Show MacD & Signal Line? Also Turn Off Dots Below")
sd = input(true, title="Show Dots When MacD Crosses Signal Line?")
sh = input(true, title="Show Histogram?")
macd_colorChange = input(true,title="Change MacD Line Color-Signal Line Cross?")
hist_colorChange = input(true,title="MacD Histogram 4 Colors?")

res = useCurrentRes ? timeframe.period : resCustom

fastLength = input(12, minval=1), slowLength=input(26,minval=1)
signalLength=input(9,minval=1)

fastMA = ta.ema(source, fastLength)
slowMA = ta.ema(source, slowLength)

outMacD = fastMA - slowMA
outSignal = ta.sma(outMacD, signalLength)
outHist = outMacD - outSignal

//outMacD = request.security(timeframe.period, res, mymacd)
//outSignal = request.security(timeframe.period, res, signal)
//outHist = request.security(timeframe.period, res, hist)

histA_IsUp = outHist > outHist[1] and outHist > 0
histA_IsDown = outHist < outHist[1] and outHist > 0
histB_IsDown = outHist < outHist[1] and outHist <= 0
histB_IsUp = outHist > outHist[1] and outHist <= 0

//MacD Color Definitions
macd_IsAbove = outMacD >= outSignal
macd_IsBelow = outMacD < outSignal

plot_color = hist_colorChange ? histA_IsUp ? color.aqua : histA_IsDown ? color.blue : histB_IsDown ? color.red : histB_IsUp ? color.maroon :color.yellow :color.gray
macd_color = macd_colorChange ? macd_IsAbove ? color.lime : color.red : color.red
signal_color = macd_colorChange ? macd_IsAbove ? color.yellow : color.yellow : color.lime

circleYPosition = outSignal

plot(smd and outMacD ? outMacD : na, title="MACD", color=macd_color, linewidth=4)
plot(smd and outSignal ? outSignal : na, title="Signal Line", color=signal_color, style=plot.style_line ,linewidth=2)
//plot(sh and outHist ? outHist : na, title="Histogram", color=plot_color, style=histogram, linewidth=4)
plot(sd and ta.cross(outMacD, outSignal) ? circleYPosition : na, title="Cross", style=plot.style_circles, linewidth=4, color=macd_color)
//hline(0, '0 Line', linestyle=hline.style_solid, linewidth=2, color=color.white)

if outMacD > outSignal and math.abs(outMacD - outSignal) >90
    strategy.entry("entry long", strategy.long)
else if outMacD < outSignal and math.abs(outMacD - outSignal) >90
    strategy.entry("entry short", strategy.short)
- کثیر جہتی رجحانات کا تعین اور اے ٹی آر متحرک اسٹاپ اور نقصان کی حکمت عملی
- ڈبل کراس ٹرینڈ ٹریکنگ کی حکمت عملی: انڈیکس ایکویریم اور میک ڈی کے ساتھ مل کر ٹریڈنگ سسٹم
- کثیر اشارے کثیر جہتی رجحانات اعلی درجے کی مقدار کی حکمت عملی کو عبور کرتے ہیں
- اتار چڑھاؤ کی روک تھام کی بنیاد پر اوسط لکیری رجحان ٹریکنگ کی حکمت عملی
- کثیر اشارے کے رجحانات کو ٹریک کرنے کے ساتھ مل کر RSI oversold oversold کی مقدار کی تجارت کی حکمت عملی
- کثیر جہتی کلاؤڈ چارٹ کی قیمتوں میں رجحانات کی تصدیق کی جاتی ہے
- ملٹی انڈیکیٹر ٹرینڈ ڈائنامک ٹریڈنگ کی حکمت عملی: برن بینڈ ، فیبونیکی اور اے ٹی آر پر مبنی بہتر مقدار میں ٹریڈنگ کا نظام
- طاقت کی حکمت عملی کو بڑھانے کے لئے مقدار کی قیمتوں کا تعین
- متعدد تکنیکی اشارے کے رجحانات کو ٹریک کرنے کی حکمت عملی، جس میں رفتار اور اوسط لائن کا مجموعہ شامل ہے
- اعلی درجے کی MACD یکساں کراس ٹریڈنگ کی حکمت عملی کے ساتھ مل کر موافقت پذیر رسک مینجمنٹ
- ایک سے زیادہ وقت کے دورانیے سلائڈ ہینڈل چلتی اوسط رجحان ٹریکنگ ٹریڈنگ سسٹم
- سپر ٹرینڈ حکمت عملی
- ڈیمارک کے الٹ پوائنٹس
- سوئنگ ہائٹس/لوز اور موم بتی پیٹرن
- ٹی ایم اے اوورلے
- ایم اے سی ڈی + ایس ایم اے 200 حکمت عملی
- سی ایم سلنگ شاٹ سسٹم
- بولنگر + آر ایس آئی، ڈبل حکمت عملی v1.1
- بولنگر بینڈ کی حکمت عملی
- بہتر ٹرینڈ ٹریکر
- پائن اسکرپٹ کی حکمت عملیوں میں ماہانہ واپسی
- v4 کے لئے ADX اور DI
- اشارے: WaveTrend Oscillator
- دباؤ رفتار اشارے
- الفا ٹرینڈ
- کراس سائیکل ہائی لائن ٹریڈنگ
- جذبات آکسیلیٹر
- کرنسی اور کرنسی کے جوڑے کی تجارت کرنسی کی نقد رقم کے لئے استعمال کیا جاتا ہے تاکہ مارکیٹ کی قیمت کو صاف کیا جاسکے۔
- سمندری تجارت کا قانون
- اپنے رجحان کو حاصل کریں
- الفا ٹرینڈ استعمال ایم ایف آئی