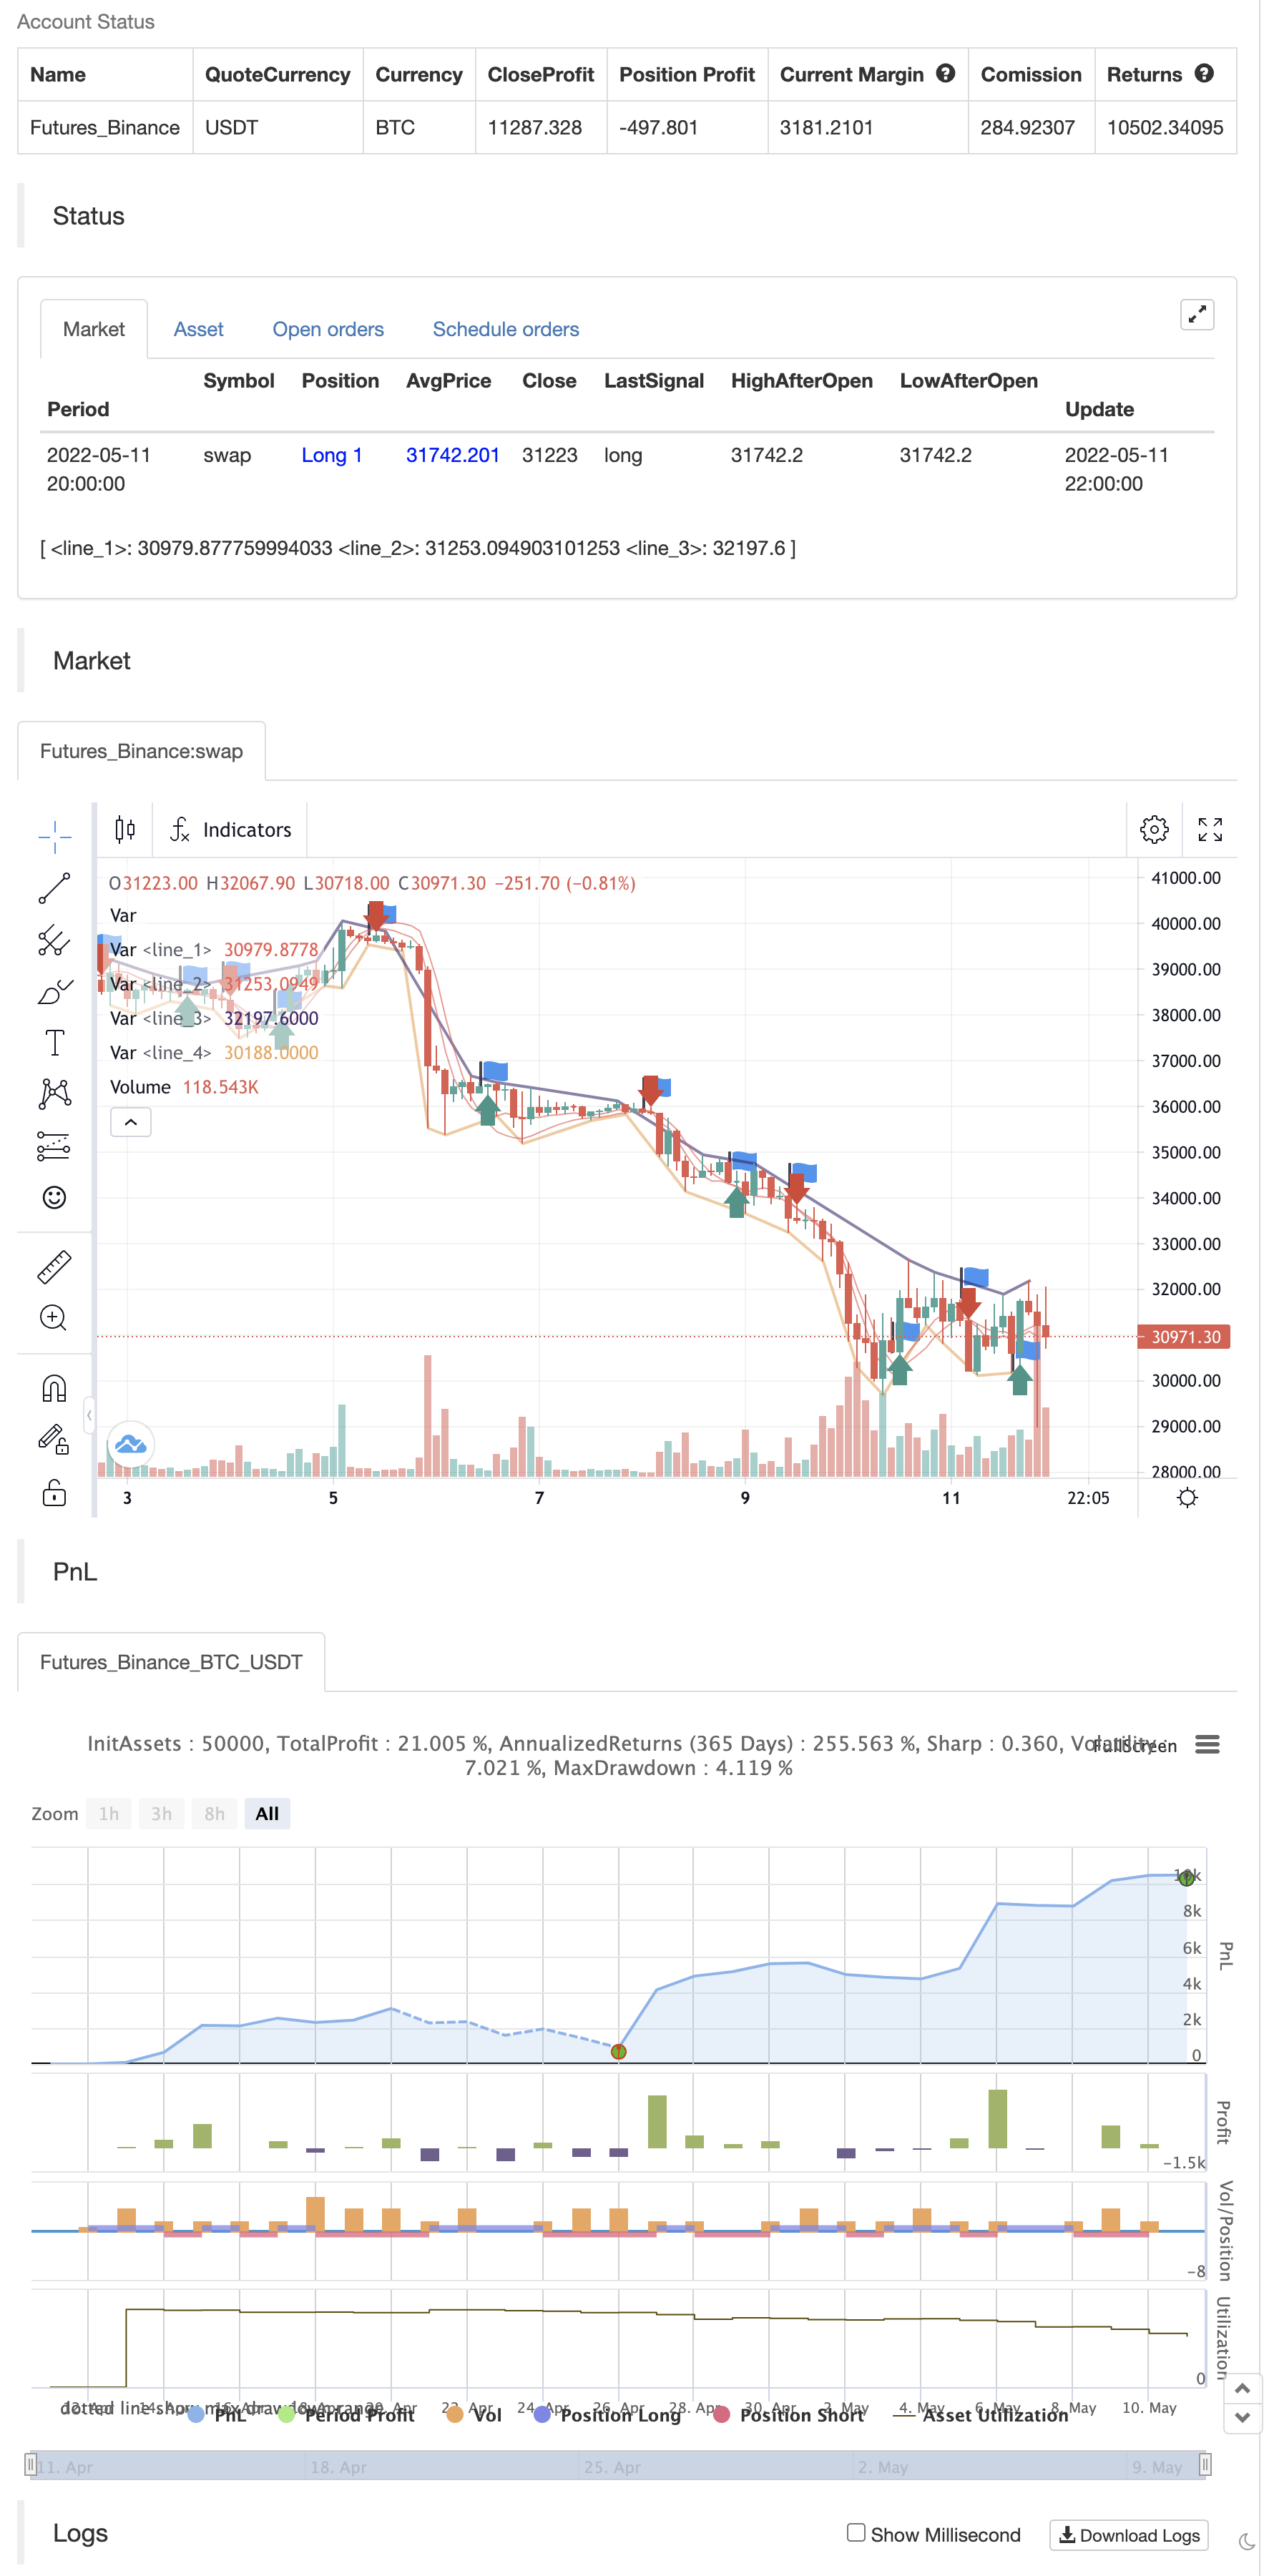
برہماسترا
مصنف:چاؤ ژانگ، تاریخ: 2022-05-13 14:39:00ٹیگز:ڈبلیو ایم اے
کسی بھی وقت، آپ کو اس اسکرپٹ میں 4 رجحان لائنوں تک نظر آئے گا.
▶ ٹرینڈ لائن اوپر کی طرف بڑھتی ہوئی حالت میں محور کی اونچائیوں میں شامل ہوتی ہے ▶ ٹرینڈ لائن اپ ٹرینڈنگ حالت میں محور کموں میں شامل ہو رہی ہے ▶ ٹرینڈ لائن ڈاؤن ٹرینڈ حالت میں محور بلندیاں میں شامل ہو رہی ہے ▶ ٹرینڈ لائن ڈاؤن ٹرینڈ کے حالات میں پائیوٹ ڈبوں میں شامل ہوتی ہے
پرانی لائن تب تک برقرار رہے گی جب تک کہ ایک ہی قسم کی نئی لائن سامنے نہ آئے۔ لہذا ، آپ اب بھی نیچے کی طرف جانے والے آلات کے لئے اوپر کی طرف بڑھتی ہوئی اعلی اور کم رجحان لائنیں دیکھ سکیں گے جو بہت پیچھے بنائی گئی ہیں!! نیز ، نئی رجحان لائنیں صرف اس صورت میں پرانی لائنوں کی جگہ لے لیتی ہیں جب وہ زیادہ مضبوط ہوں (کم اوور فلو کے ساتھ زیادہ محور سے جڑیں)
بیک ٹسٹ

/*backtest
start: 2022-04-12 00:00:00
end: 2022-05-11 23:59:00
period: 2h
basePeriod: 15m
exchanges: [{"eid":"Futures_Binance","currency":"BTC_USDT"}]
*/

//@version=4
study("BRAHMASTRA", precision=2, overlay=true)
// compilation: capissimo

// This script utilizes two modules, Trendlines Module (by Joris Duyck) and HMA-Kahlman Trend Module.
// Trendlines module produces crossovers predictive of the next local trend.

//*** HMA-Kahlman Trend Module
price  = input(hl2,  "Price Data (hl2)")
hkmod  = input(true, "===HMA-Kahlman Trend Module===")
length = input(22,   "Lookback Window", minval=2)
k      = input(true, "Use Kahlman")
gain   = input(.7,   "Gain", minval=.0001, step=.01)
labels = input(true, "Show Labels?")
o      = input(true, "Use Offset")

hma(x, p) => wma((2 * wma(x, p / 2)) - wma(x, p), round(sqrt(p)))

hma3() => p = length/2, wma(wma(close, p/3)*3 - wma(close, p/2) - wma(close, p), p)

kahlman(x, g) =>
    kf = 0.0
    dk = x - nz(kf[1], x)
    smooth = nz(kf[1],x)+dk*sqrt(g*2)
    velo = 0.0
    velo := nz(velo[1],0) + (g*dk)
    kf := smooth+velo

a = k ? kahlman(hma(price, length), gain) : hma(price, length)
b = k ? kahlman(hma3(), gain) : hma3()
c = b > a ? color.lime : color.red
crossdn = a > b and a[1] < b[1]
crossup = b > a and b[1] < a[1]
ofs = o ? -1 : 0

fill(plot(a,color=c,linewidth=1,transp=75), plot(b,color=c,linewidth=1,transp=75), color=c, transp=55)
plotshape(labels and crossdn ? a : na, location=location.abovebar, style=shape.labeldown, color=color.red, size=size.tiny, text="S", textcolor=color.white, transp=0, offset=ofs)
plotshape(labels and crossup ? a : na, location=location.belowbar, style=shape.labelup, color=color.green, size=size.tiny, text="B", textcolor=color.white, transp=0, offset=ofs)

//*** Trendlines Module, see https://www.tradingview.com/script/mpeEgn5J-Trendlines-JD/
tlmod = input(true, "===Trendlines Module===")
l1    = input(2,    "Pivots Lookback Window", minval=1)

trendline(input_function, delay, only_up) => // Calculate line coordinates (Ax,Ay) - (Bx,By)
    var int Ax = 0, var int Bx = 0, var float By = 0.0, var float slope = 0.0
    Ay = fixnan(input_function)
    if change(Ay)!=0
        Ax := time[delay], By:= Ay[1], Bx := Ax[1]
        slope := ((Ay-By)/(Ax-Bx))
    else
        Ax := Ax[1], Bx := Bx[1], By := By[1]

    var line trendline=na, var int Axbis=0, var float Aybis=0.0, var bool xtend=true
    extension_time = 0
    Axbis := Ax + extension_time
    Aybis := (Ay + extension_time*slope)
    if tlmod and change(Ay)!=0
        line_color = slope*time<0?(only_up?na:color.red):(only_up?color.lime:na)
        if not na(line_color)
            trendline = line.new(Bx,By,Axbis, Aybis, xloc.bar_time, extend=xtend?extend.right:extend.none, color=line_color, style=line.style_dotted, width=1)
            line.delete(trendline[1])
    slope

pivot(len) =>
    high_point = pivothigh(high, len,len/2)
    low_point  = pivotlow(low, len,len/2)
    slope_high = trendline(high_point, len/2,false)
    slope_low  = trendline(low_point, len/2,true)
    [high_point, low_point, slope_high, slope_low]

[high_point1, low_point1, slope_high1, slope_low1] = pivot(l1)

color_high1 = slope_high1 * time<0 ? color.red : na
color_low1  = slope_low1  * time>0 ? color.lime : na
plot(tlmod ? high_point1 : na, color=color_high1, offset=-l1/2, linewidth=2)
plot(tlmod ? low_point1  : na, color=color_low1, offset=-l1/2, linewidth=2)


if crossup
    strategy.entry("Enter Long", strategy.long)
else if crossdn
    strategy.entry("Enter Short", strategy.short)
- ایک سے زیادہ تکنیکی اشاریہ جات کو عبور کرنے والی رفتار کے رجحانات کی نگرانی کی حکمت عملی
- کثیر متوازی لائن کراس سپورٹ RSI متحرک پیرامیٹرز کوالٹی ٹریڈنگ کی حکمت عملی
- متحرک رجحانات RSI کے لئے کراس حکمت عملی کا تعین کرتے ہیں
- متعدد ہموار اوسط لائن متحرک کراس ٹرینڈ ٹریکنگ اور متعدد تصدیق شدہ مقداری تجارت کی حکمت عملی
- ملٹی انڈیکیٹرز کے ساتھ مل کر رجحانات کو تبدیل کرنے کی تجارتی حکمت عملی
- کینی کی راہداری کی حکمت عملی کے خلاف متعدد چینلز کی متحرک حمایت
- کوائٹیٹائزڈ ٹرینڈ کی گرفتاری کی حکمت عملی، جس کی بنیاد سلائیڈ سلائیڈ کی لمبائی پر ہے۔
- بلنگ بینڈ نے ٹرانزیکشن ٹریکنگ کی حکمت عملی کو توڑا
- ملٹی انڈیکیٹرز کو متحرک حرکت پذیر اوسط کے ساتھ مل کر کیوٹیفیکیشن کی حکمت عملی
- ملٹی انڈیکیٹرز کے ساتھ متحرک تجارت کو بہتر بنانے کی حکمت عملی
- بولنگر ڈرائیونگ کی حد سے تجاوز کی بنیاد پر اپنی مرضی کے مطابق رجحان ٹریکنگ کی حکمت عملی
- گھوٹالہ رجحانات کی حکمت عملی کا ڈیٹا بیس
- گھوٹالہ رجحانات کی پیروی کرنے کی حکمت عملی
- گھوسٹ ٹرینڈ ٹریکنگ کی حکمت عملی
- رینبو اوسیلیٹر
- ایکویٹی وکر کی پوزیشن سائزنگ مثال کی تجارت
- KLineChart ڈیمو
- وِلا ڈائنامک پِیوٹ سپر ٹرینڈ حکمت عملی
- کروڈل کا سپر ٹرینڈ
- zdmre کی طرف سے RSI
- FTL - رینج فلٹر X2 + EMA + UO
- موبو بینڈ
- SAR + 3SMMA SL & TP کے ساتھ
- ایس ایس ایس
- چاند لانچ الرٹس ٹیمپلیٹ [شاندار]
- HALFTREND + HEMA + SMA (غلط سگنل کی حکمت عملی)
- RSI Pivot، BB، SMA، EMA، SMMA، WMA، VWMA کے ساتھ اختلاف
- آر ایس آئی اور بی بی اور بیک وقت اوور سیلڈ
- رولنگ ہائکن آشی موم بتیاں
- کمبو 2/20 ای ایم اے اور بینڈ پاس فلٹر
- ای ایس ایس ایم اے