ہول لائن
مصنف:چاؤ ژانگ، تاریخ: 2022-05-20 16:58:28ٹیگز:ایچ ایم اے
یہ اشارے بیل مارکیٹ کے ادوار کا تعین کرتا ہے جب خریدار اور ہولڈ سرمایہ کار اثاثہ رکھ سکتا ہے ، اور ریچھ مارکیٹ کے ادوار جب انہیں اسے رکھنے سے گریز کرنا چاہئے۔ اگرچہ یہ بنیادی طور پر کریپٹو کرنسیوں کو ذہن میں رکھتے ہوئے ڈیزائن کیا گیا تھا ، لیکن اسے کسی بھی مارکیٹ کے لئے کامیابی کے ساتھ استعمال کیا جاسکتا ہے۔
تکنیکی طور پر ، اشارے ایک غیر متوازن رجحان فلٹر ہے جس کا مقصد اس حقیقت کو مدنظر رکھنا ہے کہ مارکیٹ کی فروخت اوپر کے رجحانات سے زیادہ تیز ہوتی ہے۔ الگورتھم میں دو نظام ہیں
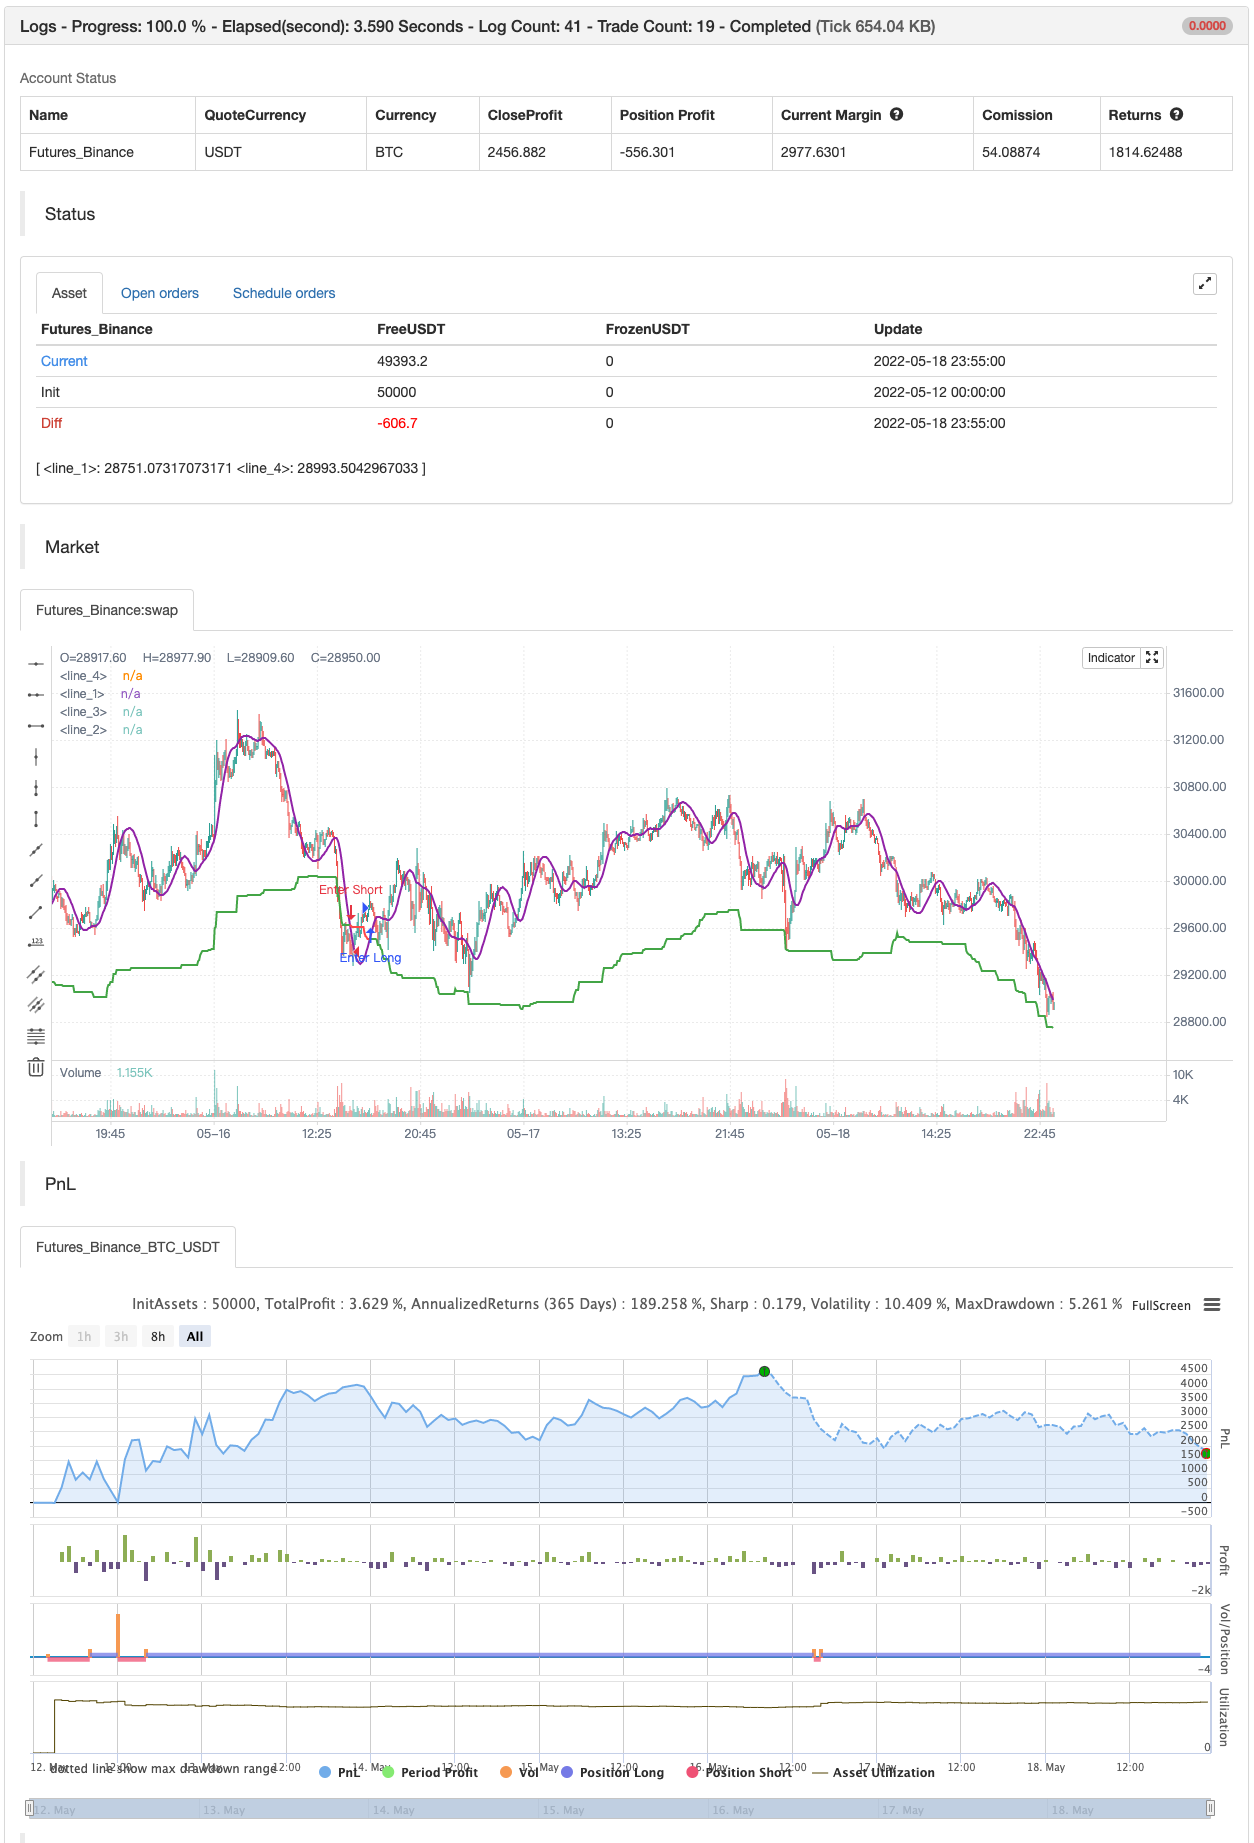
استعمال کا طریقہ قدم کی طرح لائن اہم رجحان فلٹر ہے۔ یہ ایک اپ ٹرینڈ میں سبز اور ڈاؤن ٹرینڈ میں سرخ رنگ کی ہے۔ جب ہموار کرنا آن ہوتا ہے تو ، رجحان فلٹر کے علاوہ ، اشارے میں ایک جامنی رنگ کی لائن دکھائی دیتی ہے۔ یہ قیمت کا ہول موونگ ایوریج (ایچ ایم اے) ہے۔ اس معاملے میں ، اشارے قیمت کے بجائے اس لائن کا استعمال کرتے ہوئے رجحان فلٹر کے ساتھ کراسنگ تلاش کرتا ہے۔ جب قیمت یا ہموار لائن اوپر والے ٹرینڈ فلٹر کو عبور کرتی ہے تو ، یہ ایک اپ ٹرینڈ سگنل ہے۔ اشارے ایسے کراسنگ کو سبز حلقوں کے ساتھ نشان زد کرتا ہے۔ یہ اپ ٹرینڈ میں چارٹ کے پس منظر کو سبز رنگ کا بھی رنگ دیتا ہے۔ نیچے والے ٹرینڈ فلٹر کو عبور کرنے والی قیمت یا جامنی رنگ کی لائن کا مطلب ایک ڈاؤن ٹرینڈ سگنل ہے۔ ڈاؤن ٹرینڈ سگنل سرخ حلقوں کے طور پر دکھائے جاتے ہیں۔ ڈاؤن ٹرینڈ میں چارٹ کا پس منظر سرخ ہوجاتا ہے۔
ترتیبات
حساسیت
بیک ٹسٹ

/*backtest
start: 2022-05-12 00:00:00
end: 2022-05-18 23:59:00
period: 5m
basePeriod: 1m
exchanges: [{"eid":"Futures_Binance","currency":"BTC_USDT"}]
*/

// This source code is subject to the terms of the Mozilla Public License 2.0 at https://mozilla.org/MPL/2.0/
// © AstrideUnicorn

// Asymmetrical Trend Filter aka HODL Line

//@version=5
indicator("HODL LINE", overlay=true)

// initialize indicator period parameter and the asymmetry paramter
length = 300
asymmetry =  0.05 //input.float(defval=0.05,step=0.01, minval=0.01, maxval=0.3)

// script inputs
sensitivity = input.string(defval="Hold Short Term", title="Sensitivity", options=['Super Sensitive','Hold Short Term', 'Hold Medium Term', 'Hold Long Term'])
use_smoothing = input.bool(defval=true, title="Use Smoothing")


// Set the indicator period based on the choosen sensitivity
if sensitivity == 'Super Sensitive'
    length:=50

if sensitivity == 'Hold Short Term'
    length:=100

if sensitivity == 'Hold Medium Term'
    length:=300

if sensitivity == 'Hold Long Term'
    length:=500

// Calculate HODL Line - an assymetric trend filter
HODL_line = (ta.highest(close,length) + ta.lowest(close,length))/(2.0 + asymmetry)

// Calculate smoothed price time series
smoothed_price = ta.hma(close,50)

// Use closing price or smoothed price based on the choosen option for smoothing
price_model = use_smoothing ? smoothed_price : close

// Define conditional color for the HODL Line
hodl_line_color = price_model >= HODL_line ? color.green : color.red

// define the HODL Line crossing conditions
crossing_condition_bull = ta.crossover(price_model, HODL_line)
crossing_condition_bear = ta.crossunder(price_model, HODL_line)

// plotting
plot(HODL_line, color = hodl_line_color, linewidth = 2)

plot(crossing_condition_bull?HODL_line:na, color = color.new(color.green,40), style= plot.style_circles, linewidth = 20)
plot(crossing_condition_bear?HODL_line:na, color = color.new(color.red,40), style= plot.style_circles, linewidth = 20)

bgcolor(color.new(hodl_line_color,80))

plot(use_smoothing?price_model:na, color=color.purple, linewidth=2)

if crossing_condition_bull
    strategy.entry("Enter Long", strategy.long)
else if crossing_condition_bear
    strategy.entry("Enter Short", strategy.short)
- ملٹی انڈیکیٹرز کو متحرک حرکت پذیر اوسط کے ساتھ مل کر کیوٹیفیکیشن کی حکمت عملی
- کثیر وقتی بولنگر حرکیات کو توڑنے کی حکمت عملی کو ہل ہائی لائن کی حکمت عملی کے ساتھ جوڑتا ہے
- دوہرا اوسط لائن کراسنگ کے ساتھ مل کر ہل کی متحرک اوسط کی مقدار کی حکمت عملی
- ہل کے متحرک اوسط پر مبنی ریفریجریٹر ای ایم اے رجحان کا تعین کرنے کی حکمت عملی
- لچکدار ملٹی سائیکل یکساں لائن کراسنگ حکمت عملی اعلی درجے کی
- قیمتوں کے توازن کے لئے کراس میڈ لائن ٹریڈنگ کی حکمت عملی
- ملٹی انڈیکیٹرز کا مجموعہ متحرک سٹاپ نقصان کی رجحانات کی پیروی کرنے کی حکمت عملی
- ہما نے ملٹی سائیکل کوالٹی ٹریڈنگ کی حکمت عملی کو متحرک اسٹاپ نقصان کے ساتھ جوڑ دیا
- اعلی درجے کی مرکب اوسط اور مارکیٹ کی رفتار کے رجحانات کو پکڑنے کی حکمت عملی
- کثیر دورانیہ ہل چلتی اوسط لائن کراسنگ کی حکمت عملی
- آر ایس آئی اور ایم اے کے مابین حکمت عملی
- شینن اینٹروپی V2
- SUPERTREND ATR کے ساتھ ٹریلنگ سٹاپ نقصان
- حجم بہاؤ v3
- کرپٹو فیوچر گھنٹے کے ساتھ scalping کے ma & rsi - ogcheckers
- اے ٹی آر ہموار
- آرڈر بلاک فائنڈر
- TrendScalp-FractalBox-3EMA
- QQE سگنل
- U بٹ گرڈ طول و عرض فلٹر
- CM MACD کسٹم اشارے - متعدد ٹائم فریم - V2
- 2 حرکت پذیر اوسط رنگ سمت کا پتہ لگانے
- اسکیلپنگ پل بیک ٹول R1
- خرید و فروخت کی حکمت عملی AO+Stoch+RSI+ATR پر منحصر ہے
- ای ایم اے ٹرینڈ کلاؤڈ
- ریڈ کے حجم تیز رفتار سمت توانائی کا تناسب
- Donchian بریک آؤٹ کوئی repaint
- ریڈ کے مومنٹم بارز
- سپر جمپ ٹرن بیک بولنگر بینڈ
- فوکوز رجحان
- جانی کی BOT