اسٹوکاسٹک + آر ایس آئی، ڈبل حکمت عملی
مصنف:چاؤ ژانگ، تاریخ: 2022-05-25 16:12:14ٹیگز:اسٹاکآر ایس آئی
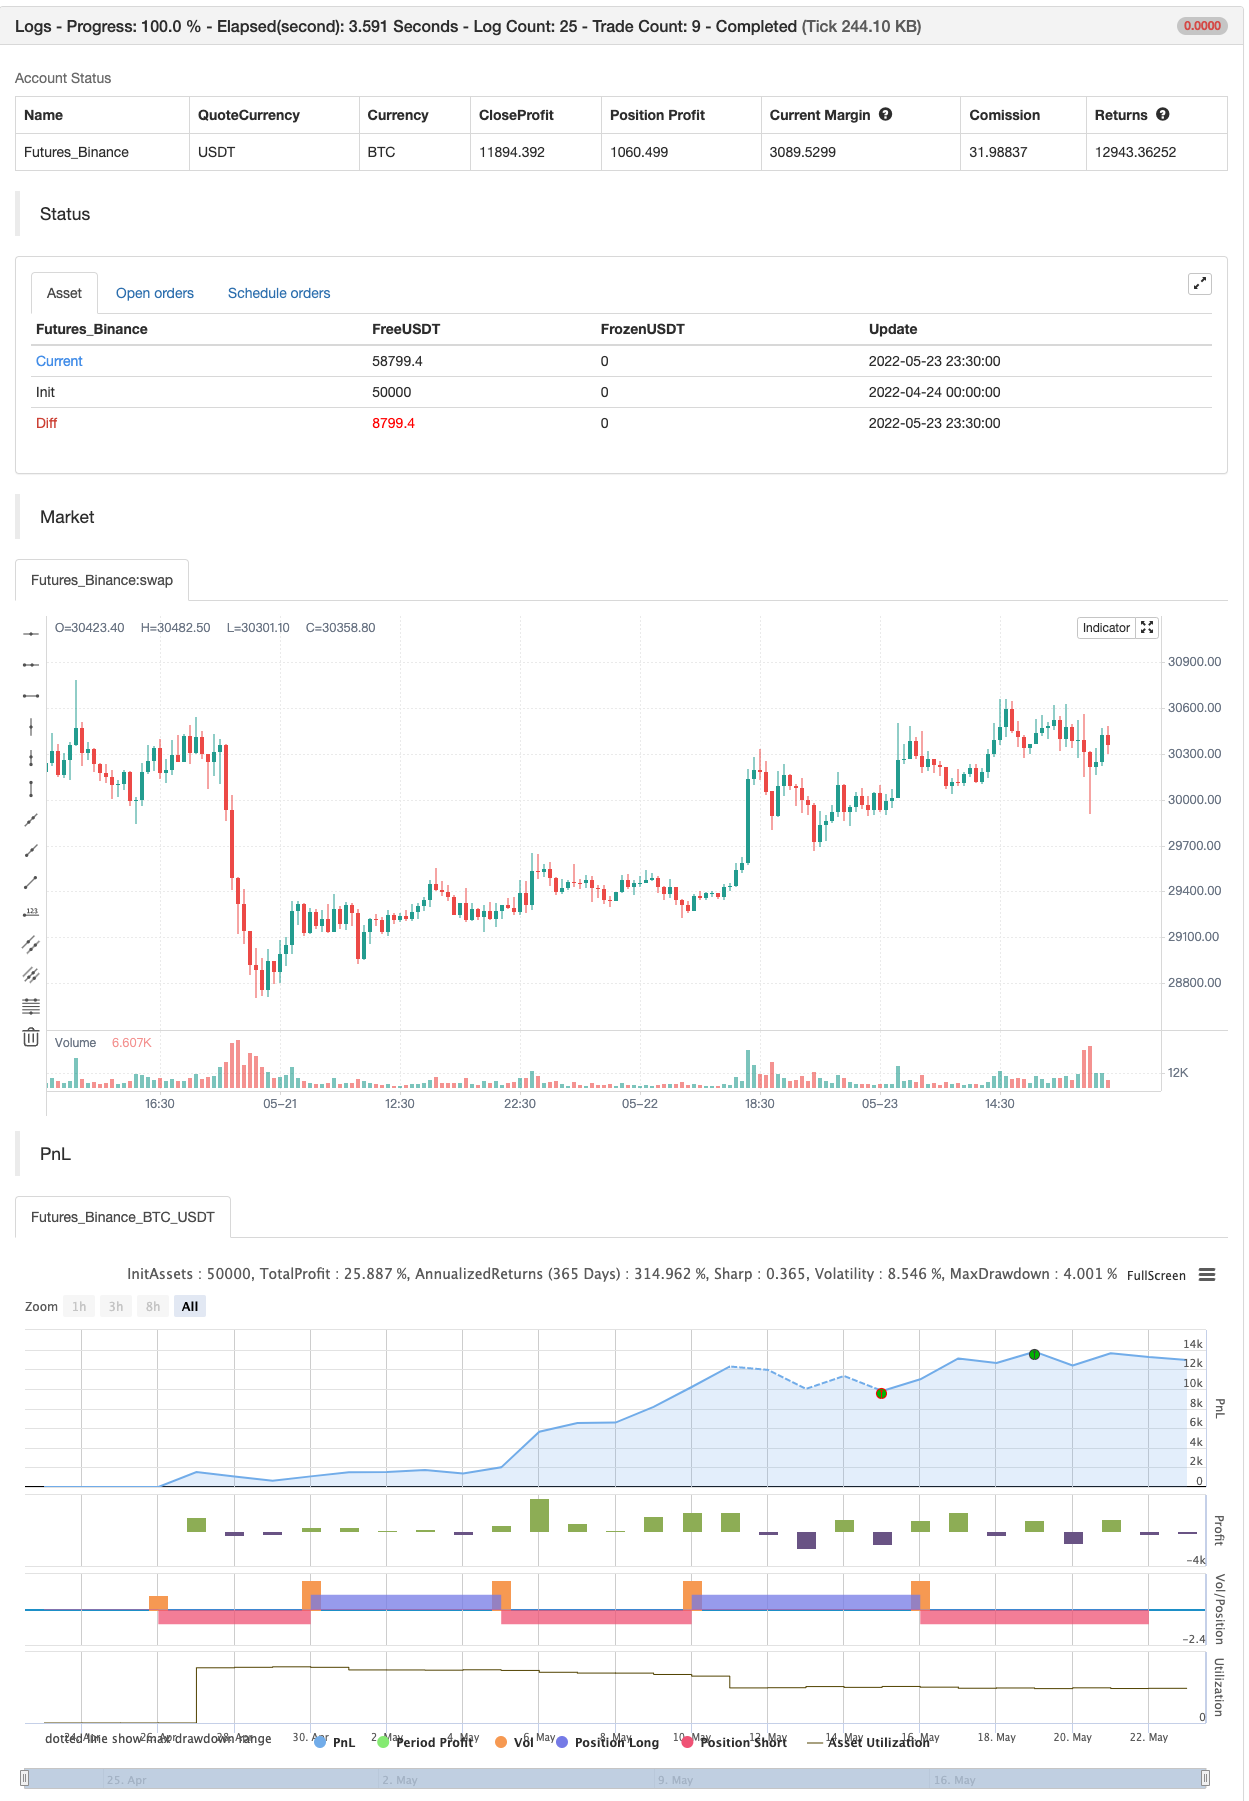
یہ حکمت عملی کلاسیکی آر ایس آئی حکمت عملی کو یکجا کرتی ہے جب آر ایس آئی 70 سے زیادہ بڑھتا ہے (یا جب یہ 30 سے کم ہوجاتا ہے تو خریدتا ہے) ، کلاسیکی اسٹوکاسٹک سست حکمت عملی کے ساتھ فروخت کرنے کے لئے جب اسٹوکاسٹک آسکیلیٹر 80 کی قیمت سے زیادہ ہے (اور جب یہ قیمت 20 سے کم ہے تو خریدنے کے لئے).
یہ سادہ حکمت عملی صرف اس وقت شروع ہوتی ہے جب آر ایس آئی اور اسٹوکاسٹک دونوں ایک ساتھ زیادہ خریدنے یا زیادہ فروخت کی حالت میں ہوتے ہیں۔ ایس اینڈ پی 500 کا ایک گھنٹے کا چارٹ حال ہی میں اس ڈبل حکمت عملی کے ساتھ کافی اچھی طرح سے کام کرتا ہے۔
ویسے یہ حکمت عملی
تمام تجارت میں اعلی خطرہ شامل ہوتا ہے۔ ماضی کی کارکردگی لازمی طور پر مستقبل کے نتائج کی نشاندہی نہیں کرتی ہے۔
بیک ٹسٹ

/*backtest
start: 2022-04-24 00:00:00
end: 2022-05-23 23:59:00
period: 30m
basePeriod: 15m
exchanges: [{"eid":"Futures_Binance","currency":"BTC_USDT"}]
*/

//@version=2
strategy("Stochastic + RSI, Double Strategy (by ChartArt)", shorttitle="CA_-_RSI_Stoch_Strat", overlay=true)

// ChartArt's Stochastic Slow + Relative Strength Index, Double Strategy
//
// Version 1.0
// Idea by ChartArt on October 23, 2015.
//
// This strategy combines the classic RSI
// strategy to sell when the RSI increases
// over 70 (or to buy when it falls below 30),
// with the classic Stochastic Slow strategy
// to sell when the Stochastic oscillator
// exceeds the value of 80 (and to buy when
// this value is below 20).
//
// This simple strategy only triggers when
// both the RSI and the Stochastic are together
// in overbought or oversold conditions.
//
// List of my work:
// https://www.tradingview.com/u/ChartArt/


///////////// Stochastic Slow
Stochlength = input(14, minval=1, title="lookback length of Stochastic")
StochOverBought = input(80, title="Stochastic overbought condition")
StochOverSold = input(20, title="Stochastic oversold condition")
smoothK = input(3, title="smoothing of Stochastic %K ")
smoothD = input(3, title="moving average of Stochastic %K")
k = sma(stoch(close, high, low, Stochlength), smoothK)
d = sma(k, smoothD)


///////////// RSI
RSIlength = input( 14, minval=1 , title="lookback length of RSI")
RSIOverBought = input( 70  , title="RSI overbought condition")
RSIOverSold = input( 30  , title="RSI oversold condition")
RSIprice = close
vrsi = rsi(RSIprice, RSIlength)


///////////// Double strategy: RSI strategy + Stochastic strategy

if (not na(k) and not na(d))
    if (crossover(k,d) and k < StochOverSold)
        if (not na(vrsi)) and (crossover(vrsi, RSIOverSold))
            strategy.entry("LONG", strategy.long, comment="StochLE + RsiLE")


if (crossunder(k,d) and k > StochOverBought)
    if (crossunder(vrsi, RSIOverBought))
        strategy.entry("SHORT", strategy.short, comment="StochSE + RsiSE")


//plot(strategy.equity, title="equity", color=red, linewidth=2, style=areabr)
- ملٹی انڈیکیٹرز اسمارٹ پرامڈ حکمت عملی
- متعدد اشارے کے ساتھ ٹرینڈ ٹریک ٹریڈنگ کی حکمت عملی: متوازن اور اوسط لائن سسٹم پر مبنی ایک مقدار کا تجزیہ
- بلنگ بینڈ کی طرف سے بے ترتیب RSI حد کی سگنلنگ کی حکمت عملی
- خرید و فروخت کی حکمت عملی AO+Stoch+RSI+ATR پر منحصر ہے
- دو یکساں متحرک علاقائی رجحانات کی پیروی کی حکمت عملی
- کثیر الاضلاع رجحانات کی رفتار ٹریڈنگ کی حکمت عملی کو خطرے کے انتظام کے نظام کے ساتھ مل کر
- بولنگر بینڈ اسٹوکاسٹک آر ایس آئی انتہائی حکمت عملی
- ملٹی فیکٹر فیوژن حکمت عملی
- ای ایم اے/ایس ایم اے کثیر اشارے کے لئے جامع رجحانات کی نگرانی کی حکمت عملی
- بڑھا ہوا متحرک ہلچل اور بے ترتیب انحراف کی مقدار کی تجارت کی حکمت عملی
- ایس ایس ایل چینل
- ہل سویٹ حکمت عملی
- پیرابولک SAR خریدیں اور فروخت کریں
- پییوٹ پر مبنی ٹریلنگ زیادہ سے زیادہ اور کم سے کم
- نِک رِپاک ٹریلنگ ریورس (NRTR)
- ZigZag PA حکمت عملی V4.1
- دن کے اندر خرید/فروخت
- ٹوٹا ہوا فریکٹل: کسی کا ٹوٹا ہوا خواب آپ کا منافع ہے!
- منافع بڑھانے والا PMax
- ناقص فتح کی حکمت عملی
- سوئنگ ہول/آر ایس آئی/ای ایم اے حکمت عملی
- اسکیلپنگ سوئنگ ٹریڈنگ ٹول R1-4
- بہترین نگلنگ + بریک آؤٹ حکمت عملی
- بولنگر زبردست الرٹ R1
- ملٹی ایکسچینج بیک وقت پلگ ان
- ٹرائیگون سود (چھوٹی کرنسیوں کی قیمتوں میں فرق حاصل کرنا)
- بائی بٹ ریورس کنٹریکٹ متحرک گرڈ (خصوصی گرڈ)
- MT4 MT5 + متحرک متغیرات کے لئے ٹریڈنگ ویو انتباہات
- میٹرکس سیریز
- سپر اسکیلپر - 5 منٹ 15 منٹ