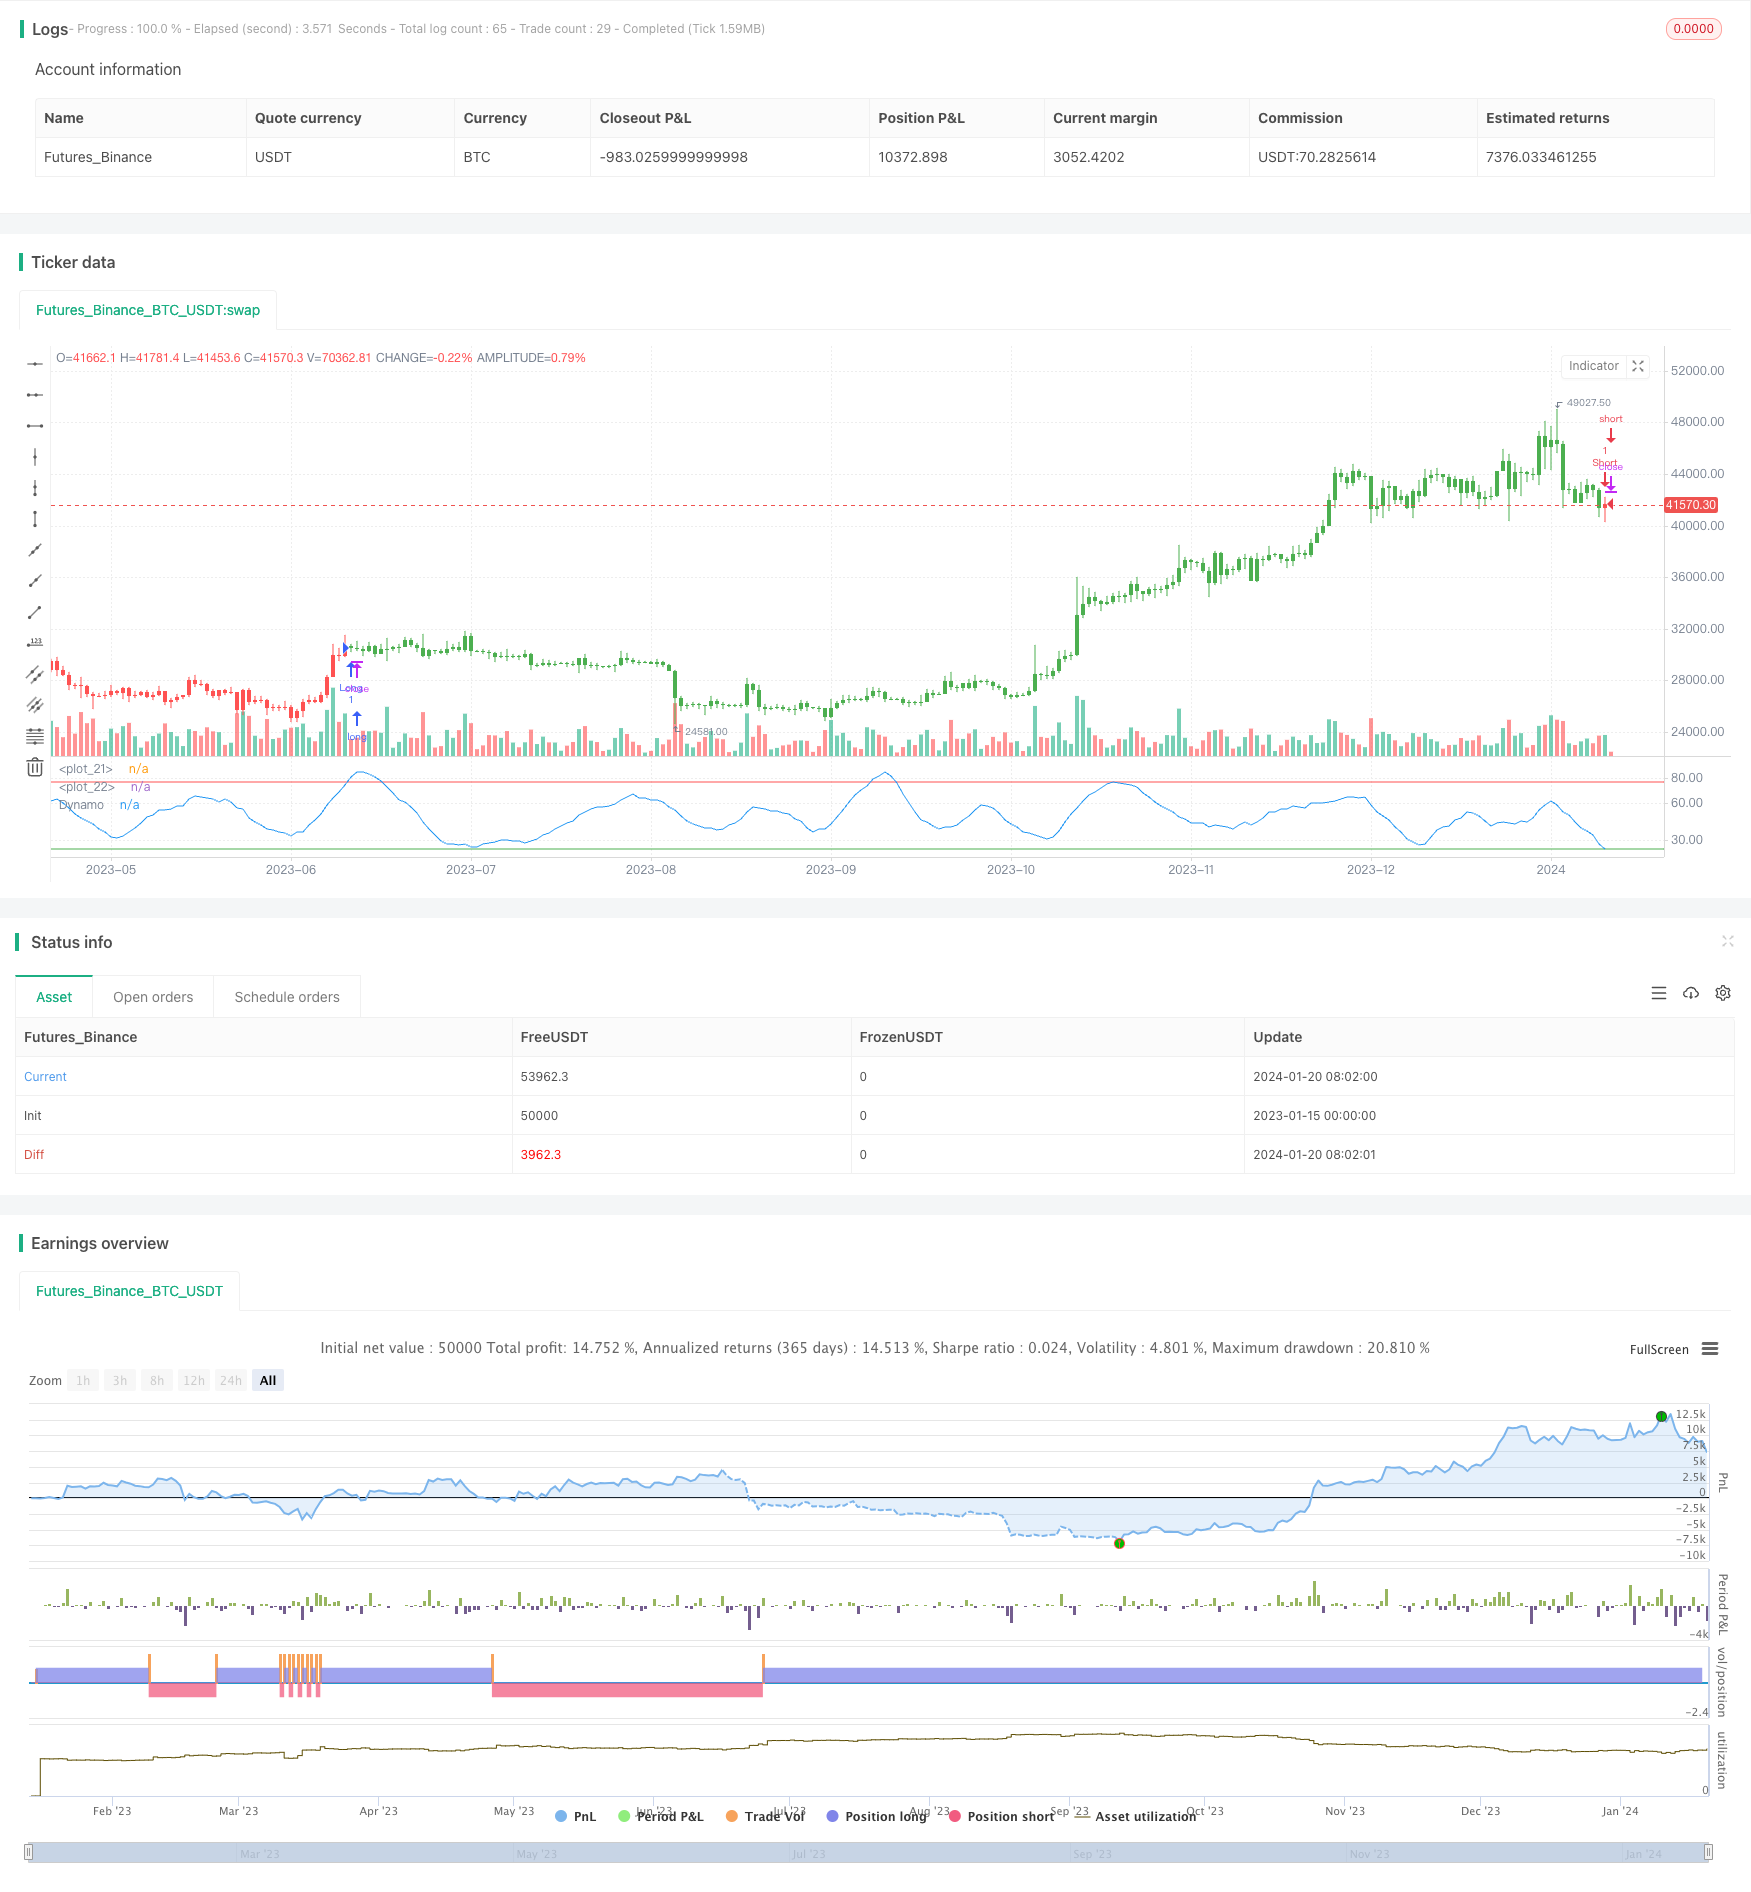
متحرک رفتار آسکیلیٹر ٹریڈنگ کی حکمت عملی
مصنف:چاؤ ژانگٹیگز:

جائزہ
متحرک رفتار آسکیلیٹر ٹریڈنگ کی حکمت عملی ای مارشل وال کے ذریعہ جولائی 1996 میں فیوچر میگزین میں شائع ہونے والے ایک مضمون میں تجویز کردہ ڈائنامو اشارے پر مبنی ہے۔ یہ رجحانات کے اثرات کو ختم کرنے کے لئے معیاری آسکیلیٹر کو معمول پر لاتا ہے۔
حکمت عملی منطق
فوائد کا تجزیہ
اس حکمت عملی کے اہم فوائد یہ ہیں:
-
ڈائنامو اشارے کا استعمال کرتے ہوئے، یہ رجحانات کے اثرات کو ختم کرتا ہے اور زیادہ قابل اعتماد تجارتی سگنل پیدا کرتا ہے.
-
قوانین سادہ اور واضح ہیں، ان پر عملدرآمد کرنا آسان ہے۔
خطرے کا تجزیہ
اس حکمت عملی کے اہم خطرات یہ ہیں:
اصلاح کی ہدایات
حکمت عملی کو مندرجہ ذیل پہلوؤں میں بہتر بنایا جاسکتا ہے:
-
بہترین معاہدہ اور پیرامیٹر مجموعہ تلاش کرنے کے لئے مختلف مارکیٹوں سے ڈیٹا کی جانچ کریں.
خلاصہ
/*backtest
start: 2023-01-15 00:00:00
end: 2024-01-21 00:00:00
period: 1d
basePeriod: 1h
exchanges: [{"eid":"Futures_Binance","currency":"BTC_USDT"}]
*/

//@version=2
////////////////////////////////////////////////////////////
//  Copyright by HPotter v1.0 10/04/2017
// In July 1996 Futures magazine, E. Marshall Wall introduces the
// Dynamic Momentum Oscillator (Dynamo). Please refer to this article
// for interpretation.
// The Dynamo oscillator is a normalizing function which adjusts the
// values of a standard oscillator for trendiness by taking the difference
// between the value of the oscillator and a moving average of the oscillator
// and then subtracting that value from the oscillator midpoint.
//
// You can change long to short in the Input Settings
// Please, use it only for learning or paper trading. Do not for real trading
////////////////////////////////////////////////////////////
strategy(title="Dynamo", shorttitle="Dynamo")
OscLen = input(10, minval=1)
MALen = input(20, minval=1)
HiBand = input(77, minval=1)
LowBand = input(23)
reverse = input(false, title="Trade reverse")
hline(HiBand, color=red, linestyle=line)
hline(LowBand, color=green, linestyle=line)
xOscK = stoch(close, high, low, OscLen)
xOscAvg = sma(xOscK, OscLen)
xMAVal = sma(xOscAvg, MALen)
maxNum = 9999999
LowestSoFar = iff(xOscAvg < nz(LowestSoFar[1], maxNum), xOscAvg, nz(LowestSoFar[1], maxNum))
HighestSoFar = iff(xOscAvg > nz(HighestSoFar[1]), xOscAvg, nz(HighestSoFar[1]))
MidPnt = (LowestSoFar + HighestSoFar) / 2
nRes = MidPnt - (xMAVal - xOscAvg)
pos = iff(nRes > HiBand, 1,
	     iff(nRes < LowBand, -1, nz(pos[1], 0)))
possig = iff(reverse and pos == 1, -1,
          iff(reverse and pos == -1, 1, pos))
if (possig == 1)
    strategy.entry("Long", strategy.long)
if (possig == -1)
    strategy.entry("Short", strategy.short)
barcolor(possig == -1 ? red: possig == 1 ? green : blue )
plot(nRes, color=blue, title="Dynamo")
مزید
- RSI متغیر تجارتی حکمت عملی
- چلتی اوسط کراس اوور پر مبنی کوانٹ ٹریڈنگ حکمت عملی
- ملٹی ٹائم فریم ٹرینڈ اسٹریٹیجی کے بعد
- متحرک گرڈ ٹریڈنگ کی حکمت عملی
- ایک دوہری حرکت پذیر اوسط تصدیق فائدہ لائن کی حکمت عملی
- کریپٹو آر ایس آئی مینی سنیپر فوری ردعمل رجحان حکمت عملی کے بعد
- یہ حکمت عملی حرکت پذیر اوسط لائنوں پر مبنی ایک رفتار کی حکمت عملی ہے
- چلتی اوسط پر مبنی حکمت عملی کے بعد رجحان
- ٹرینڈ ٹریکنگ بریک آؤٹ حکمت عملی
- ریورس آر ایس آئی ٹرینڈ ٹریکنگ ای ٹی ایف ٹریڈنگ کی حکمت عملی
- ADX اشارے پر مبنی رجحان ٹریکنگ اور قلیل مدتی تجارتی حکمت عملی
- رفتار رجحان دوہری حکمت عملی
- متحرک سی سی آئی سپورٹ اور مزاحمت کی حکمت عملی
- QQE مومنٹم ٹریڈنگ حکمت عملی
- گاس کی لہر کی پیشن گوئی کی حکمت عملی
- متحرک حرکت پذیر EMAs مجموعہ مقدار کی حکمت عملی
- ڈونچیئن چینل رجحان کی پیروی کی حکمت عملی