Chiến lược ATR đa dạng về tương lai tiền kỹ thuật số (đào tạo)
Tác giả:Những nhà phát minh định lượng - những giấc mơ nhỏ, Tạo: 2022-01-07 11:11:54, Cập nhật: 2023-09-15 20:54:33
Chiến lược ATR đa dạng về tương lai tiền kỹ thuật số (đào tạo)
Gần đây, người dùng nền tảng rất mong muốn có thể chuyển một chiến lược ngôn ngữ Mac thành một chiến lược JavaScript, để có thể thêm nhiều ý tưởng tối ưu hóa một cách linh hoạt; thậm chí mở rộng chiến lược đến nhiều phiên bản nhất có thể. Vì chiến lược ngôn ngữ Mac thường là chiến lược xu hướng, và nhiều chiến lược được thực hiện theo mô hình giá đóng cửa.
Chiến lược chuyển đổi tiếng Việt
TR:=MAX(MAX((H-L),ABS(REF(C,1)-H)),ABS(REF(C,1)-L));
ATR:=EMA(TR,LENGTH2);

MIDLINE^^EMA((H + L + C)/3,LENGTH1);
UPBAND^^MIDLINE + N*ATR;
DOWNBAND^^MIDLINE - N*ATR;


BKVOL=0 AND C>=UPBAND AND REF(C,1)<REF(UPBAND,1),BPK;
SKVOL=0 AND C<=DOWNBAND AND REF(C,1)>REF(DOWNBAND,1),SPK;

BKVOL>0 AND C<=MIDLINE,SP(BKVOL);
SKVOL>0 AND C>=MIDLINE,BP(SKVOL);
// 止损
// stop loss
C>=SKPRICE*(1+SLOSS*0.01),BP;
C<=BKPRICE*(1-SLOSS*0.01),SP;
AUTOFILTER;
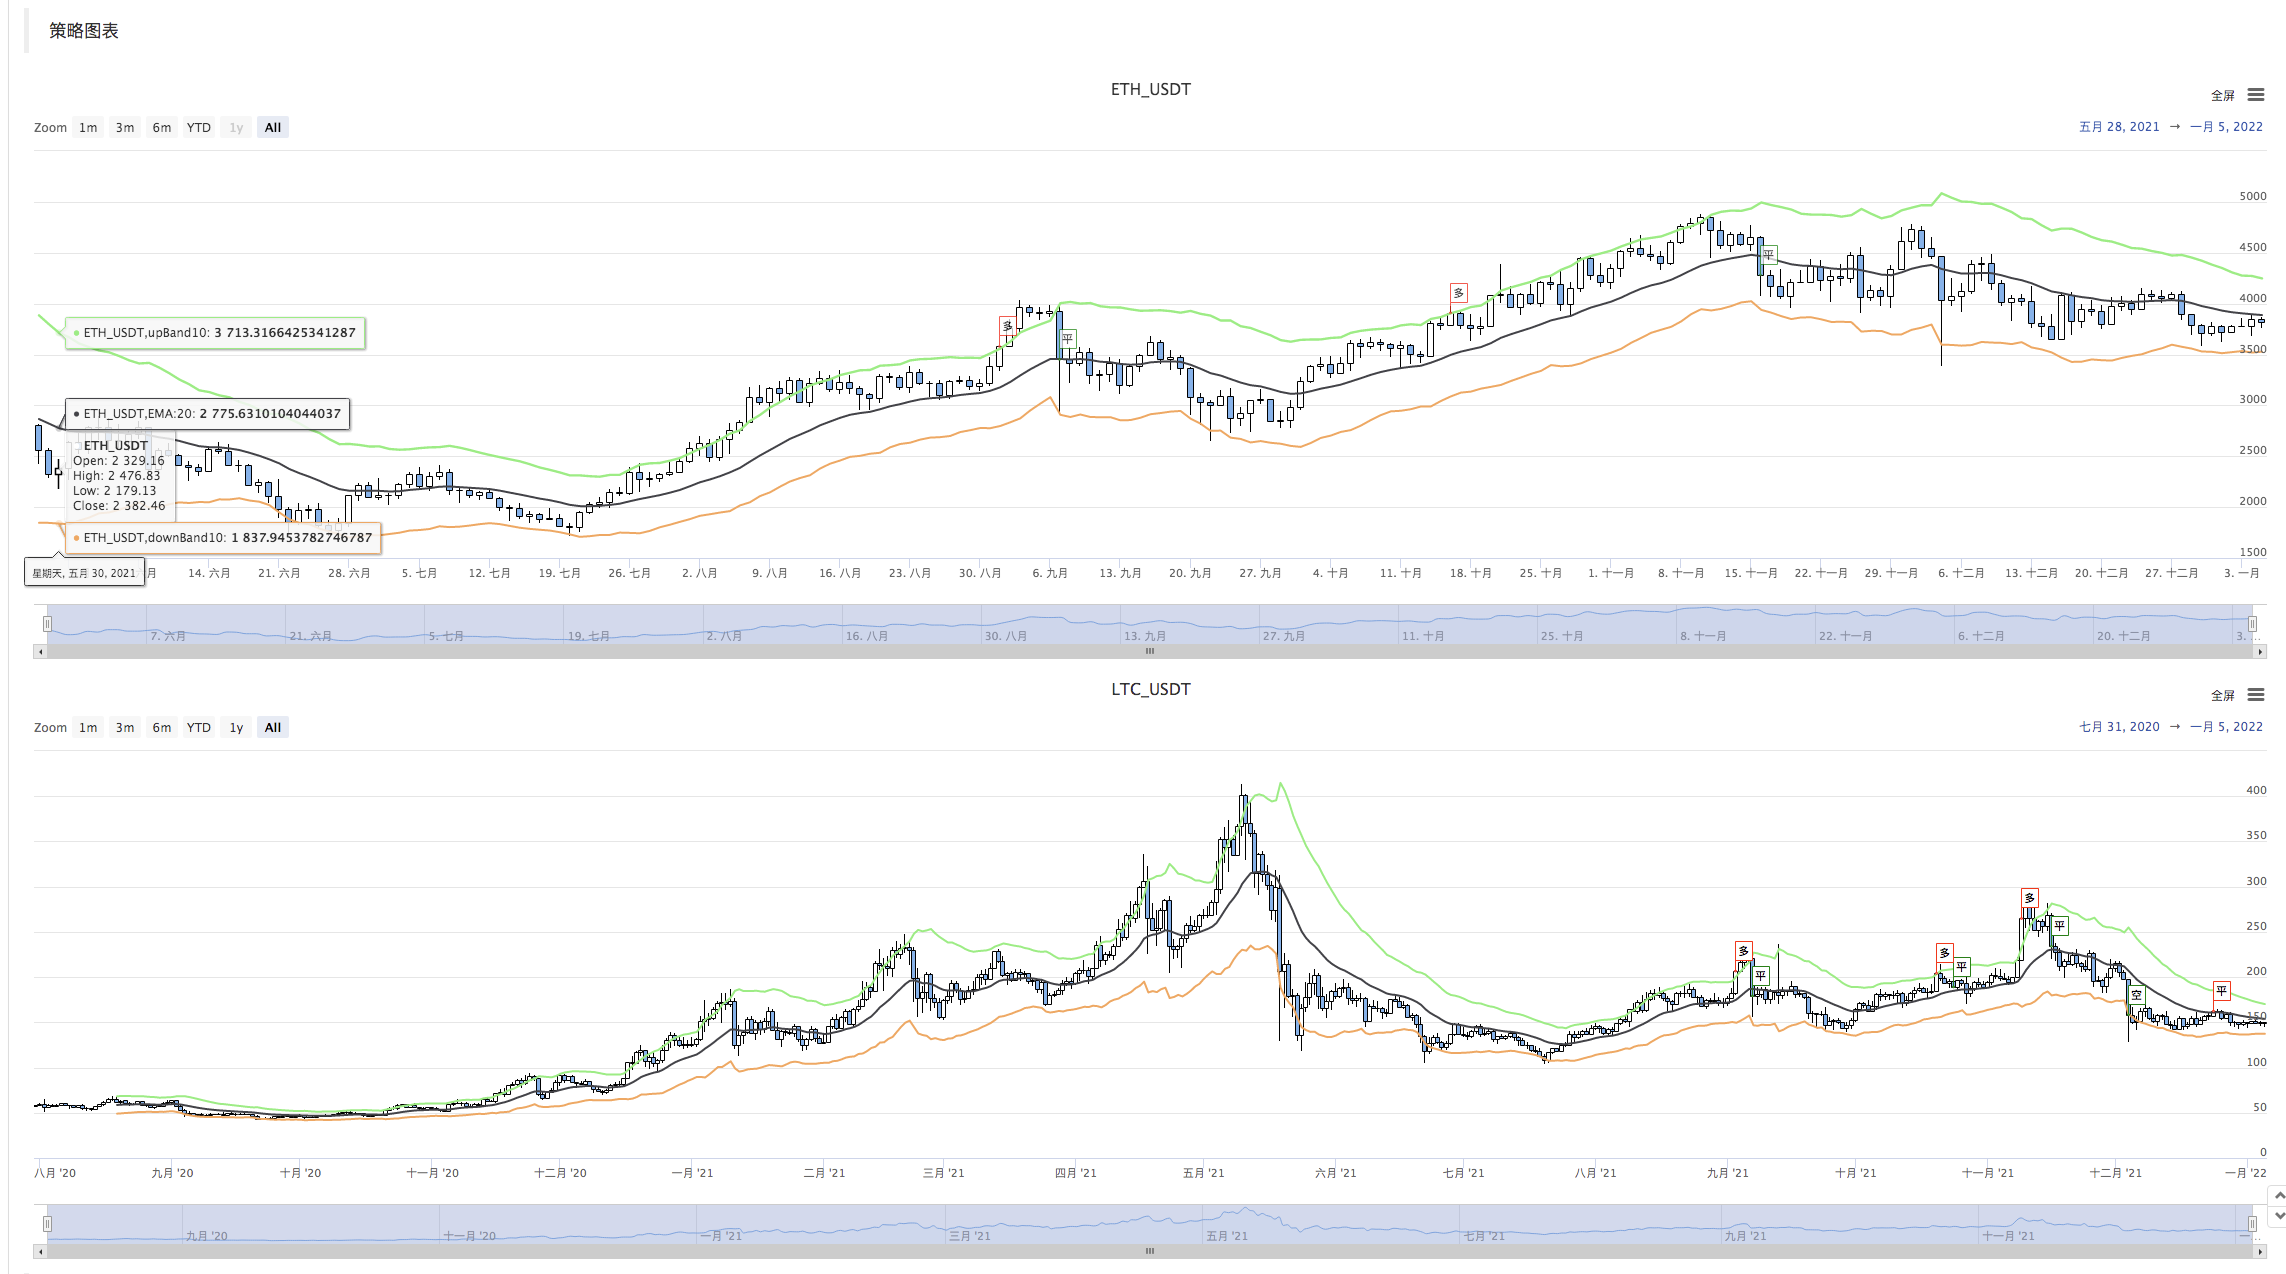
Chiến lược này có logic giao dịch đơn giản, đầu tiên tính toán ATR dựa trên các tham số, sau đó tính toán giá trung bình của tất cả các giá đóng cửa cao nhất, thấp nhất và tất cả các giá đóng cửa trên các đường KBAR, và dựa trên các dữ liệu trung bình này, tìm ra chỉ số EMA. Cuối cùng, kết hợp các hệ số N trong tham số ATR. Tính toán lên (upBand, downBand).
Khởi mở, tay ngược sẽ dựa trên giá đóng cửa phá vỡ đường ra xuống. Khi giá đóng cửa đạt đến đường trung bình, giá đóng cửa đạt đến giá dừng lỗ (theo SLOSS, SLOSS là 1 hoặc 0.01, tức 1%)). Chiến lược được thực hiện theo mô hình giá đóng cửa.
OK, sau khi hiểu được các nhu cầu chiến lược và ý tưởng của tiếng Ma, chúng ta có thể tự động chuyển nhượng.
Phân phối, thiết kế chiến lược nguyên mẫu
Các mã nguyên mẫu chiến lược không quá 1-200 dòng, để dễ dàng học các ý tưởng viết chiến lược, hãy viết chú thích trực tiếp trong mã chiến lược.
// 解析params参数,从字符串解析为对象
var arrParam = JSON.parse(params)

// 该函数创建图表配置
function createChartConfig(symbol, atrPeriod, emaPeriod, index) {   // symbol : 交易对, atrPeriod : ATR参数周期 , emaPeriod : EMA参数周期 , index 对应的交易所对象索引
    var chart = {
        __isStock: true,
        extension: {
                layout: 'single',
                height: 600,
        },
        title : { text : symbol},
        xAxis: { type: 'datetime'},
        series : [
            {
                type: 'candlestick',    // K线数据系列
                name: symbol,
                id: symbol + "-" + index,
                data: []
            }, {
                type: 'line',           // EMA
                name: symbol + ',EMA:' + emaPeriod,
                data: [],
            }, {
                type: 'line',           // upBand
                name: symbol + ',upBand' + atrPeriod,
                data: []
            }, {
                type: 'line',           // downBand
                name: symbol + ',downBand' + atrPeriod,
                data: []
            }, {
                type: 'flags',
                onSeries: symbol + "-" + index,
                data: [],
            }
        ]
    }
    return chart
}

// 主要逻辑
function process(e, kIndex, c) {    // e 即交易所对象,exchanges[0] ... , kIndex K线数据在图表中的数据系列, c 为图表对象
    // 获取K线数据
    var r = e.GetRecords(e.param.period)
    if (!r || r.length < e.param.atrPeriod + 2 || r.length < e.param.emaPeriod + 2) {
        // K线数据长度不足则返回
        return
    }

    // 计算ATR指标
    var atr = TA.ATR(r, e.param.atrPeriod)
    var arrAvgPrice = []
    _.each(r, function(bar) {
        arrAvgPrice.push((bar.High + bar.Low + bar.Close) / 3)
    })
    // 计算EMA指标
    var midLine = TA.EMA(arrAvgPrice, e.param.emaPeriod)
    // 计算上下轨
    var upBand = []
    var downBand = []
    _.each(midLine, function(mid, index) {
        if (index < e.param.emaPeriod - 1 || index < e.param.atrPeriod - 1) {
            upBand.push(NaN)
            downBand.push(NaN)
            return
        }
        upBand.push(mid + e.param.trackRatio * atr[index])
        downBand.push(mid - e.param.trackRatio * atr[index])
    })

    // 画图
    for (var i = 0 ; i < r.length ; i++) {
        if (r[i].Time == e.state.lastBarTime) {
            // 更新
            c.add(kIndex, [r[i].Time, r[i].Open, r[i].High, r[i].Low, r[i].Close], -1)
            c.add(kIndex + 1, [r[i].Time, midLine[i]], -1)
            c.add(kIndex + 2, [r[i].Time, upBand[i]], -1)
            c.add(kIndex + 3, [r[i].Time, downBand[i]], -1)
        } else if (r[i].Time > e.state.lastBarTime) {
            // 添加
            e.state.lastBarTime = r[i].Time
            c.add(kIndex, [r[i].Time, r[i].Open, r[i].High, r[i].Low, r[i].Close])
            c.add(kIndex + 1, [r[i].Time, midLine[i]])
            c.add(kIndex + 2, [r[i].Time, upBand[i]])
            c.add(kIndex + 3, [r[i].Time, downBand[i]])
        }
    }

    // 检测持仓
    var pos = e.GetPosition()
    if (!pos) {
        return
    }
    var holdAmount = 0
    var holdPrice = 0
    if (pos.length > 1) {
        throw "同时检测到多空持仓!"
    } else if (pos.length != 0) {
        holdAmount = pos[0].Type == PD_LONG ? pos[0].Amount : -pos[0].Amount
        holdPrice = pos[0].Price
    }

    if (e.state.preBar == -1) {
        e.state.preBar = r[r.length - 1].Time
    }
    // 检测信号
    if (e.state.preBar != r[r.length - 1].Time) {   // 收盘价模型
        if (holdAmount <= 0 && r[r.length - 3].Close < upBand[upBand.length - 3] && r[r.length - 2].Close > upBand[upBand.length - 2]) {   // 收盘价上穿上轨
            if (holdAmount < 0) {   // 持有空仓,平仓
                Log(e.GetCurrency(), "平空仓", "#FF0000")
                $.CoverShort(e, e.param.symbol, Math.abs(holdAmount))
                c.add(kIndex + 4, {x: r[r.length - 2].Time, color: 'red', shape: 'flag', title: '平', text: "平空仓"})
            }
            // 开多
            Log(e.GetCurrency(), "开多仓", "#FF0000")
            $.OpenLong(e, e.param.symbol, 10)
            c.add(kIndex + 4, {x: r[r.length - 2].Time, color: 'red', shape: 'flag', title: '多', text: "开多仓"})
        } else if (holdAmount >= 0 && r[r.length - 3].Close > downBand[downBand.length - 3] && r[r.length - 2].Close < downBand[downBand.length - 2]) {  // 收盘价下穿下轨
            if (holdAmount > 0) {   // 持有多仓,平仓
                Log(e.GetCurrency(), "平多仓", "#FF0000")
                $.CoverLong(e, e.param.symbol, Math.abs(holdAmount))
                c.add(kIndex + 4, {x: r[r.length - 2].Time, color: 'green', shape: 'flag', title: '平', text: "平多仓"})
            }
            // 开空
            Log(e.GetCurrency(), "开空仓", "#FF0000")
            $.OpenShort(e, e.param.symbol, 10)
            c.add(kIndex + 4, {x: r[r.length - 2].Time, color: 'green', shape: 'flag', title: '空', text: "开空仓"})
        } else {
            // 平仓
            if (holdAmount > 0 && (r[r.length - 2].Close <= holdPrice * (1 - e.param.stopLoss) || r[r.length - 2].Close <= midLine[midLine.length - 2])) {   // 持多仓,收盘价小于等于中线,按开仓价格止损
                Log(e.GetCurrency(), "触发中线或止损,平多仓", "#FF0000")
                $.CoverLong(e, e.param.symbol, Math.abs(holdAmount))
                c.add(kIndex + 4, {x: r[r.length - 2].Time, color: 'green', shape: 'flag', title: '平', text: "平多仓"})
            } else if (holdAmount < 0 && (r[r.length - 2].Close >= holdPrice * (1 + e.param.stopLoss) || r[r.length - 2].Close >= midLine[midLine.length - 2])) {  // 持空仓,收盘价大于等于中线,按开仓价格止损
                Log(e.GetCurrency(), "触发中线或止损,平空仓", "#FF0000")
                $.CoverShort(e, e.param.symbol, Math.abs(holdAmount))
                c.add(kIndex + 4, {x: r[r.length - 2].Time, color: 'red', shape: 'flag', title: '平', text: "平空仓"})
            }
        }
        e.state.preBar = r[r.length - 1].Time
    }
}

function main() {
    var arrChartConfig = []
    if (arrParam.length != exchanges.length) {
        throw "参数和交易所对象不匹配!"
    }
    var arrState = _G("arrState")
    _.each(exchanges, function(e, index) {
        if (e.GetName() != "Futures_Binance") {
            throw "不支持该交易所!"
        }
        e.param = arrParam[index]
        e.state = {lastBarTime: 0, symbol: e.param.symbol, currency: e.GetCurrency()}
        if (arrState) {
            if (arrState[index].symbol == e.param.symbol && arrState[index].currency == e.GetCurrency()) {
                Log("恢复:", e.state)
                e.state = arrState[index]
            } else {
                throw "恢复的数据和当前设置不匹配!"
            }
        }
        e.state.preBar = -1   // 初始设置-1
        e.SetContractType(e.param.symbol)
        Log(e.GetName(), e.GetLabel(), "设置合约:", e.param.symbol)
        arrChartConfig.push(createChartConfig(e.GetCurrency(), e.param.atrPeriod, e.param.emaPeriod, index))
    })
    var chart = Chart(arrChartConfig)
    chart.reset()

    while (true) {
        _.each(exchanges, function(e, index) {
            process(e, index + index * 4, chart)
            Sleep(500)
        })
    }
}

function onexit() {
    // 记录 e.state
    var arrState = []
    _.each(exchanges, function(e) {
        arrState.push(e.state)
    })
    Log("记录:", arrState)
    _G("arrState", arrState)
}
Các tham số chiến lược:
var params = '[{
        "symbol" : "swap",    // 合约代码
        "period" : 86400,     // K线周期,86400秒即为一天
        "stopLoss" : 0.07,    // 止损系数,0.07即7%
        "atrPeriod" : 10,     // ATR指标参数
        "emaPeriod" : 10,     // EMA指标参数
        "trackRatio" : 1,     // 上下轨系数
        "openRatio" : 0.1     // 预留的开仓百分比,暂时没支持
    }, {
        "symbol" : "swap",
        "period" : 86400,
        "stopLoss" : 0.07,
        "atrPeriod" : 10,
        "emaPeriod" : 10,
        "trackRatio" : 1,
        "openRatio" : 0.1
    }]'
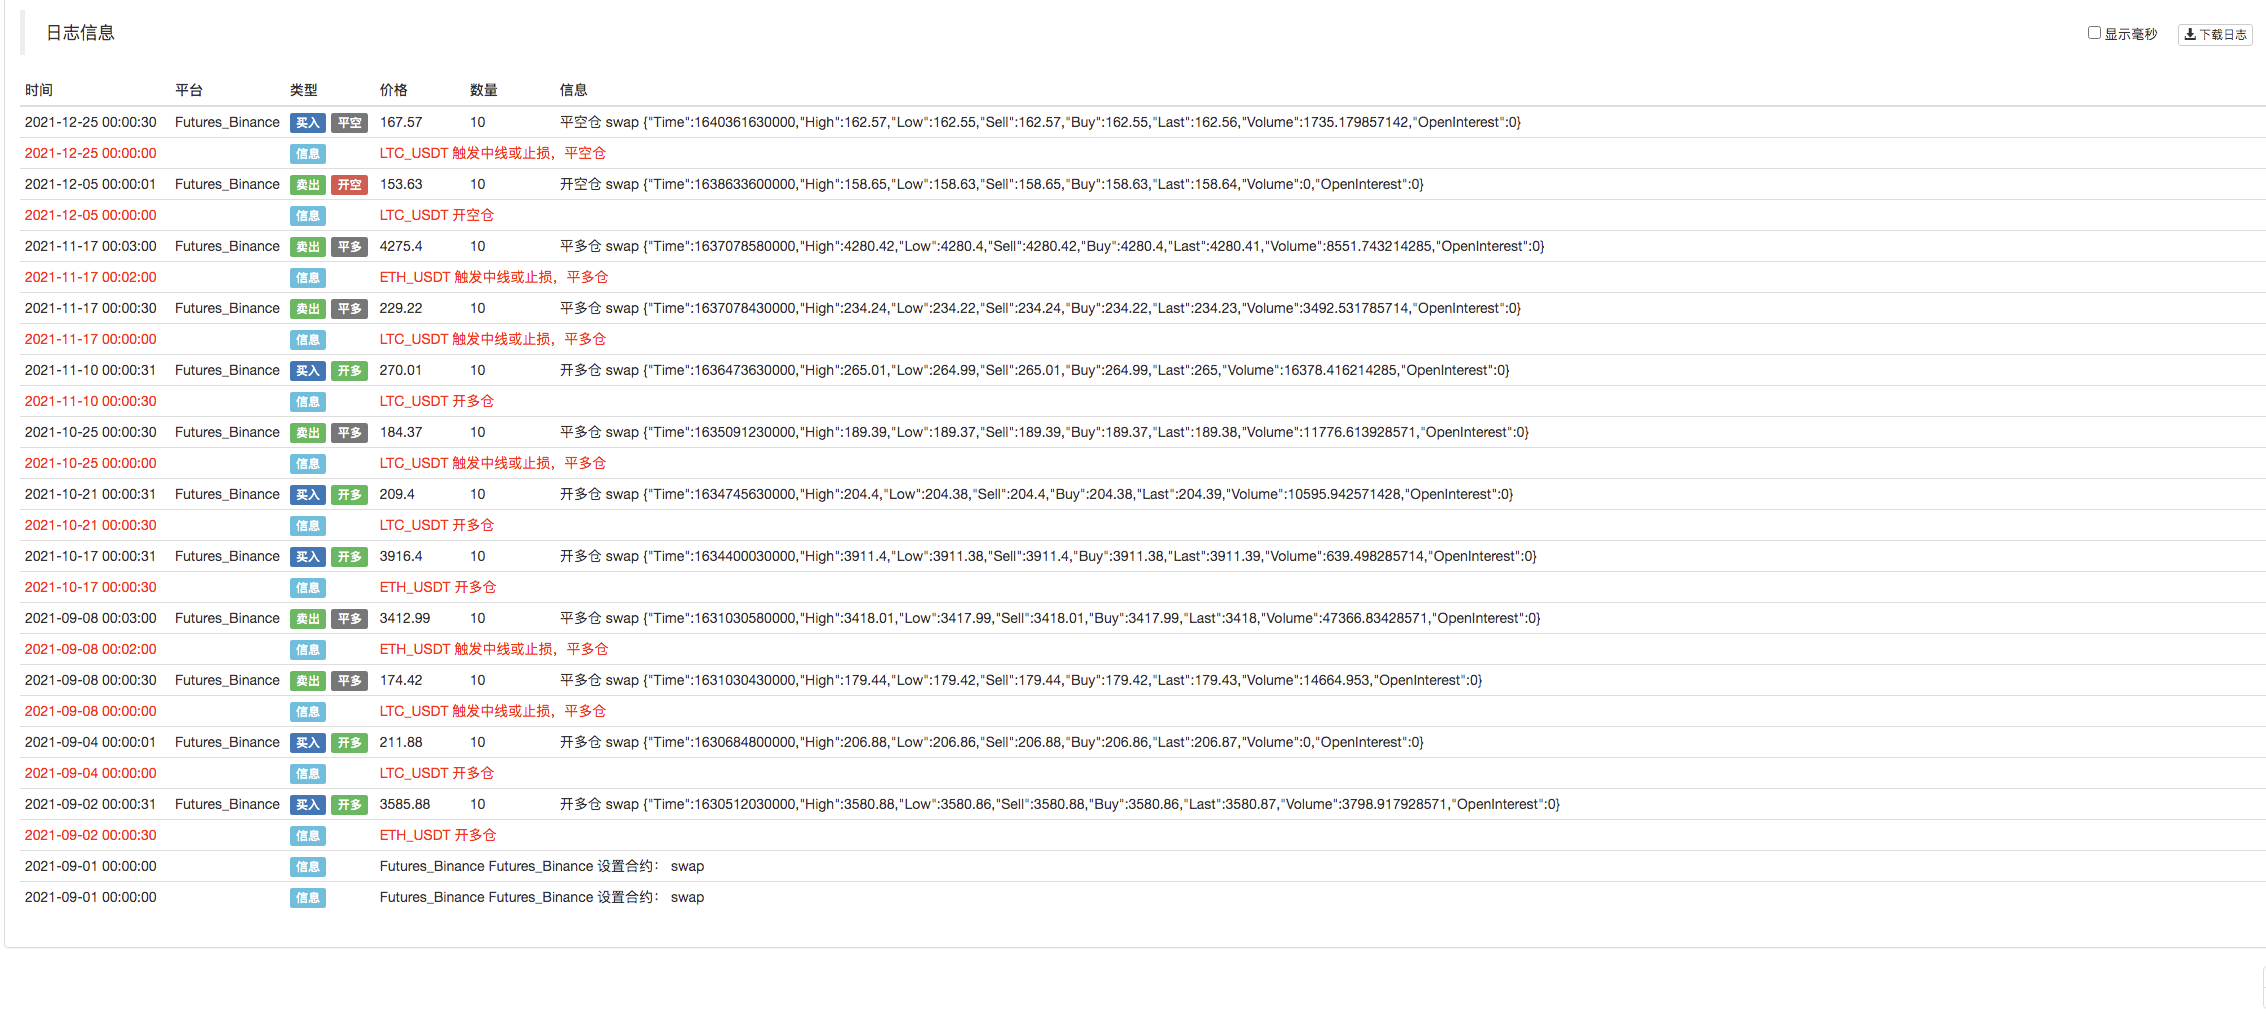
Kiểm tra lại


Nguồn mã chiến lược:https://www.fmz.com/strategy/339344
Chiến lược chỉ dùng để kiểm tra lại, học hỏi và nghiên cứu.
- Giới thiệu về Trọng tài Lead-Lag trong Cryptocurrency (2)
- Giới thiệu về bộ phận Lead-Lag trong tiền kỹ thuật số (2)
- Thảo luận về tiếp nhận tín hiệu bên ngoài của nền tảng FMZ: Một giải pháp hoàn chỉnh để tiếp nhận tín hiệu với dịch vụ Http tích hợp trong chiến lược
- Phân tích nhận tín hiệu bên ngoài nền tảng FMZ: Chiến lược xây dựng dịch vụ HTTP để nhận tín hiệu
- Giới thiệu về Trọng tài Lead-Lag trong Cryptocurrency (1)
- Giới thiệu về bộ phận Lead-Lag trong tiền kỹ thuật số (1)
- Cuộc thảo luận về tiếp nhận tín hiệu bên ngoài của nền tảng FMZ: API mở rộng VS Chiến lược Dịch vụ HTTP tích hợp
- Phân tích nhận tín hiệu bên ngoài nền tảng FMZ: API mở rộng vs chiến lược dịch vụ HTTP tích hợp
- Cuộc thảo luận về phương pháp thử nghiệm chiến lược dựa trên Random Ticker Generator
- Khám phá phương pháp thử nghiệm chiến lược dựa trên trình tạo thị trường ngẫu nhiên
- Tính năng mới của FMZ Quant: Sử dụng chức năng _Serve để tạo dịch vụ HTTP dễ dàng
- Nếu bạn chưa viết chiến lược với ngôn ngữ Pine dễ học như vậy, tôi sẽ...
- Giải thích chi tiết về chiến lược cân bằng và lưới điện
- Một cách đơn giản là một cái đẹp - cách thiết kế một chiến lược đơn giản và hiệu quả.
- Các chiến lược mới về tiền điện tử (đào tạo)
- Thiết kế một thư viện vẽ nhiều biểu đồ
- Thiết kế một thư viện đường vẽ đa biểu đồ
- 60 dòng mã thực hiện một ý tưởng - chiến lược sao chép hợp đồng.
- Thiết kế hệ thống quản lý đồng bộ đơn đặt hàng theo định lượng FMZ (2)
- Thiết kế hệ thống quản lý đồng bộ đơn đặt hàng dựa trên FMZ định lượng (1)
- Tăng cấp! chiến lược tương lai tiền kỹ thuật số
- Thị trường tiền kỹ thuật số 2021 xem xét và bỏ lỡ 10 chiến lược đơn giản nhất
- Thực hiện ngôn ngữ JavaScript của Fisher Pointer và vẽ trên FMZ
- Chiến lược hai đường thẳng đa dạng tiền mặt kỹ thuật số (giảng dạy)
- Chiến lược điểm chuyển đổi hai đường thẳng tương lai tiền kỹ thuật số (giảng dạy)
- Chiến lược và khuyến nghị hoạt động về tỷ lệ vốn
- Nghiên cứu, ví dụ về việc thiết kế chiến lược bảo hiểm hiện tại
- FMZ nền tảng Python Reptile ứng dụng thử nghiệm - thu thập nội dung thông báo của Binance
- Mô hình thiết kế chiến lược dYdX - Chiến lược giao dịch ngẫu nhiên
- Các nhà phát minh định lượng nền tảng giao dịch APP sử dụng truy cập nhanh
- Các hợp đồng tiền tệ hiện tại phân tích lợi nhuận lợi nhuận