stoch supertrd atr 200ma
Tác giả:ChaoZhang, Ngày: 2022-05-10 10:53:25Tags:EMA
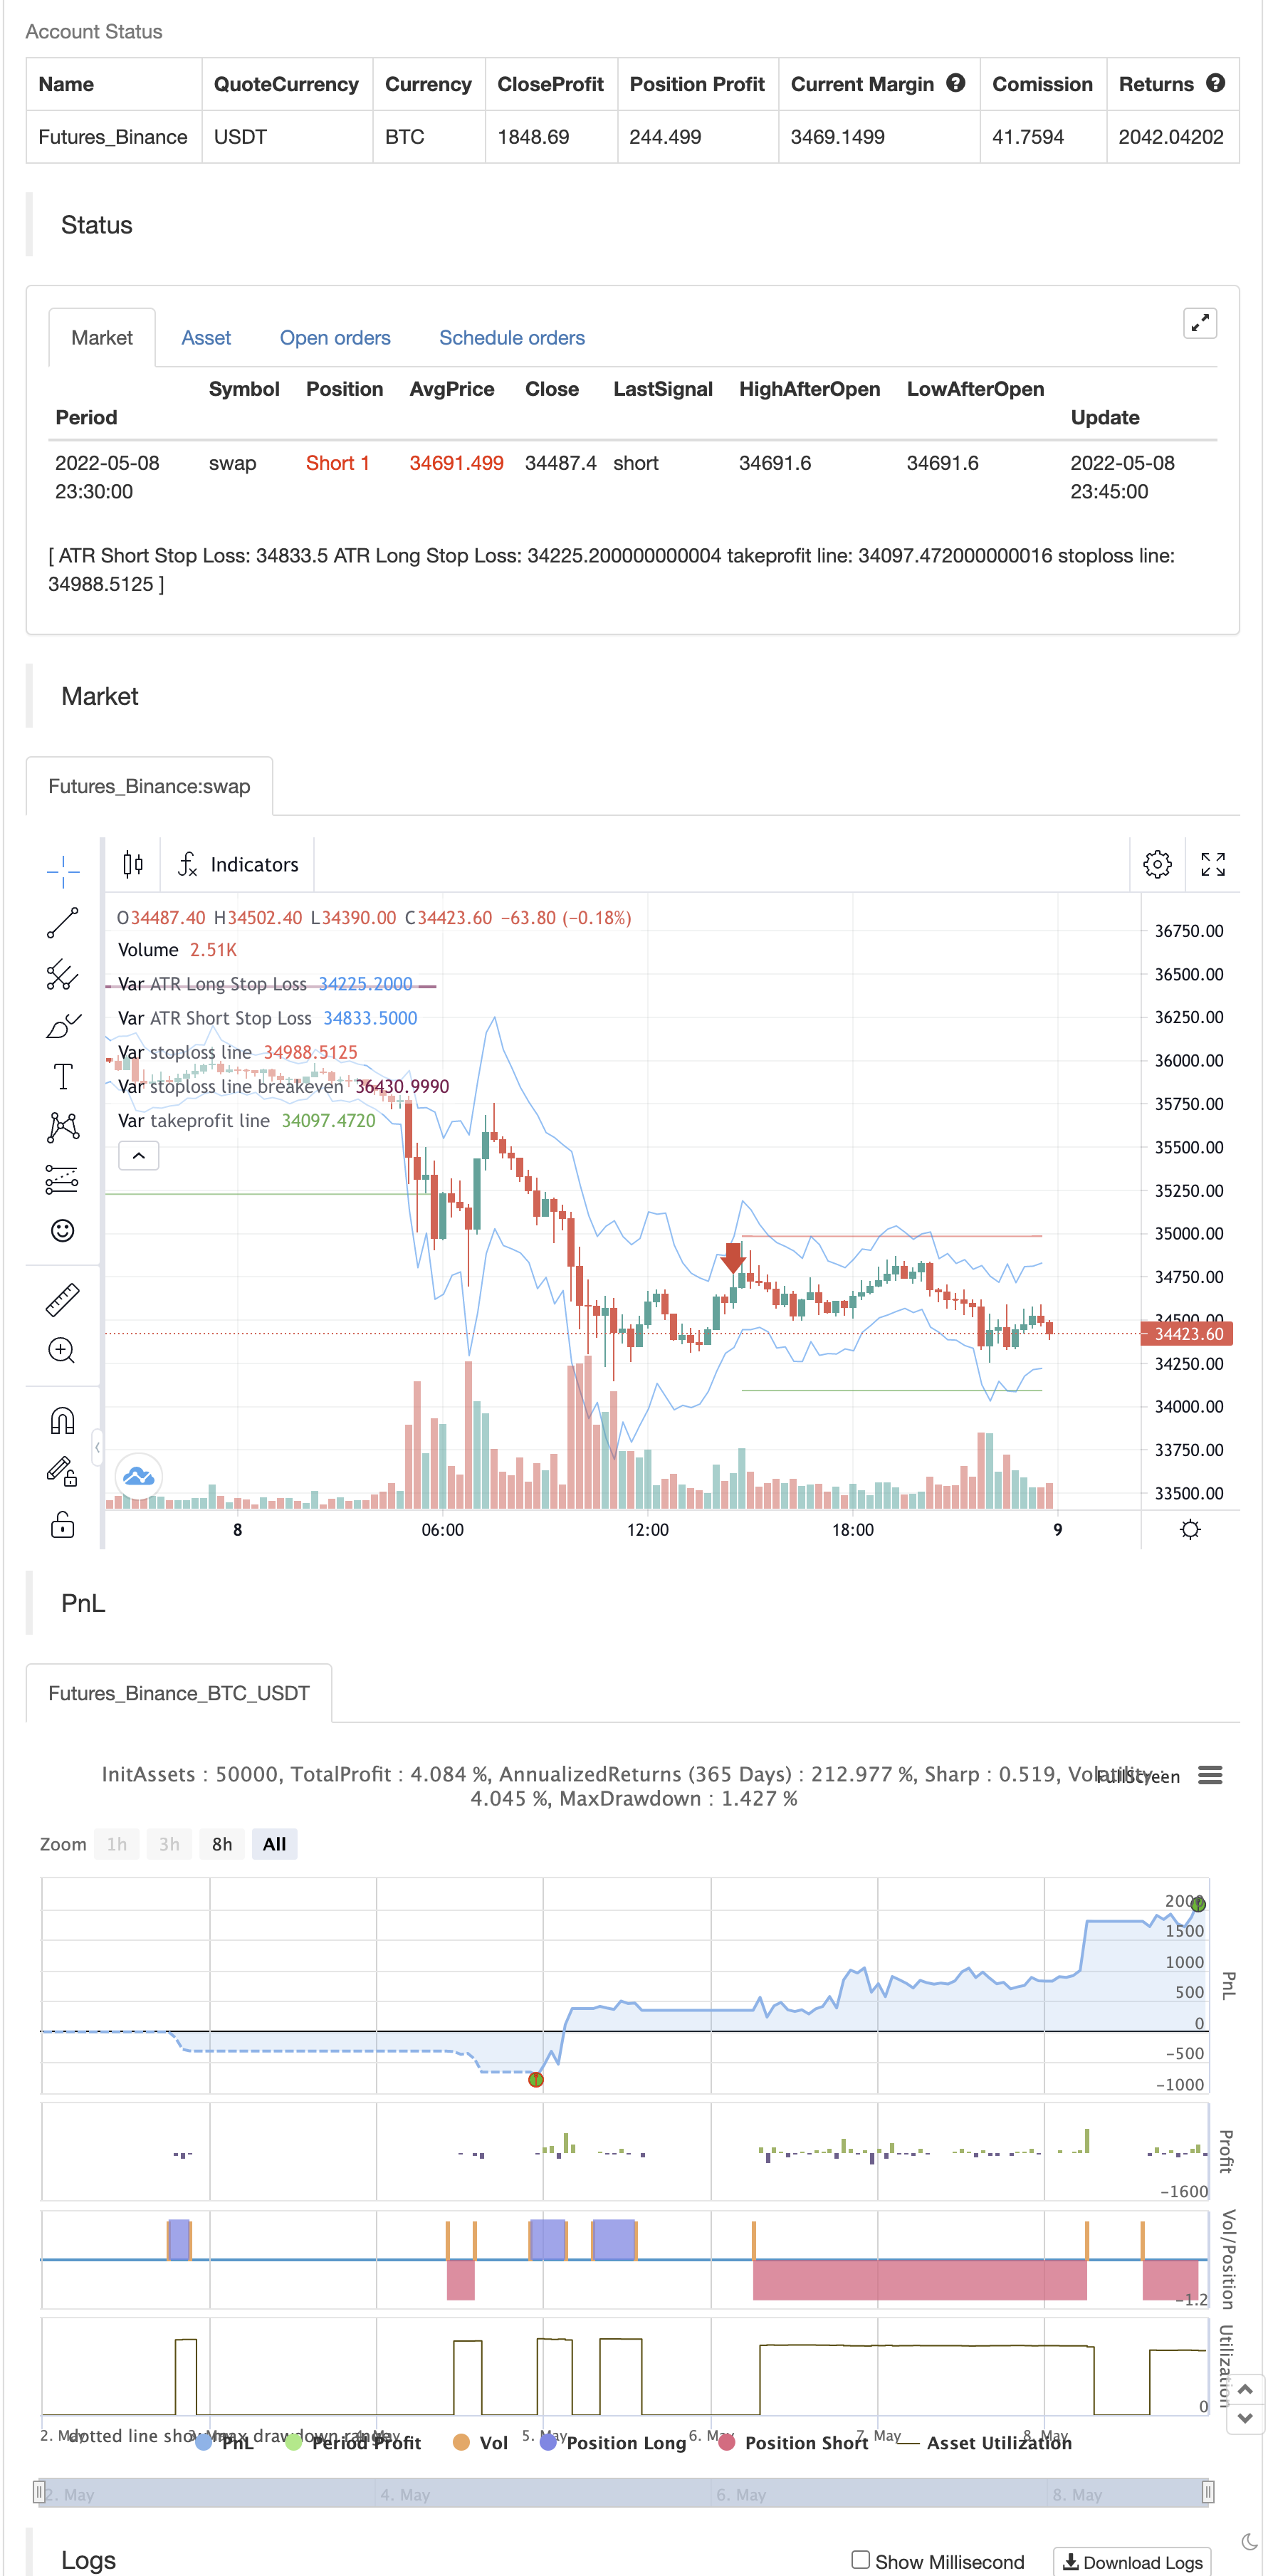
Chiến lược này kết hợp Supertrend, 200 EMA, Stochastic, và chỉ số dừng lỗ ATR. Đối với các điều kiện mua, Stochastic phải dưới mức 20, giá phải trên mức 200 Ema và Supertrend phải màu xanh lá cây. Đối với các điều kiện bán, nó phải ngược lại. Stochastic phải trên mức 80, giá phải dưới mức 200 Ema và Supertrend phải màu đỏ.
backtest

// This source code is subject to the terms of the Mozilla Public License 2.0 at https://mozilla.org/MPL/2.0/
// © araamas

//@version=5
strategy("stoch supertrd atr 200ma", overlay=true, shorttitle="STOCH SUPTR ATR MA", process_orders_on_close=true, max_bars_back=5000)

ema_condition = input.bool(defval=true, title="ema needed?", tooltip="You can choose whether to include the Ema in the buy and sell conditions")
atrPeriod = input(10, "ATR Length")
factor = input.float(3.0, "Factor", step = 0.01)

[supertrend, direction] = ta.supertrend(factor, atrPeriod)

// bodyMiddle = plot((open + close) / 2, display=display.none)
// upTrend = plot(direction < 0 ? supertrend : na, "Up Trend", color = color.green, style=plot.style_linebr)
// downTrend = plot(direction < 0? na : supertrend, "Down Trend", color = color.red, style=plot.style_linebr)

period = input.int(defval=200, title="ema period")
ema = ta.ema(close, period)
// plot(ema, title="200 ema", color=color.yellow)

b = input.int(defval=14, title="length k%")
d = input.int(defval=3, title="smoothing k%")
s = input.int(defval=3, title="smoothing d%")
smooth_k = ta.sma(ta.stoch(close, high, low, b), d)
smooth_d = ta.sma(smooth_k, s)

////////////////////////////////////////////////////////////////////////////////
length = input.int(title="Length", defval=12, minval=1)
smoothing = input.string(title="Smoothing", defval="SMA", options=["RMA", "SMA", "EMA", "WMA"])
m = input(1.5, "Multiplier")
src1 = input(high)
src2 = input(low)
pline = input(true, "Show Price Lines")
col1 = input(color.blue, "ATR Text Color")
col2 = input(color.teal, "Low Text Color",inline ="1")
col3 = input(color.red, "High Text Color",inline ="2")

collong = input(color.teal, "Low Line Color",inline ="1")
colshort = input(color.red, "High Line Color",inline ="2")

ma_function(source, length) =>
	if smoothing == "RMA"
		ta.rma(source, length)
	else
		if smoothing == "SMA"
			ta.sma(source, length)
		else
			if smoothing == "EMA"
				ta.ema(source, length)
			else
				ta.wma(source, length)

a = ma_function(ta.tr(true), length) * m
x = ma_function(ta.tr(true), length) * m + src1
x2 = src2 - ma_function(ta.tr(true), length) * m

p1 = plot(x, title = "ATR Short Stop Loss", color=color.blue)
p2 = plot(x2, title = "ATR Long Stop Loss", color= color.blue)


///////////////////////////////////////////////////////////////////////////////////////////////

shortCondition = high < ema and direction == 1 and smooth_k > 80 or (ema_condition == false and direction == 1 and smooth_k > 80)
if (shortCondition) and strategy.position_size == 0
    strategy.entry("sell", strategy.short)

longCondition = low > ema and direction == -1 and smooth_k < 20 or (ema_condition == false and direction == -1 and smooth_k < 20)
if (longCondition) and strategy.position_size == 0
    strategy.entry("buy", strategy.long)

x2_val = x2[bar_index - strategy.opentrades.entry_bar_index(0)]
g = (strategy.opentrades.entry_price(0) - x2_val) * 2 // tp for buy

x_val = x[bar_index - strategy.opentrades.entry_bar_index(0)]
k = (x_val - strategy.opentrades.entry_price(0)) * 2 //tp for sell

activate_breakeven_sl_price = strategy.opentrades.entry_price(0) + (strategy.opentrades.entry_price(0) - x2_val) //price to activate sl for buy
sl_breakeven_price_activated = ta.highest(high, strategy.position_size == 0 ? nz(strategy.opentrades.entry_bar_index(0), 1):bar_index - strategy.opentrades.entry_bar_index(0)) > activate_breakeven_sl_price ? true:false //checks if 1:1 ratio has been reached

activate_breakeven_sl_price1 = strategy.opentrades.entry_price(0) - (x_val - strategy.opentrades.entry_price(0)) //price to activate sl for buy
sl_breakeven_price_activated1 = ta.lowest(high, strategy.position_size == 0 ? nz(strategy.opentrades.entry_bar_index(0), 1):bar_index - strategy.opentrades.entry_bar_index(0)) < activate_breakeven_sl_price1 ? true:false //checks if 1:1 ratio has been reached

if strategy.position_size > 0
    strategy.exit(id="buy exit", from_entry="buy",limit=strategy.opentrades.entry_price(0) + g, stop=sl_breakeven_price_activated ? strategy.opentrades.entry_price(0):x2_val)

if strategy.position_size < 0
    strategy.exit(id="sell exit", from_entry="sell",limit=strategy.opentrades.entry_price(0) - k, stop=sl_breakeven_price_activated1 ? strategy.opentrades.entry_price(0):x_val)


plot(strategy.position_size > 0 ? strategy.opentrades.entry_price(0) + g:na, color=color.green, style=plot.style_linebr, title="takeprofit line") //to plot tp line for buy
plot(strategy.position_size > 0 and sl_breakeven_price_activated == false ? x2_val:na, color=color.red, style=plot.style_linebr, title="stoploss line") //to plot sl line for buy
plot(sl_breakeven_price_activated and strategy.position_size > 0 ? strategy.opentrades.entry_price(0):na, color=color.maroon, style=plot.style_linebr, linewidth=2, title="stoploss line breakeven") //to plot breakeven sl for buy

plot(strategy.position_size < 0 ? strategy.opentrades.entry_price(0) - k:na, color=color.green, style=plot.style_linebr, title="takeprofit line") //to plot tp line for sell
plot(strategy.position_size < 0 and sl_breakeven_price_activated1 == false ? x_val:na, color=color.red, style=plot.style_linebr, title="stoploss line") //to plot sl line for sell
plot(sl_breakeven_price_activated1 and strategy.position_size < 0 ? strategy.opentrades.entry_price(0):na, color=color.maroon, style=plot.style_linebr, linewidth=2, title="stoploss line breakeven") //to plot breakeven sl for sell
Nội dung liên quan
- Xác định xu hướng đa chiều và chiến lược dừng lỗ động của ATR
- Xu hướng đa chỉ số cao xác nhận chiến lược giao dịch
- Chiến lược theo dõi xu hướng thích nghi và xác nhận nhiều giao dịch
- Chiến lược tối ưu hóa giao dịch trong ngày với hệ thống đường thẳng động kết hợp với chỉ số động lực RSI
- Chiến lược theo dõi xu hướng động lực qua nhiều chỉ số công nghệ
- Xu hướng EMA kết hợp với việc quay lại vị trí đột phá chiến lược giao dịch
- Chiến lược giao dịch định lượng các thông số động của RSI hỗ trợ giao dịch đa đường
- Xu hướng động quyết định chiến lược giao thoa chỉ số RSI
- Chiến lược theo dõi xu hướng chéo kép: đường thẳng chỉ số và hệ thống giao dịch đồng bộ MACD
- Nhiều chỉ số, xu hướng đa chiều, chiến lược định lượng cao
- Chiến lược giao dịch định lượng theo dõi và xác nhận nhiều xu hướng chéo động đa trượt trung tuyến
Nhiều hơn nữa
- Chơi trò chơi.
- Fractals nhỏ hơn (+ minh bạch)
- Các điểm nhập BB-RSI-ADX
- Hull-4ema
- Chỉ số đường dẫn theo góc tấn công
- KijunSen Line với Cross
- AMACD - Tất cả các trung bình chuyển động
- MA HYBRID BY RAJ
- Xu hướng kim cương
- Nik Stoch
- MTF RSI & Chiến lược STOCH
- EMA + AROON + ASH
- Động lực 2.0
- Chiến lược phạm vi EHMA
- Trung bình chuyển động mua-bán
- Midas Mk. II - Ultimate Crypto Swing
- TMA-Legacy
- TV cao và thấp chiến lược
- Chiến lược TradingView tốt nhất
- R3.0 + Tình trạng biến động tăng cao + TP RSI