BRAHMASTRA
Tác giả:ChaoZhang, Ngày: 2022-05-13 14:39:00Tags:WMA
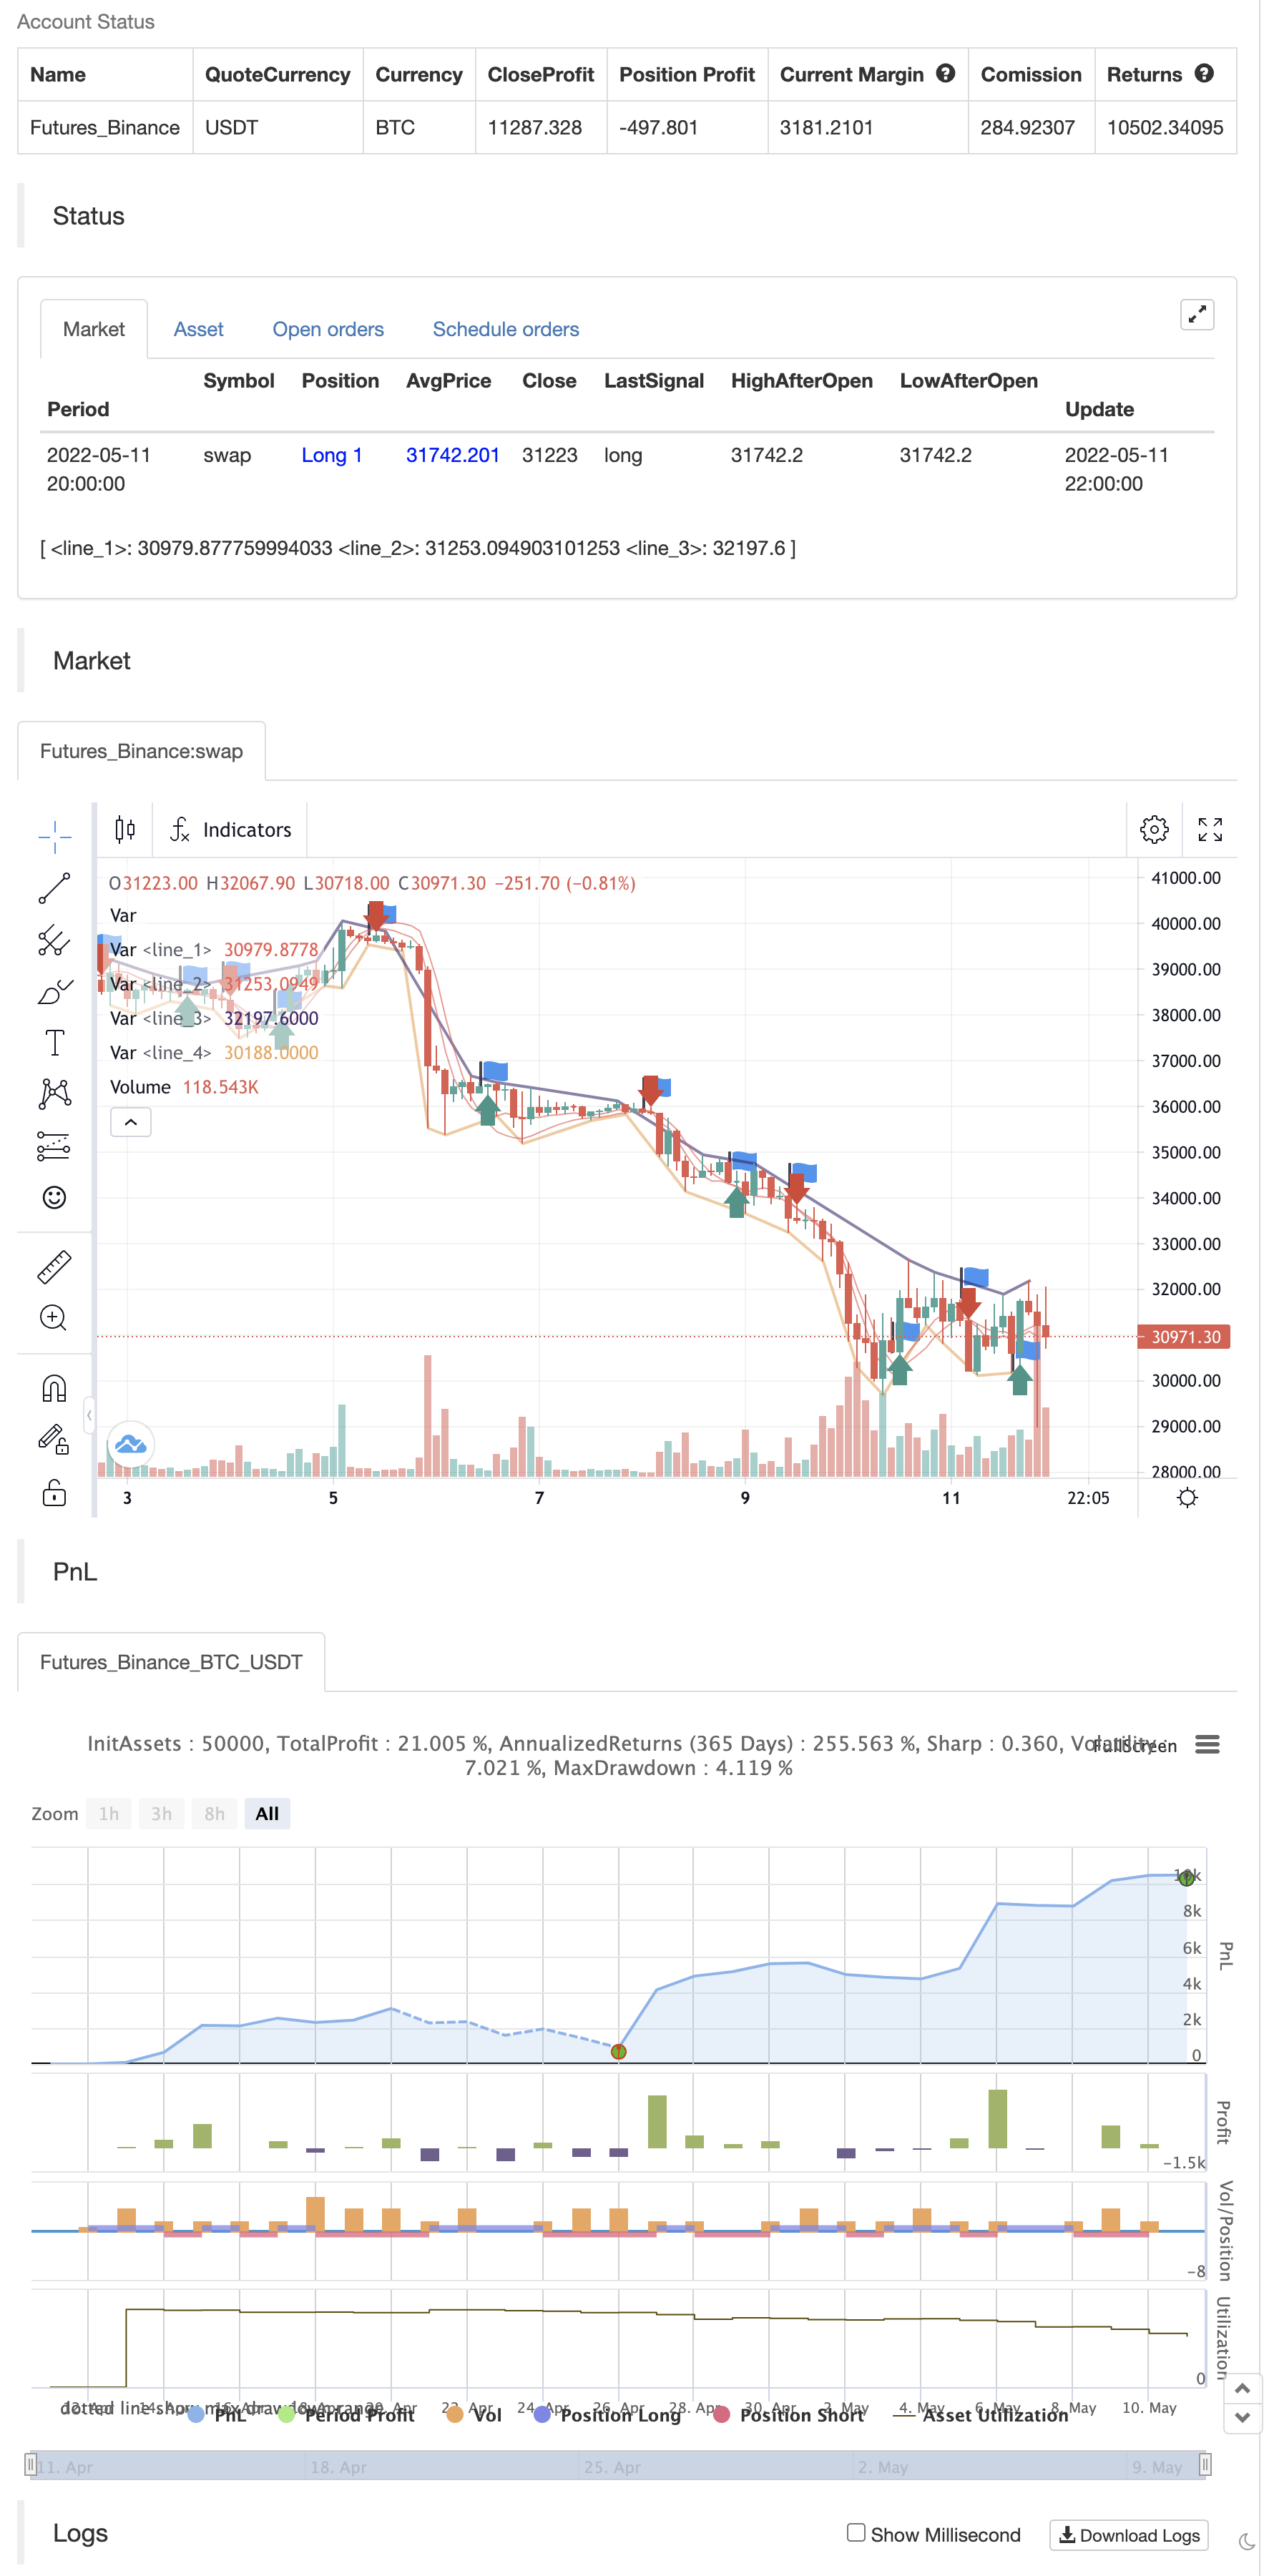
Tại bất kỳ thời điểm nào, bạn sẽ thấy tối đa 4 đường xu hướng trong kịch bản này.
▶ Đường xu hướng kết hợp với các mức cao trung tâm trong tình trạng xu hướng tăng ▶ Đường xu hướng kết hợp với các mức thấp trung tâm trong tình trạng xu hướng tăng ▶ Đường xu hướng kết hợp với các mức cao trung tâm trong tình trạng xu hướng giảm ▶ Đường xu hướng kết hợp với các mức thấp trong điều kiện xu hướng giảm
Dòng cũ sẽ vẫn còn cho đến khi dòng mới xuất hiện của cùng một loại. do đó, bạn sẽ vẫn có thể thấy đường xu hướng tăng xu hướng cao và thấp cho các công cụ giảm xu hướng được tạo từ lâu!! Ngoài ra, các đường xu hướng mới chỉ thay thế các đường xu hướng cũ nếu chúng mạnh hơn (gây kết nối với nhiều trục hơn với ít tràn hơn)
backtest

/*backtest
start: 2022-04-12 00:00:00
end: 2022-05-11 23:59:00
period: 2h
basePeriod: 15m
exchanges: [{"eid":"Futures_Binance","currency":"BTC_USDT"}]
*/

//@version=4
study("BRAHMASTRA", precision=2, overlay=true)
// compilation: capissimo

// This script utilizes two modules, Trendlines Module (by Joris Duyck) and HMA-Kahlman Trend Module.
// Trendlines module produces crossovers predictive of the next local trend.

//*** HMA-Kahlman Trend Module
price  = input(hl2,  "Price Data (hl2)")
hkmod  = input(true, "===HMA-Kahlman Trend Module===")
length = input(22,   "Lookback Window", minval=2)
k      = input(true, "Use Kahlman")
gain   = input(.7,   "Gain", minval=.0001, step=.01)
labels = input(true, "Show Labels?")
o      = input(true, "Use Offset")

hma(x, p) => wma((2 * wma(x, p / 2)) - wma(x, p), round(sqrt(p)))

hma3() => p = length/2, wma(wma(close, p/3)*3 - wma(close, p/2) - wma(close, p), p)

kahlman(x, g) =>
    kf = 0.0
    dk = x - nz(kf[1], x)
    smooth = nz(kf[1],x)+dk*sqrt(g*2)
    velo = 0.0
    velo := nz(velo[1],0) + (g*dk)
    kf := smooth+velo

a = k ? kahlman(hma(price, length), gain) : hma(price, length)
b = k ? kahlman(hma3(), gain) : hma3()
c = b > a ? color.lime : color.red
crossdn = a > b and a[1] < b[1]
crossup = b > a and b[1] < a[1]
ofs = o ? -1 : 0

fill(plot(a,color=c,linewidth=1,transp=75), plot(b,color=c,linewidth=1,transp=75), color=c, transp=55)
plotshape(labels and crossdn ? a : na, location=location.abovebar, style=shape.labeldown, color=color.red, size=size.tiny, text="S", textcolor=color.white, transp=0, offset=ofs)
plotshape(labels and crossup ? a : na, location=location.belowbar, style=shape.labelup, color=color.green, size=size.tiny, text="B", textcolor=color.white, transp=0, offset=ofs)

//*** Trendlines Module, see https://www.tradingview.com/script/mpeEgn5J-Trendlines-JD/
tlmod = input(true, "===Trendlines Module===")
l1    = input(2,    "Pivots Lookback Window", minval=1)

trendline(input_function, delay, only_up) => // Calculate line coordinates (Ax,Ay) - (Bx,By)
    var int Ax = 0, var int Bx = 0, var float By = 0.0, var float slope = 0.0
    Ay = fixnan(input_function)
    if change(Ay)!=0
        Ax := time[delay], By:= Ay[1], Bx := Ax[1]
        slope := ((Ay-By)/(Ax-Bx))
    else
        Ax := Ax[1], Bx := Bx[1], By := By[1]

    var line trendline=na, var int Axbis=0, var float Aybis=0.0, var bool xtend=true
    extension_time = 0
    Axbis := Ax + extension_time
    Aybis := (Ay + extension_time*slope)
    if tlmod and change(Ay)!=0
        line_color = slope*time<0?(only_up?na:color.red):(only_up?color.lime:na)
        if not na(line_color)
            trendline = line.new(Bx,By,Axbis, Aybis, xloc.bar_time, extend=xtend?extend.right:extend.none, color=line_color, style=line.style_dotted, width=1)
            line.delete(trendline[1])
    slope

pivot(len) =>
    high_point = pivothigh(high, len,len/2)
    low_point  = pivotlow(low, len,len/2)
    slope_high = trendline(high_point, len/2,false)
    slope_low  = trendline(low_point, len/2,true)
    [high_point, low_point, slope_high, slope_low]

[high_point1, low_point1, slope_high1, slope_low1] = pivot(l1)

color_high1 = slope_high1 * time<0 ? color.red : na
color_low1  = slope_low1  * time>0 ? color.lime : na
plot(tlmod ? high_point1 : na, color=color_high1, offset=-l1/2, linewidth=2)
plot(tlmod ? low_point1  : na, color=color_low1, offset=-l1/2, linewidth=2)


if crossup
    strategy.entry("Enter Long", strategy.long)
else if crossdn
    strategy.entry("Enter Short", strategy.short)
- Chiến lược theo dõi xu hướng động lực qua nhiều chỉ số công nghệ
- Chiến lược giao dịch định lượng các thông số động của RSI hỗ trợ giao dịch đa đường
- Xu hướng động quyết định chiến lược giao thoa chỉ số RSI
- Chiến lược giao dịch định lượng theo dõi và xác nhận nhiều xu hướng chéo động đa trượt trung tuyến
- Xu hướng đồng bộ đa chỉ số đảo ngược chiến lược giao dịch định lượng
- Động thái hỗ trợ nhiều kênh chống lại chiến lược kênh của Kenny
- Chiến lược chụp xu hướng định lượng dựa trên chiều dài sợi xích
- Brin Band đột phá chiến lược theo dõi giao dịch
- Chiến lược định lượng qua đường trung bình chuyển động động kết hợp nhiều chỉ số
- Chiến lược tối ưu hóa giao dịch năng động với nhiều chỉ số
- Chiến lược theo dõi giao dịch theo xu hướng thích nghi dựa trên Bollinger Bands
- Phantom Trends theo dõi cơ sở dữ liệu chiến lược
- Phantom Trends theo dõi các cơ sở kinh doanh chiến lược
- Chiến lược theo dõi xu hướng ma
- Rainbow Oscillator
- Thương mại đường cong vốn chủ sở hữu ví dụ về kích thước vị trí
- KLineChart trình bày
- Chiến lược siêu xu hướng Villa Dynamic Pivot
- Crodl's Supertrend
- RSI của zdmre
- FTL - Range Filter X2 + EMA + UO
- Nhóm nhạc Mobo
- SAR + 3SMMA với SL & TP
- SSS
- Mô hình cảnh báo phóng mặt trăng [Dấu hiệu]
- HALFTREND + HEMA + SMA (Chiến lược tín hiệu sai)
- RSI Divergence với Pivot, BB, SMA, EMA, SMMA, WMA, VWMA
- RSI và BB và đồng thời OverSold
- Quay nến Heikin Ashi
- Combo 2/20 EMA & Bandpass Filter
- ESSMA