HODL LINE
Tác giả:ChaoZhang, Ngày: 2022-05-20 16:58:28Tags:HMA
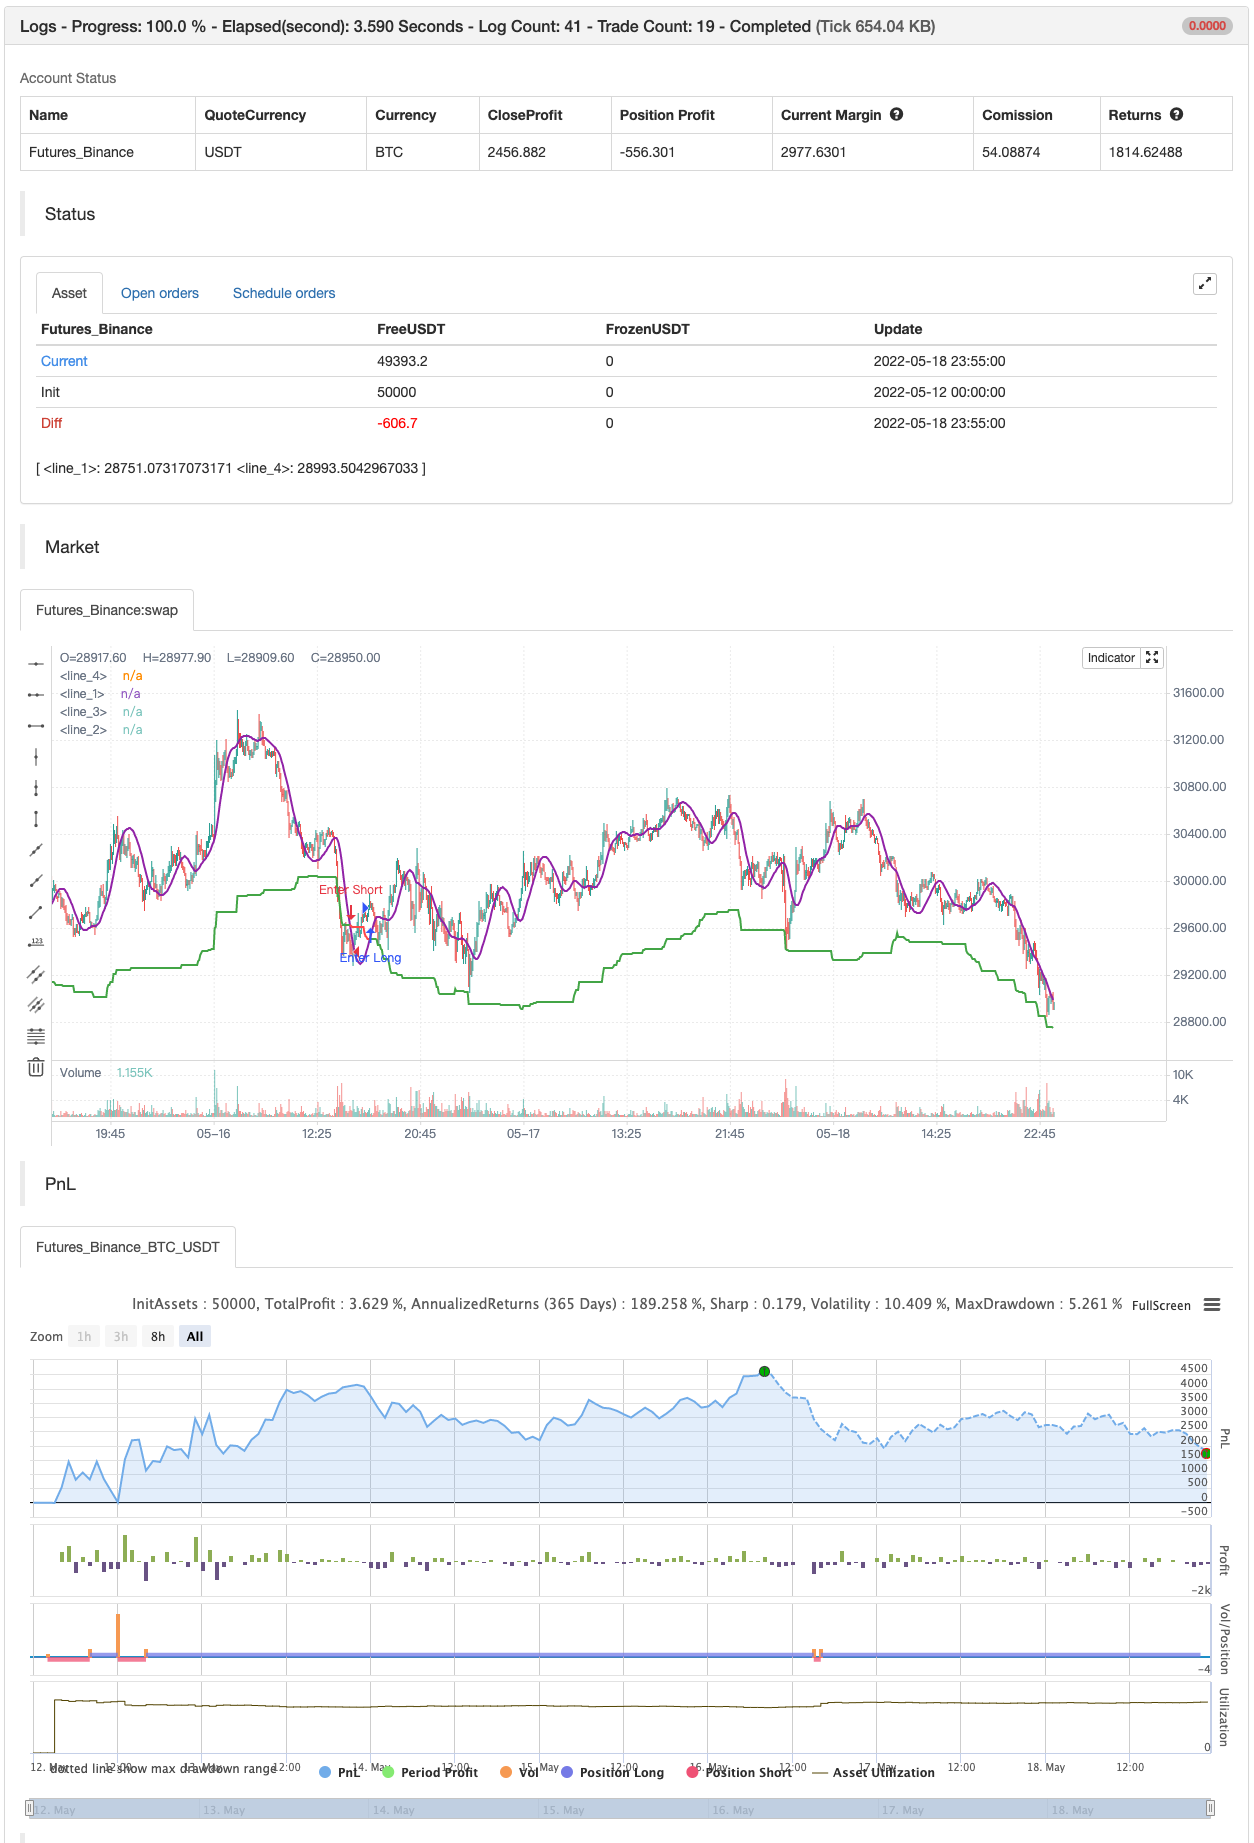
Chỉ số này xác định các giai đoạn thị trường tăng khi một nhà đầu tư mua và giữ có thể nắm giữ tài sản, và các giai đoạn thị trường gấu khi họ nên tránh nắm giữ nó. Về mặt kỹ thuật, chỉ số là một bộ lọc xu hướng không đối xứng nhằm mục đích tính đến thực tế là việc bán tháo thị trường có xu hướng sắc nét hơn xu hướng tăng.
Cách sử dụng Dòng hình bước là bộ lọc xu hướng chính. Nó có màu xanh lá cây trong xu hướng tăng và màu đỏ trong xu hướng giảm. Khi làm mịn, ngoài bộ lọc xu hướng, chỉ số vẽ một đường màu tím. Đây là Trung bình Di chuyển Hull (HMA) của giá. Trong trường hợp này, chỉ số sử dụng đường này thay vì giá để tìm các đường chéo với bộ lọc xu hướng. Khi giá hoặc đường thẳng vượt qua bộ lọc xu hướng ở trên, đó là một tín hiệu xu hướng tăng. Chỉ số đánh dấu các giao điểm như vậy bằng các vòng tròn màu xanh lá cây. Nó cũng màu xanh lá cây nền biểu đồ trong xu hướng tăng. Giá hoặc đường tím vượt qua bộ lọc xu hướng bên dưới có nghĩa là một tín hiệu xu hướng giảm. Các tín hiệu xu hướng giảm hiển thị dưới dạng các vòng tròn màu đỏ.
Cài đặt
Độ nhạy
backtest

/*backtest
start: 2022-05-12 00:00:00
end: 2022-05-18 23:59:00
period: 5m
basePeriod: 1m
exchanges: [{"eid":"Futures_Binance","currency":"BTC_USDT"}]
*/

// This source code is subject to the terms of the Mozilla Public License 2.0 at https://mozilla.org/MPL/2.0/
// © AstrideUnicorn

// Asymmetrical Trend Filter aka HODL Line

//@version=5
indicator("HODL LINE", overlay=true)

// initialize indicator period parameter and the asymmetry paramter
length = 300
asymmetry =  0.05 //input.float(defval=0.05,step=0.01, minval=0.01, maxval=0.3)

// script inputs
sensitivity = input.string(defval="Hold Short Term", title="Sensitivity", options=['Super Sensitive','Hold Short Term', 'Hold Medium Term', 'Hold Long Term'])
use_smoothing = input.bool(defval=true, title="Use Smoothing")


// Set the indicator period based on the choosen sensitivity
if sensitivity == 'Super Sensitive'
    length:=50

if sensitivity == 'Hold Short Term'
    length:=100

if sensitivity == 'Hold Medium Term'
    length:=300

if sensitivity == 'Hold Long Term'
    length:=500

// Calculate HODL Line - an assymetric trend filter
HODL_line = (ta.highest(close,length) + ta.lowest(close,length))/(2.0 + asymmetry)

// Calculate smoothed price time series
smoothed_price = ta.hma(close,50)

// Use closing price or smoothed price based on the choosen option for smoothing
price_model = use_smoothing ? smoothed_price : close

// Define conditional color for the HODL Line
hodl_line_color = price_model >= HODL_line ? color.green : color.red

// define the HODL Line crossing conditions
crossing_condition_bull = ta.crossover(price_model, HODL_line)
crossing_condition_bear = ta.crossunder(price_model, HODL_line)

// plotting
plot(HODL_line, color = hodl_line_color, linewidth = 2)

plot(crossing_condition_bull?HODL_line:na, color = color.new(color.green,40), style= plot.style_circles, linewidth = 20)
plot(crossing_condition_bear?HODL_line:na, color = color.new(color.red,40), style= plot.style_circles, linewidth = 20)

bgcolor(color.new(hodl_line_color,80))

plot(use_smoothing?price_model:na, color=color.purple, linewidth=2)

if crossing_condition_bull
    strategy.entry("Enter Long", strategy.long)
else if crossing_condition_bear
    strategy.entry("Enter Short", strategy.short)
- Chiến lược định lượng qua đường trung bình chuyển động động kết hợp nhiều chỉ số
- Chiến lược Bollinger Breakthrough với nhiều thời gian kết hợp với chiến lược Hull
- Chiến lược định lượng đường trung chuyển của Hull kết hợp với đường trung bình kép
- Chiến lược xác định xu hướng EMA phản xạ dựa trên đường trung bình chuyển động Hull
- Phương pháp giao thoa đường cong đa chu kỳ linh hoạt phiên bản nâng cao
- Chiến lược giao dịch đường ngang giá tự điều chỉnh
- Chiến lược theo dõi xu hướng dừng giảm động với nhiều chỉ số
- HMA tối ưu hóa chiến lược giao dịch định lượng đa chu kỳ kết hợp với dừng lỗ động
- Chiến lược nắm bắt xu hướng xu hướng và xu hướng thị trường
- Chiến lược vượt qua đường trung bình di động Hull đa chu kỳ
- Chiến lược kết hợp RSI và MA
- Shannon Entropy V2
- SUPERTREND ATR WITH TRAILING STOP LOSS
- Dòng lưu lượng v3
- tương lai tiền điện tử scalping hàng giờ với ma & rsi - ogcheckers
- ATR được làm mịn
- Order Block Finder
- TrendScalp-FractalBox-3EMA
- Các tín hiệu QQE
- Lưu ý:
- CM MACD Chỉ số tùy chỉnh - Khung thời gian đa - V2
- 2 Phát hiện hướng màu trung bình chuyển động
- Scalping PullBack Tool R1
- Chiến lược mua&bán phụ thuộc vào AO+Stoch+RSI+ATR
- EMA TREND CLOUD
- Tỷ lệ năng lượng hướng tăng tốc theo khối lượng RedK
- Donchian Breakout không sơn lại
- RedK Momentum Bars
- SuperJump quay lại Bollinger Band
- Xu hướng Fukuiz
- Bốt của Johnny.