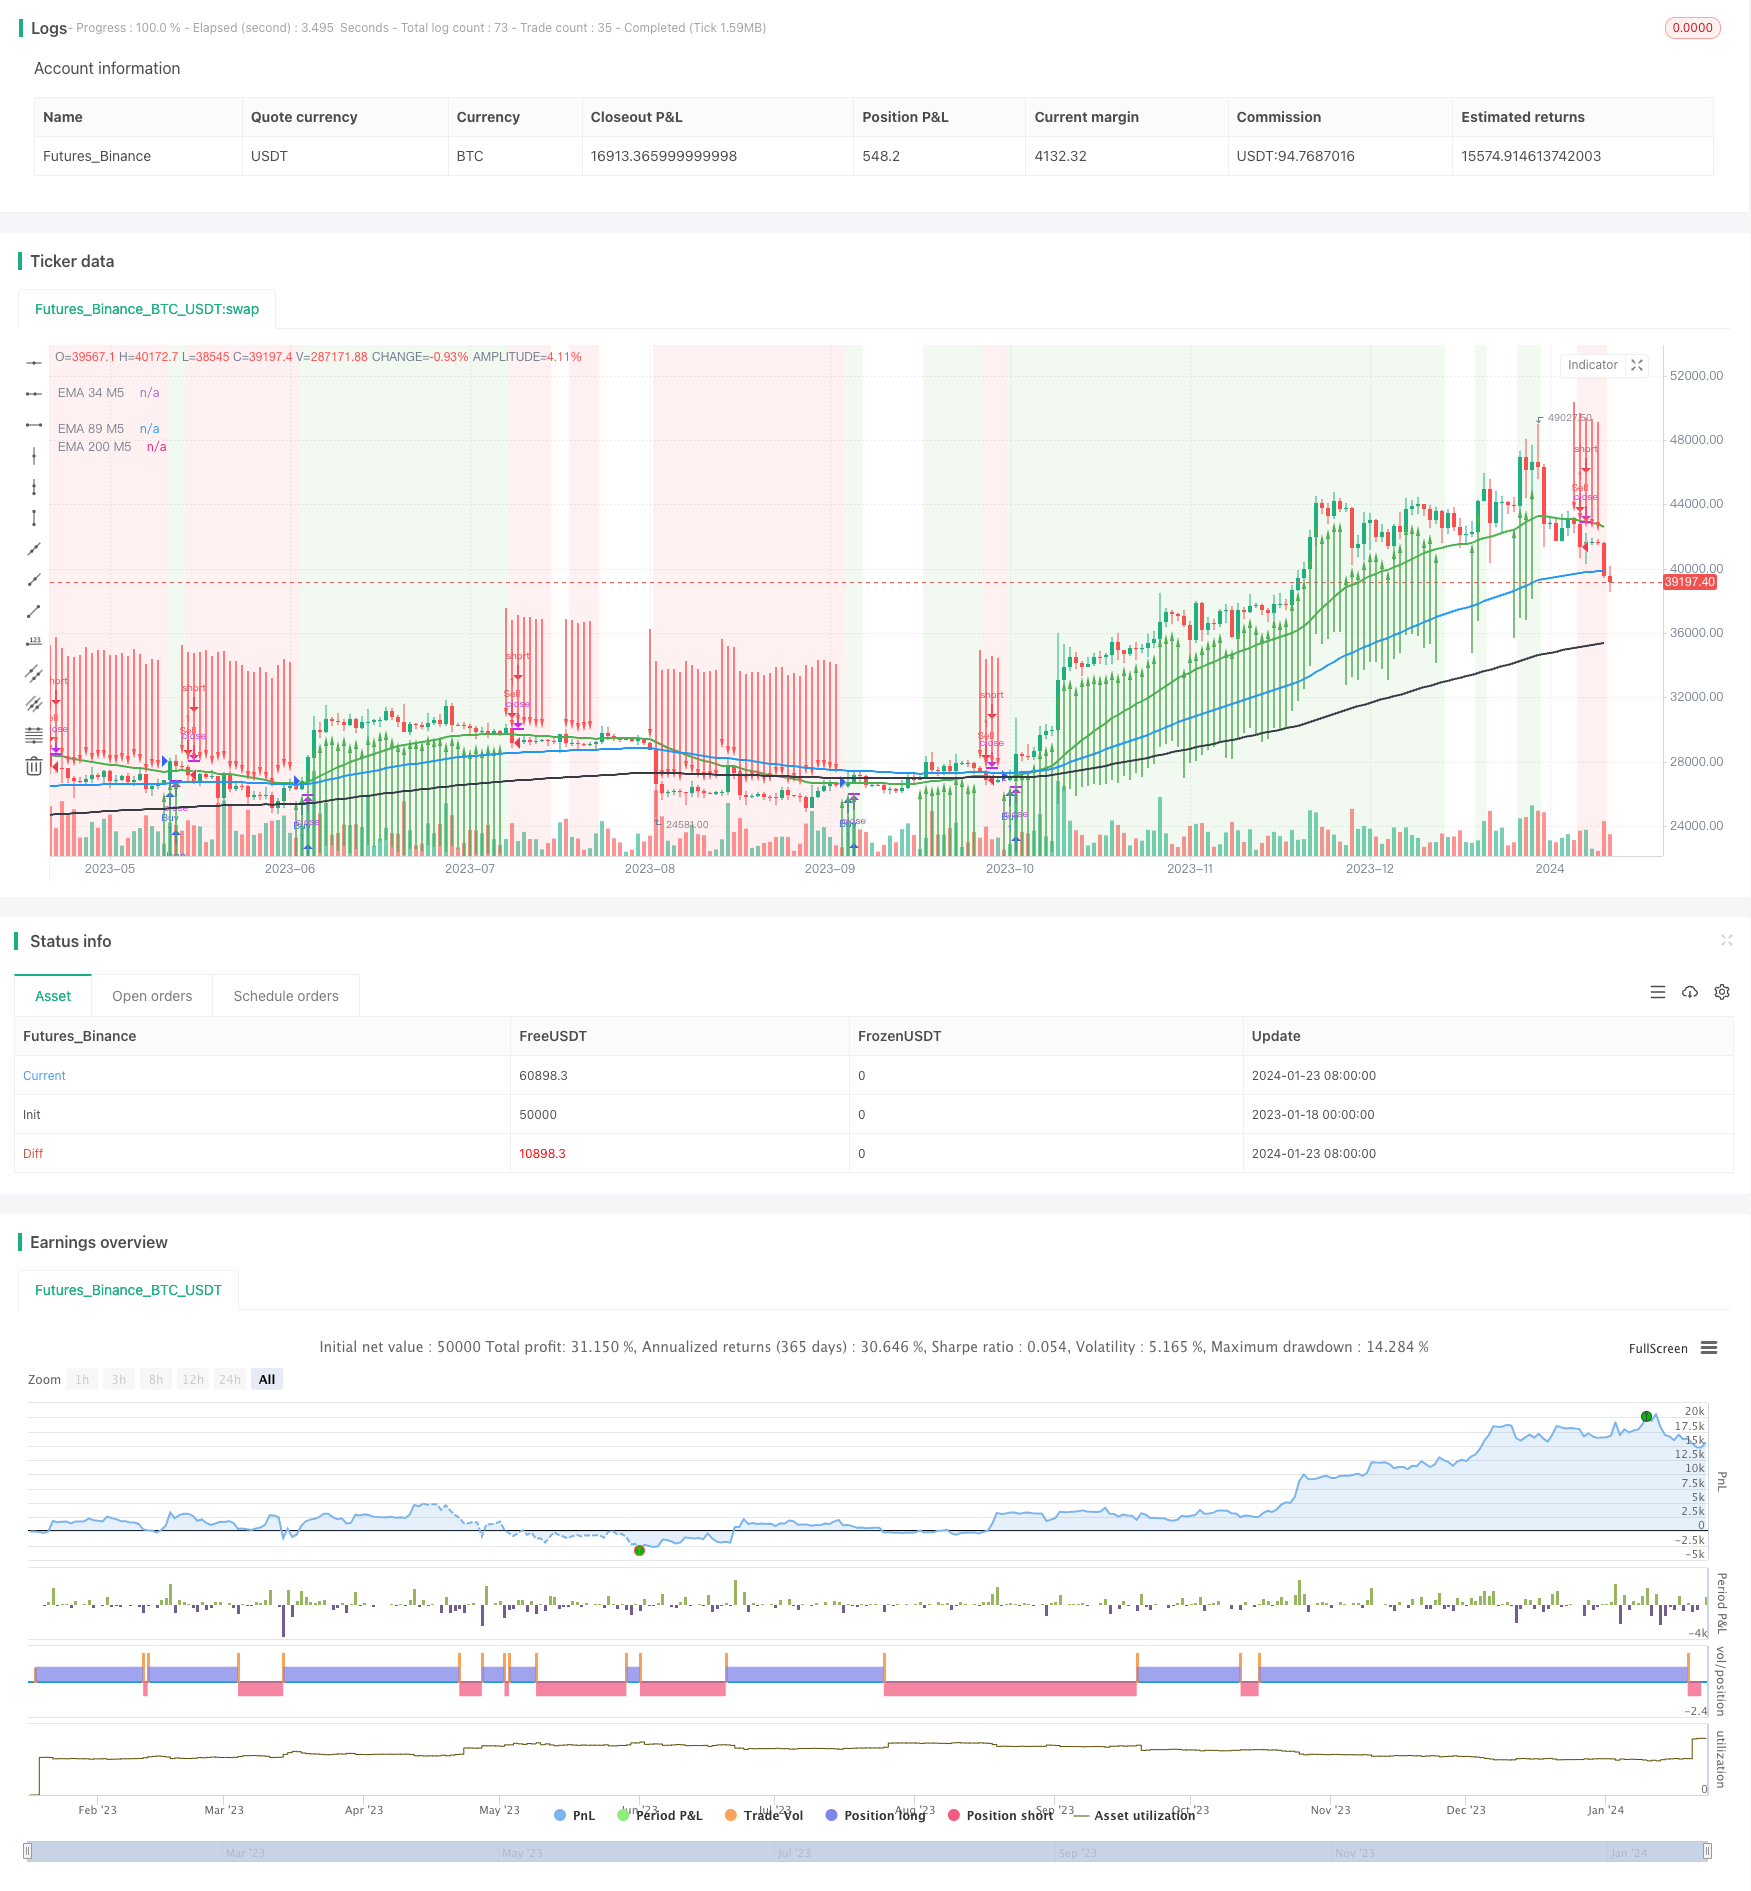
Chiến lược theo xu hướng với ba EMA kết hợp với DMI và MACD

Tổng quan
Đây là một chiến lược theo dõi xu hướng kết hợp sử dụng 3 chỉ số trung bình di chuyển (EMA), chỉ số xu hướng (DMI) và chỉ số tập trung trung trung bình di chuyển (MACD) để xác định hướng xu hướng và tạo ra tín hiệu mua và bán. Các thành phần quan trọng bao gồm tín hiệu giao chéo vàng của EMA, DMI đánh giá cường độ xu hướng và MACD xác nhận động lực.
Chiến lược Logic
Logic cốt lõi phụ thuộc vào 3 EMA - 34, 89 và 200 - được tính trên chu kỳ M5 để xác định xu hướng tổng thể. 34 chu kỳ EMA cung cấp hướng gần đây, trong khi 89 và 200 EMA xác định xu hướng trung và dài hạn.
Khi mua tín hiệu kích hoạt:
- Mức giao dịch: 34 EMA
- + DI ((những động thái xu hướng) > 17
- ADX ((cường độ xu hướng) > -DI
Bán đi khi có tín hiệu:
- Đường EMA 34 dưới mức đóng cửa
- -DI ((chuyển động xu hướng giảm) > 17
- ADX > +DI
Các chỉ số MACD cũng cung cấp xác nhận bổ sung trước khi nhập học.
Ưu điểm
Chiến lược này có một số lợi thế quan trọng:
- Chuyển đổi xu hướng bắt đầu bằng giao dịch vàng EMA ngắn hạn
- Sử dụng nhiều EMA để đánh giá cường độ của xu hướng trong các khung thời gian khác nhau
- Bộ lọc DMI giúp tránh tín hiệu sai bằng cách kiểm tra chuyển động xu hướng mạnh mẽ
- MACD cung cấp động lực xác nhận, nâng cao chất lượng và xác suất của cơ hội giao dịch
- Sự kết hợp của các chỉ số cải thiện độ chính xác và thời gian của tín hiệu nhập cảnh
Rủi ro
Những rủi ro quan trọng:
- Chỉ dựa vào EMA Gold Cross dễ bị lừa và sai vị trí
- Nhiều xác nhận có thể gây ra sự chậm trễ tại thời điểm tạo tín hiệu
- Dễ bị ảnh hưởng bởi sự đảo ngược xu hướng đột ngột
Phương pháp giảm thiểu:
- Sử dụng quản lý lỗ hổng và vị trí thích hợp
- Tối ưu hóa tham số EMA theo điều kiện thị trường hiện tại
- Quan sát động thái giá thực thể để xác nhận hình ảnh
Hướng tối ưu hóa
Những cải tiến tiếp theo trong chiến lược:
- Tăng các chỉ số như RSI để đánh giá khu vực quá mua quá bán
- Kết hợp phân tích khối lượng giao thông tạo ra tín hiệu mạnh hơn
- Tối ưu hóa chỉ số và tham số theo các tài sản và khung thời gian khác nhau
- Tiếp tục học hỏi từ dữ liệu thị trường mới bằng công nghệ học máy
Tóm tắt
Nhìn chung, đây là một hệ thống theo dõi xu hướng mạnh mẽ, kết hợp sử dụng một loạt các chỉ số đơn giản nhưng thực tế để xác định xu hướng theo nhiều khung thời gian, DMI và MACD kiểm tra để nâng cao thời gian nhập cảnh và xác suất lợi nhuận. Cùng với việc tối ưu hóa và quản lý rủi ro thích hợp, nó có thể trở thành một công cụ hiệu quả cho các nhà giao dịch xu hướng.
/*backtest
start: 2023-01-18 00:00:00
end: 2024-01-24 00:00:00
period: 1d
basePeriod: 1h
exchanges: [{"eid":"Futures_Binance","currency":"BTC_USDT"}]
*/

//@version=5
strategy("2 EMA di+ Buy Sell, strategy ", overlay=true)

// Define the EMA calculation function
ema(src, length) =>
    ta.ema(src, length)

// Calculate and plot EMA on M5
ema34_M5 = ema(close, 34)
ema89_M5 = ema(close, 89)
ema200_M5 = ema(close, 200)

// Plot EMAs
plot(ema34_M5, color=color.green, title="EMA 34 M5", linewidth=2)
plot(ema89_M5, color=color.blue, title="EMA 89 M5", linewidth=2)
plot(ema200_M5, color=color.black, title="EMA 200 M5", linewidth=2)

// Define DMI parameters
len = input(14, title="DI Length")
up = ta.change(high)
down = -ta.change(low)
plusDM = na(up) ? na : (up > down and up > 0 ? up : 0)
minusDM = na(down) ? na : (down > up and down > 0 ? down : 0)
trur = ta.rma(ta.tr, len)
plusDI = 100 * ta.rma(plusDM, len) / trur
minusDI = 100 * ta.rma(minusDM, len) / trur

// Calculate ADX
adxValue = 100 * ta.rma(math.abs(plusDI - minusDI) / (plusDI + minusDI == 0 ? 1 : plusDI + minusDI), len)

// Define MACD parameters
fastLength = input(12, title="Fast Length")
slowLength = input(26, title="Slow Length")
signalLength = input(9, title="Signal Length")

// Calculate MACD
[macdLine, signalLine, _] = ta.macd(close, fastLength, slowLength, signalLength)

// Create buy/sell conditions
buyCondition = close > ema34_M5 and plusDI > 17 and adxValue > minusDI
sellCondition = close < ema34_M5 and minusDI > 17 and adxValue > plusDI

// Strategy logic
strategy.entry("Buy", strategy.long, when = buyCondition)
strategy.entry("Sell", strategy.short, when = sellCondition)

// Create alerts for buy/sell signals
alertcondition(buyCondition, title="Buy Signal", message="Buy Signal")
alertcondition(sellCondition, title="Sell Signal", message="Sell Signal")

// Plot buy/sell arrows on the price chart
bgcolor(buyCondition ? color.new(color.green, 90) : sellCondition ? color.new(color.red, 90) : na)

plotarrow(buyCondition ? 1 : sellCondition ? -1 : na, colorup=color.new(color.green, 0), colordown=color.new(color.red, 0), offset=-1)