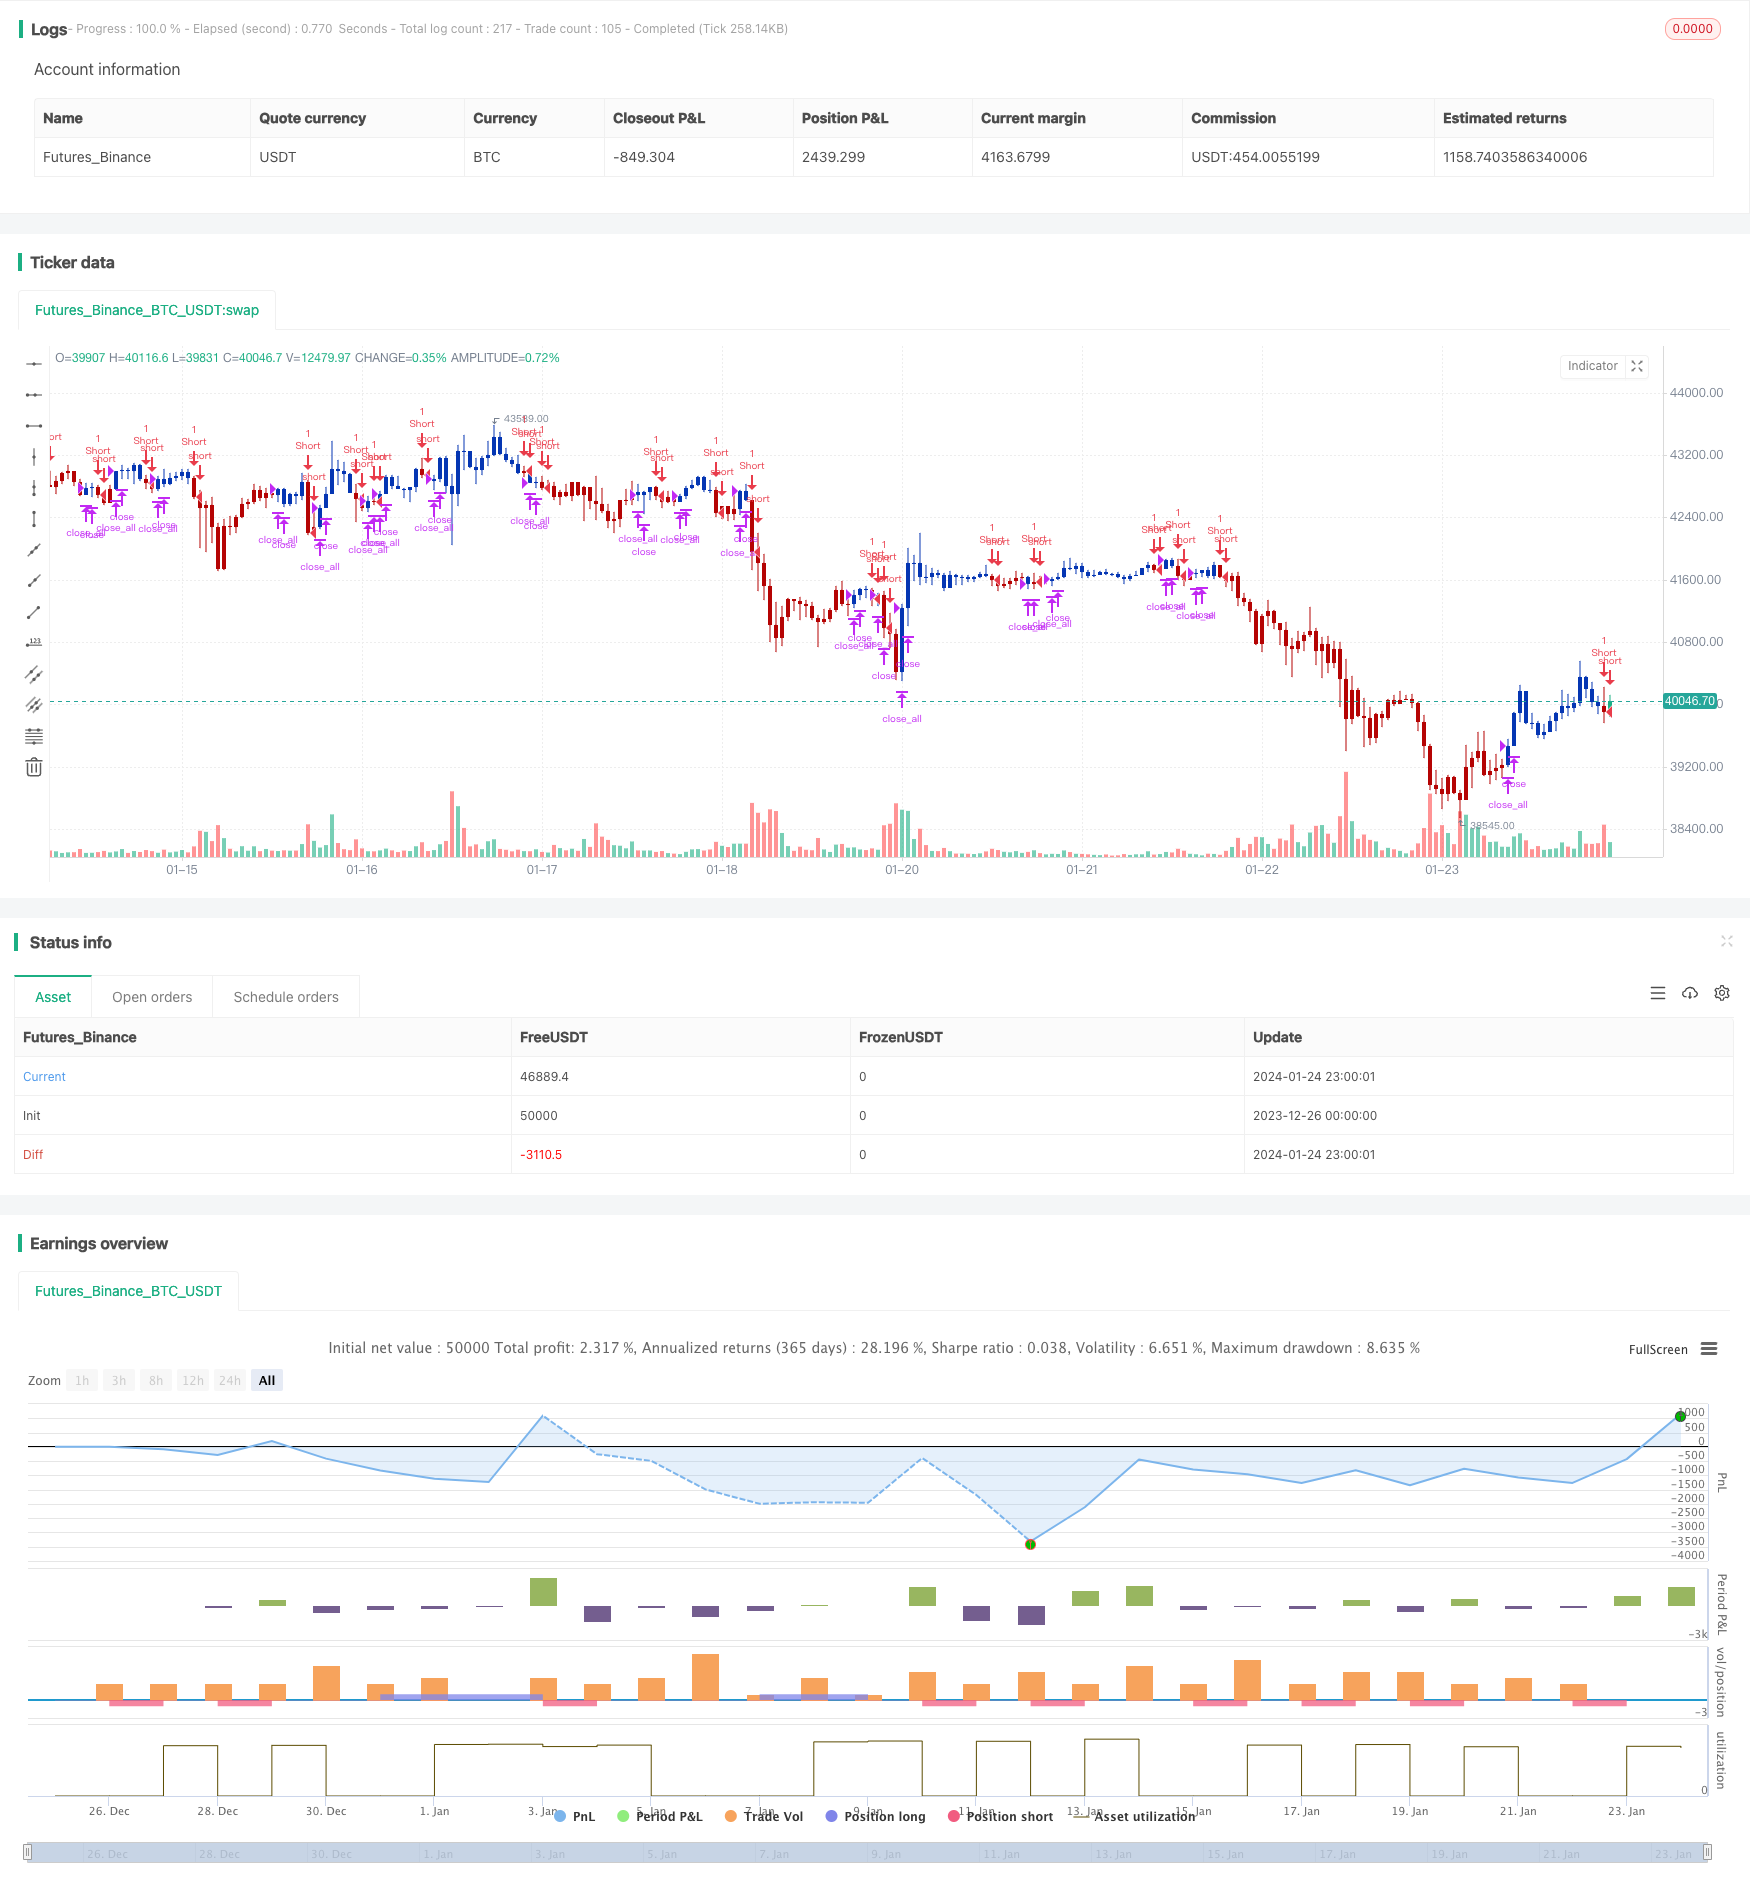
Nhiều chỉ số làm theo chiến lược
Tác giả:ChaoZhangTags:

Tổng quan
Chiến lược logic
Chiến lược bao gồm hai phần:
- 123 Chỉ số đảo ngược
Chỉ số này đánh giá sức mạnh của bò và gấu bằng cách tính toán trung bình di chuyển đơn giản của sự khác biệt giữa giá mở và giá đóng. Nó tạo ra tín hiệu giao dịch khi vượt qua đường không.
Chiến lược Multiple Indicators Follow sau đó xem xét toàn diện các tín hiệu giao dịch từ cả chỉ số 123 Reversal và chỉ số Qstick. Nó sẽ chỉ thực hiện các hành động giao dịch có liên quan khi các tín hiệu từ cả hai chỉ số đều phù hợp.
Phân tích lợi thế
Rủi ro và giải pháp
Điều này có thể được giải quyết bằng cách tối ưu hóa tham số, điều chỉnh các tham số của hai chỉ số để phối hợp tần số và nhịp của việc tạo tín hiệu của chúng.
Hướng dẫn tối ưu hóa
-
Thêm chiến lược dừng lỗ
Kết luận
/*backtest
start: 2023-12-26 00:00:00
end: 2024-01-25 00:00:00
period: 1h
basePeriod: 15m
exchanges: [{"eid":"Futures_Binance","currency":"BTC_USDT"}]
*/

//@version=4
////////////////////////////////////////////////////////////
//  Copyright by HPotter v1.0 24/05/2021
// This is combo strategies for get a cumulative signal.
//
// First strategy
// This System was created from the Book "How I Tripled My Money In The
// Futures Market" by Ulf Jensen, Page 183. This is reverse type of strategies.
// The strategy buys at market, if close price is higher than the previous close
// during 2 days and the meaning of 9-days Stochastic Slow Oscillator is lower than 50.
// The strategy sells at market, if close price is lower than the previous close price
// during 2 days and the meaning of 9-days Stochastic Fast Oscillator is higher than 50.
//
// Second strategy
// A technical indicator developed by Tushar Chande to numerically identify
// trends in candlestick charting. It is calculated by taking an 'n' period
// moving average of the difference between the open and closing prices. A
// Qstick value greater than zero means that the majority of the last 'n' days
// have been up, indicating that buying pressure has been increasing.
// Transaction signals come from when the Qstick indicator crosses through the
// zero line. Crossing above zero is used as the entry signal because it is indicating
// that buying pressure is increasing, while sell signals come from the indicator
// crossing down through zero. In addition, an 'n' period moving average of the Qstick
// values can be drawn to act as a signal line. Transaction signals are then generated
// when the Qstick value crosses through the trigger line.
//
// WARNING:
// - For purpose educate only
// - This script to change bars colors.
////////////////////////////////////////////////////////////
Reversal123(Length, KSmoothing, DLength, Level) =>
    vFast = sma(stoch(close, high, low, Length), KSmoothing)
    vSlow = sma(vFast, DLength)
    pos = 0.0
    pos := iff(close[2] < close[1] and close > close[1] and vFast < vSlow and vFast > Level, 1,
	         iff(close[2] > close[1] and close < close[1] and vFast > vSlow and vFast < Level, -1, nz(pos[1], 0)))
	pos


Qstick(Length) =>
    pos = 0.0
    xR = close - open
    xQstick = sma(xR, Length)
    pos:= iff(xQstick > 0, 1,
           iff(xQstick < 0, -1, nz(pos[1], 0)))
    pos

strategy(title="Combo Backtest 123 Reversal & Qstick Indicator", shorttitle="Combo", overlay = true)
line1 = input(true, "---- 123 Reversal ----")
Length = input(14, minval=1)
KSmoothing = input(1, minval=1)
DLength = input(3, minval=1)
Level = input(50, minval=1)
//-------------------------
line2 = input(true, "---- Qstick Indicator ----")
LengthQ = input(14, minval=1)
reverse = input(false, title="Trade reverse")
posReversal123 = Reversal123(Length, KSmoothing, DLength, Level)
posQstick = Qstick(LengthQ)
pos = iff(posReversal123 == 1 and posQstick == 1 , 1,
	   iff(posReversal123 == -1 and posQstick == -1, -1, 0))
possig = iff(reverse and pos == 1, -1,
          iff(reverse and pos == -1 , 1, pos))
if (possig == 1 )
    strategy.entry("Long", strategy.long)
if (possig == -1 )
    strategy.entry("Short", strategy.short)
if (possig == 0)
    strategy.close_all()
barcolor(possig == -1 ? #b50404: possig == 1 ? #079605 : #0536b3 )
Thêm nữa
- Market Cypher Wave B Chiến lược giao dịch tự động
- Chiến lược kiểm tra ngược chính
- Chiến lược kiểm tra ngược nến
- Chiến lược RSI Stochastic được làm mịn bởi Ehlers
- Chiến lược giao dịch đảo ngược động lực
- Chiến lược kênh hồi quy tuyến tính thích nghi
- Chiến lược đường chéo không chênh lệch trung bình động
- Xu hướng vững chắc sau chiến lược
- Giá vượt qua xu hướng trung bình động theo chiến lược
- Chiến lược thoát khỏi EMA đôi Golden Cross
- Chiến lược xu hướng BB KC dần dần
- Chiến lược theo dõi tự động SMA ba lần
- Chiến lược giao dịch vị trí tương lai Bitcoin
- EMA giá với tối ưu hóa ngẫu nhiên dựa trên học máy
- Chiến lược Bollinger Dynamic Breakout
- Chiến lược trung bình di chuyển cao mới hai năm
- Chiến lược giao dịch trung bình động kép