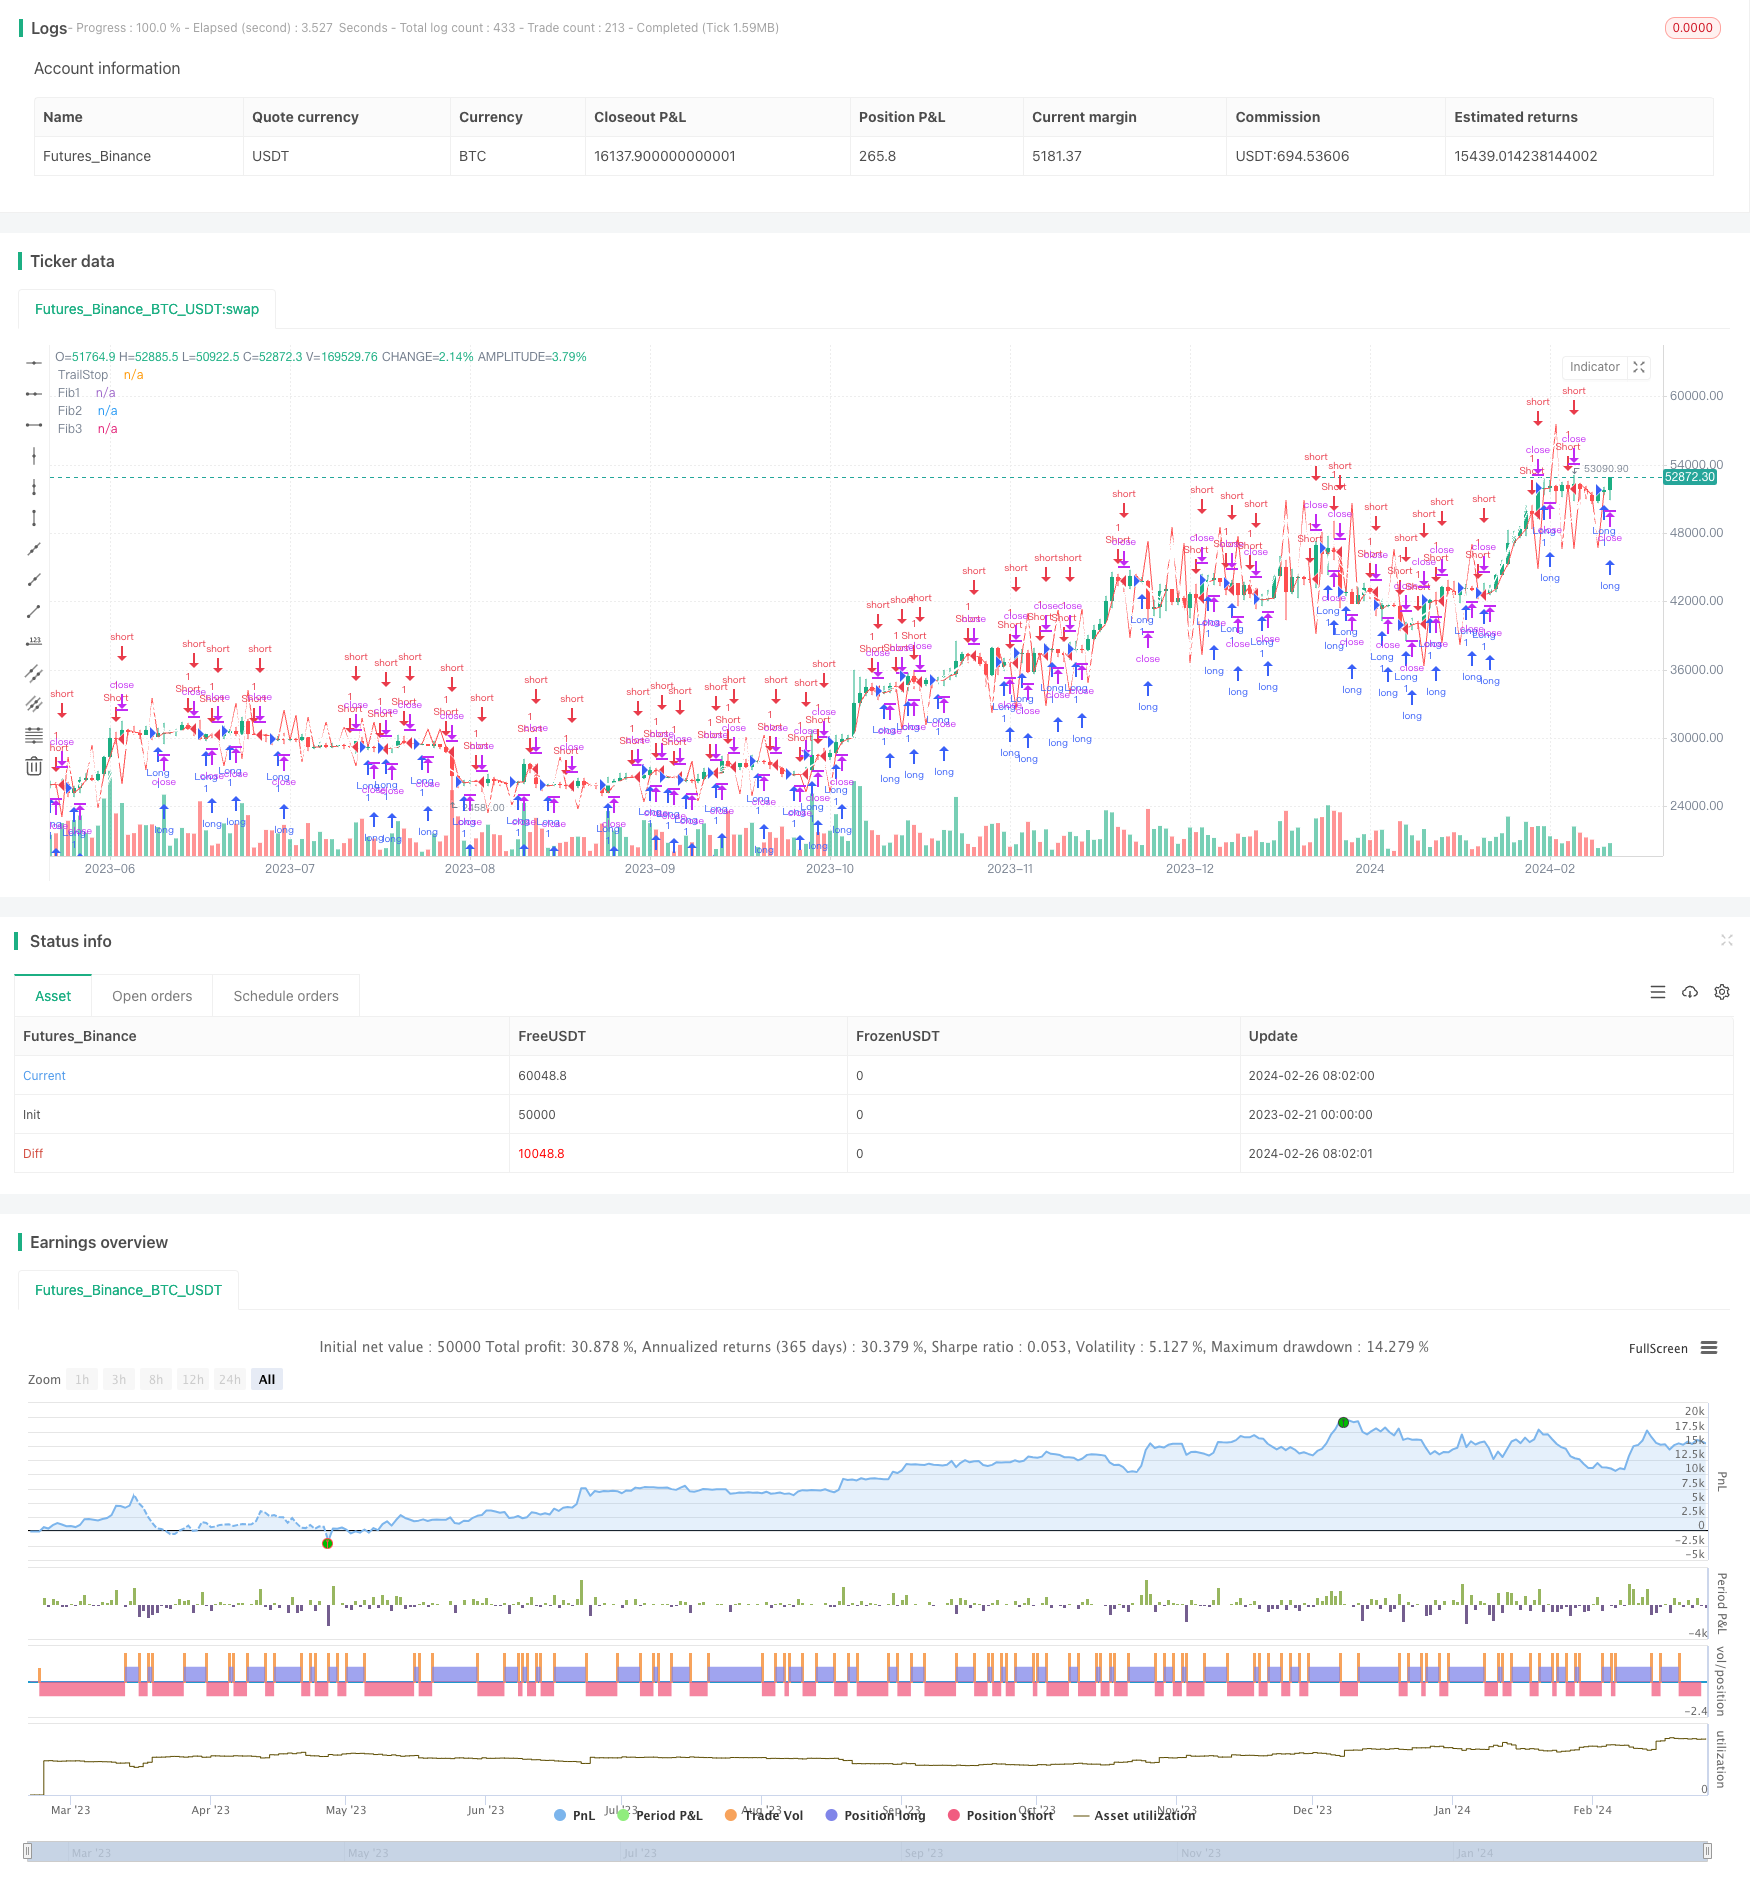
Chiến lược ATR Trailing Stop với mục tiêu Fibonacci Retracement
Tác giả:ChaoZhang, Ngày: 2024-02-28 17:09:12Tags:

Tổng quan
Chiến lược này kết hợp trung bình True Range (ATR) trailing stop và Fibonacci retracement lines để thiết kế một chiến lược theo xu hướng với bảo vệ stop loss. Khi giá vượt qua ATR trailing stop line, chiến lược bắt đầu theo xu hướng. Đồng thời, Fibonacci retracement lines được sử dụng để đặt mục tiêu giá, đạt được sự kết hợp hữu cơ của xu hướng theo, stop loss và take profit.
Chiến lược logic
- Tính toán giá trị ATR và đường dừng kéo ATR. Đường dừng kéo ATR được tính bằng cách nhân giá trị ATR với một nhân (ví dụ 3.5).
- Tính toán ba đường rút lui Fibonacci như mục tiêu lợi nhuận. Các đường rút lui Fibonacci được đặt giữa đường dừng ATR và điểm cao/dưới mới theo tỷ lệ Fibonacci (ví dụ: 61,8%, 78,6%, 88,6%).
- Tạo tín hiệu mua / bán khi giá vượt qua đường dừng ATR để theo xu hướng.
- Đặt mục tiêu lợi nhuận tại ba đường Fibonacci.
Ưu điểm
- ATR dừng lỗ có thể kiểm soát rủi ro một cách hiệu quả và ngăn chặn tổn thất mở rộng.
- Mục tiêu Fibonacci cho phép lợi nhuận hợp lý trong xu hướng trong khi tránh theo đuổi đỉnh và đáy.
- Lý thuyết chiến lược đơn giản và dễ thực hiện.
- Tính linh hoạt để điều chỉnh các thiết lập ATR và Fibonacci để thích nghi với các thị trường khác nhau.
Rủi ro
- ATR thường xuyên kích hoạt dừng lỗ trong các thị trường dao động, dẫn đến giao dịch quá mức.
- Khả năng bỏ lỡ rút và điều chỉnh.
- Tối ưu hóa tham số cần thiết cho thời gian ATR vv.
Tăng cường
- Tích hợp bộ lọc xu hướng để tránh giao dịch trên các thị trường khác nhau.
- Thêm cơ chế nhập lại để giảm mất kéo lại.
- Kiểm tra và tối ưu hóa thời gian ATR, nhân ATR, tham số Fibonacci vv
Tóm lại
Chiến lược này tích hợp hai phương pháp phân tích kỹ thuật quan trọng
/*backtest
start: 2023-02-21 00:00:00
end: 2024-02-27 00:00:00
period: 1d
basePeriod: 1h
exchanges: [{"eid":"Futures_Binance","currency":"BTC_USDT"}]
*/

//@version=5
strategy("ATR TrailStop with Fib Targets", overlay=true)

// Input parameters
atrPeriod = input(5, title="ATR Period")
ATRFactor = input(3.5, title="ATR Factor")
Fib1Level = input(61.8, title="Fib1 Level")
Fib2Level = input(78.6, title="Fib2 Level")
Fib3Level = input(88.6, title="Fib3 Level")

// ATR Calculation
atrValue = ta.atr(atrPeriod)

// ATR TrailStop Calculation
loss = ATRFactor * atrValue
trendUp = close[1] > close[2] ? (close - loss > close[1] ? close - loss : close[1]) : close - loss
trendDown = close[1] < close[2] ? (close + loss < close[1] ? close + loss : close[1]) : close + loss
trend = close > close[2] ? 1 : close < close[2] ? -1 : 0
trailStop = trend == 1 ? trendUp : trendDown

// Fibonacci Levels Calculation
ex = trend > trend[1] ? high : trend < trend[1] ? low : na
fib1 = ex + (trailStop - ex) * Fib1Level / 100
fib2 = ex + (trailStop - ex) * Fib2Level / 100
fib3 = ex + (trailStop - ex) * Fib3Level / 100

// Plotting
plot(trailStop, title="TrailStop", color=color.red)
plot(fib1, title="Fib1", color=color.white)
plot(fib2, title="Fib2", color=color.white)
plot(fib3, title="Fib3", color=color.white)

// Buy and Sell Signals
longCondition = close > trailStop and close[1] <= trailStop
shortCondition = close < trailStop and close[1] >= trailStop

if (longCondition)
    strategy.entry("Long", strategy.long)

if (shortCondition)
    strategy.entry("Short", strategy.short)
Thêm nữa
- Chiến lược theo dõi Bollinger Bands
- Chiến lược SuperTrend Breakout
- Phân tích chiến lược EMA đôi
- Chiến lược giao dịch gọi lại đột phá
- Chiến lược xu hướng chéo trung bình động
- Chiến lược hộp trắng Robot kênh giá
- Chiến lược định lượng xu hướng giá trung bình di chuyển đơn giản
- Chiến lược mua ATR Stop Loss dựa trên thời gian
- Chiến lược đảo ngược đột phá động lượng nhị phân
- Chiến lược mở lỗ
- Chiến lược giao dịch xu hướng Bollinger Bands Breakout
- Dựa trên chiến lược đảo ngược trung bình động
- Chiến lược đột phá ngắn hạn dựa trên Golden Crossover
- Chiến lược giao dịch xu hướng nhiều khung thời gian dựa trên các chỉ số nén
- Chiến lược MACD của EMA Nine Stock
- Chiến lược kết hợp chỉ số dao động định lượng
- Ichimoku Cloud Trend theo chiến lược
- Chiến lược giao dịch trung bình động hai ngày
- Hướng dẫn tìm kiếm kho báu của người Maya
- Chiến lược theo dõi xu hướng dựa trên đường trung bình động