概述
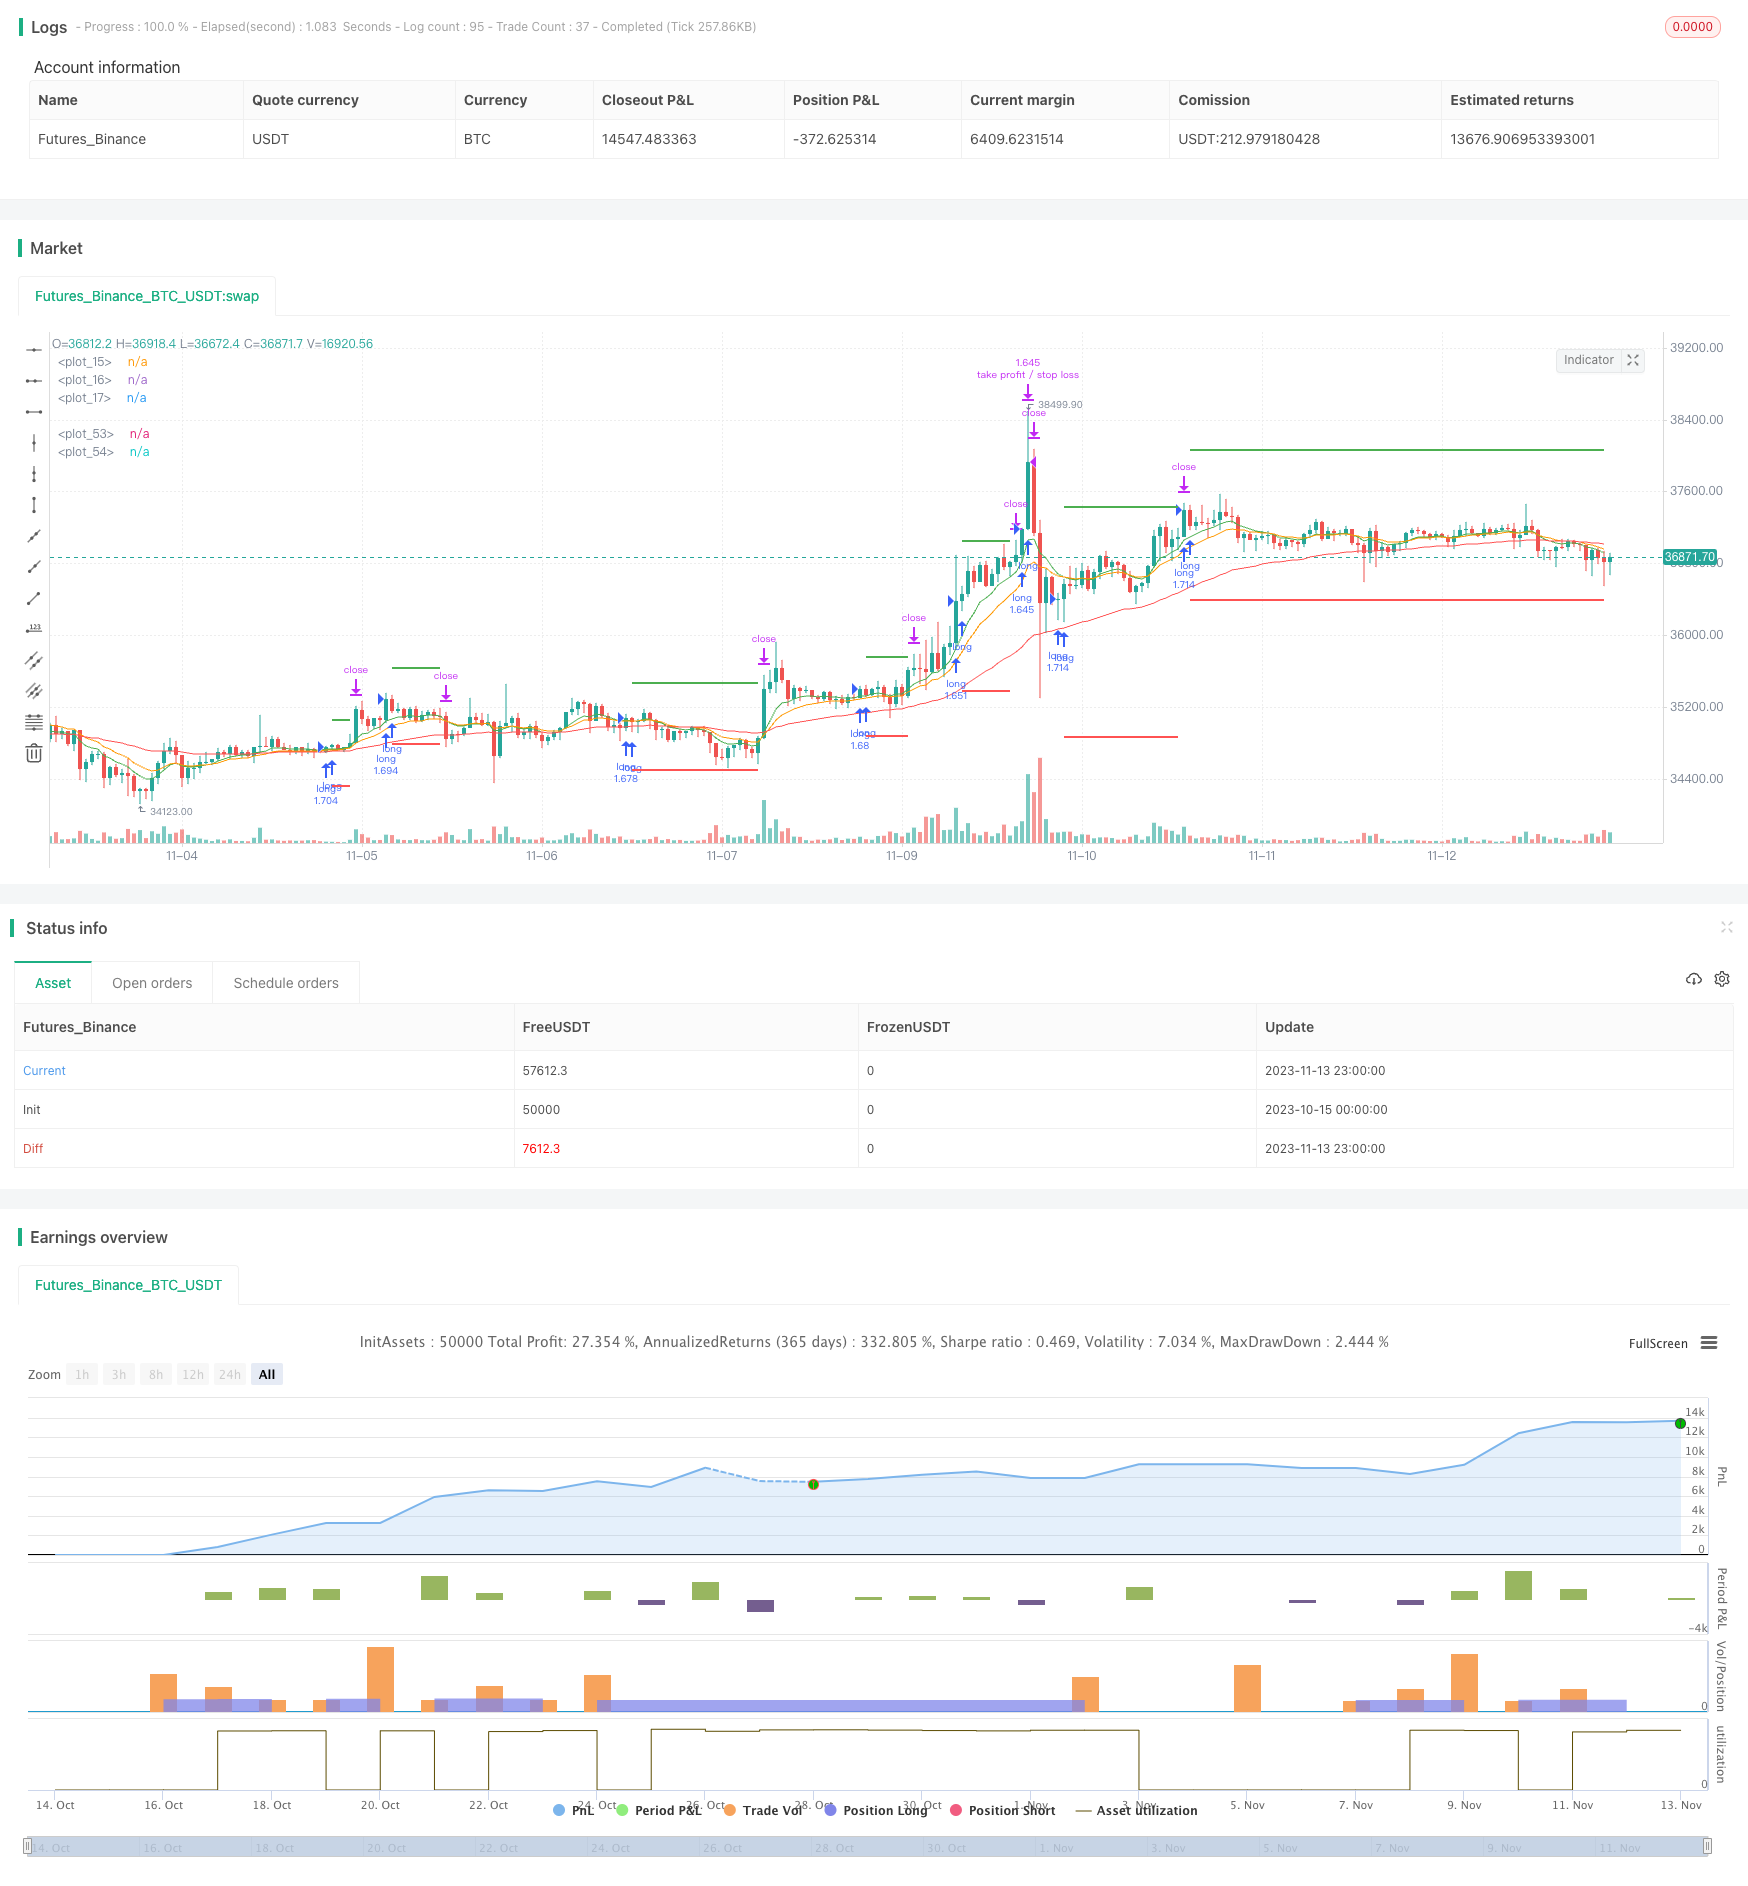
这是一个结合多种指标的趋势跟踪策略。它同时使用三个不同周期的EMA,Stochastic RSI和ATR来识别趋势方向和建立仓位。当快周期EMA上穿慢周期EMA时开仓做多,止损位于最近ATR的值的3倍下方,止盈为2倍最近ATR的值。
原理
该策略使用三个EMA均线,分别是8周期、14周期和50周期的EMA。它们分别代表了不同时间段内的价格趋势。当8周期EMA上穿14周期EMA,14周期EMA上穿50周期EMA时,说明目前处于趋势开始阶段,可以选择建立做多仓位。
Stochastic RSI指标结合RSI和Stochastic计算方法,可以发现超买超卖现象。当Stochastic RSI的K线从下方上穿D线时,说明市场正在从超卖状态转为看涨,可以选做多。
ATR代表最近的波动范围。策略使用ATR的3倍作为止损距离,2倍作为止盈距离,以锁定盈利并控制风险。
优势
- 使用EMA均线可以滤除价格数据中的部分噪音,识别出趋势方向
- Stochastic RSI指标可以发现反转机会
- ATR动态跟踪止损止盈,可以根据市场波动幅度来设定合理的盈亏距离
风险
- 多重指标组合可能出现错误信号
- 固定的止损止盈倍数无法适应市场的变化
- 短周期做多容易受反转影响
可以通过调整EMA周期参数来优化指标的敏感度。也可以使ATR的止损止盈倍数可调,根据市场情况来设定合适参数。此外,可以考虑加入其它指标辅助判断,避免出现误信号。
优化方向
- 调整EMA周期参数,优化指标敏感度
- 使ATR止损止盈倍数可调
- 加入其它指标判断,避免误信号
总结
本策略综合考虑了趋势方向、超买超卖现象和波动范围来识别入场时机。EMA均线和Stochastic RSI指标配合使用可以有效识别趋势,ATR动态跟踪止损止盈有助于风险控制。通过参数调整和优化,该策略可以成为一个可靠的趋势跟踪系统。但需要注意防范指标误信号和固定止损止盈的弊端。
策略源码
/*backtest
start: 2023-10-15 00:00:00
end: 2023-11-14 00:00:00
period: 1h
basePeriod: 15m
exchanges: [{"eid":"Futures_Binance","currency":"BTC_USDT"}]
*/

// This source code is subject to the terms of the Mozilla Public License 2.0 at https://mozilla.org/MPL/2.0/
// © FreddieChopin

//@version=4
strategy("3 x EMA + Stochastic RSI + ATR", overlay = true, default_qty_type = strategy.percent_of_equity, default_qty_value = 100)

// 3x EMA
ema1Length = input(8, "EMA1 Length", minval = 1)
ema2Length = input(14, "EMA2 Length", minval = 1)
ema3Length = input(50, "EMA3 Length", minval = 1)
ema1 = ema(close, ema1Length)
ema2 = ema(close, ema2Length)
ema3 = ema(close, ema3Length)

plot(ema1, color = color.green)
plot(ema2, color = color.orange)
plot(ema3, color = color.red)

// Stochastic RSI
smoothK = input(3, "K", minval=1)
smoothD = input(3, "D", minval=1)
lengthRSI = input(14, "RSI Length", minval=1)
lengthStoch = input(14, "Stochastic Length", minval=1)
src = input(close, title="RSI Source")
rsi1 = rsi(src, lengthRSI)
k = sma(stoch(rsi1, rsi1, rsi1, lengthStoch), smoothK)
d = sma(k, smoothD)

// ATR
atrPeriod = input(14, "ATR Period")
takeProfitMultiplier= input(2.0, "Take-profit Multiplier")
stopLossMultiplier= input(3.0, "Stop-loss Multiplier")
atrSeries = atr(atrPeriod)[1]

longCondition = ema1 > ema2 and ema2 > ema3 and crossover(k, d)
strategy.entry("long", strategy.long, when = longCondition)

float stopLoss = na
float takeProfit = na

if (strategy.position_size > 0)
    if (na(stopLoss[1]))
        stopLoss := strategy.position_avg_price - atrSeries * stopLossMultiplier
    else
        stopLoss := stopLoss[1]
    if (na(takeProfit[1]))
        takeProfit := strategy.position_avg_price + atrSeries * takeProfitMultiplier
    else
        takeProfit := takeProfit[1]

    strategy.exit("take profit / stop loss", limit = takeProfit, stop = stopLoss)

plot(stopLoss, color = color.red, linewidth = 2, style = plot.style_linebr)
plot(takeProfit, color = color.green, linewidth = 2, style = plot.style_linebr)
更多内容