超级趋势与布林带组合策略
Author: ChaoZhang, Date: 2024-03-29 15:18:22Tags:

概述
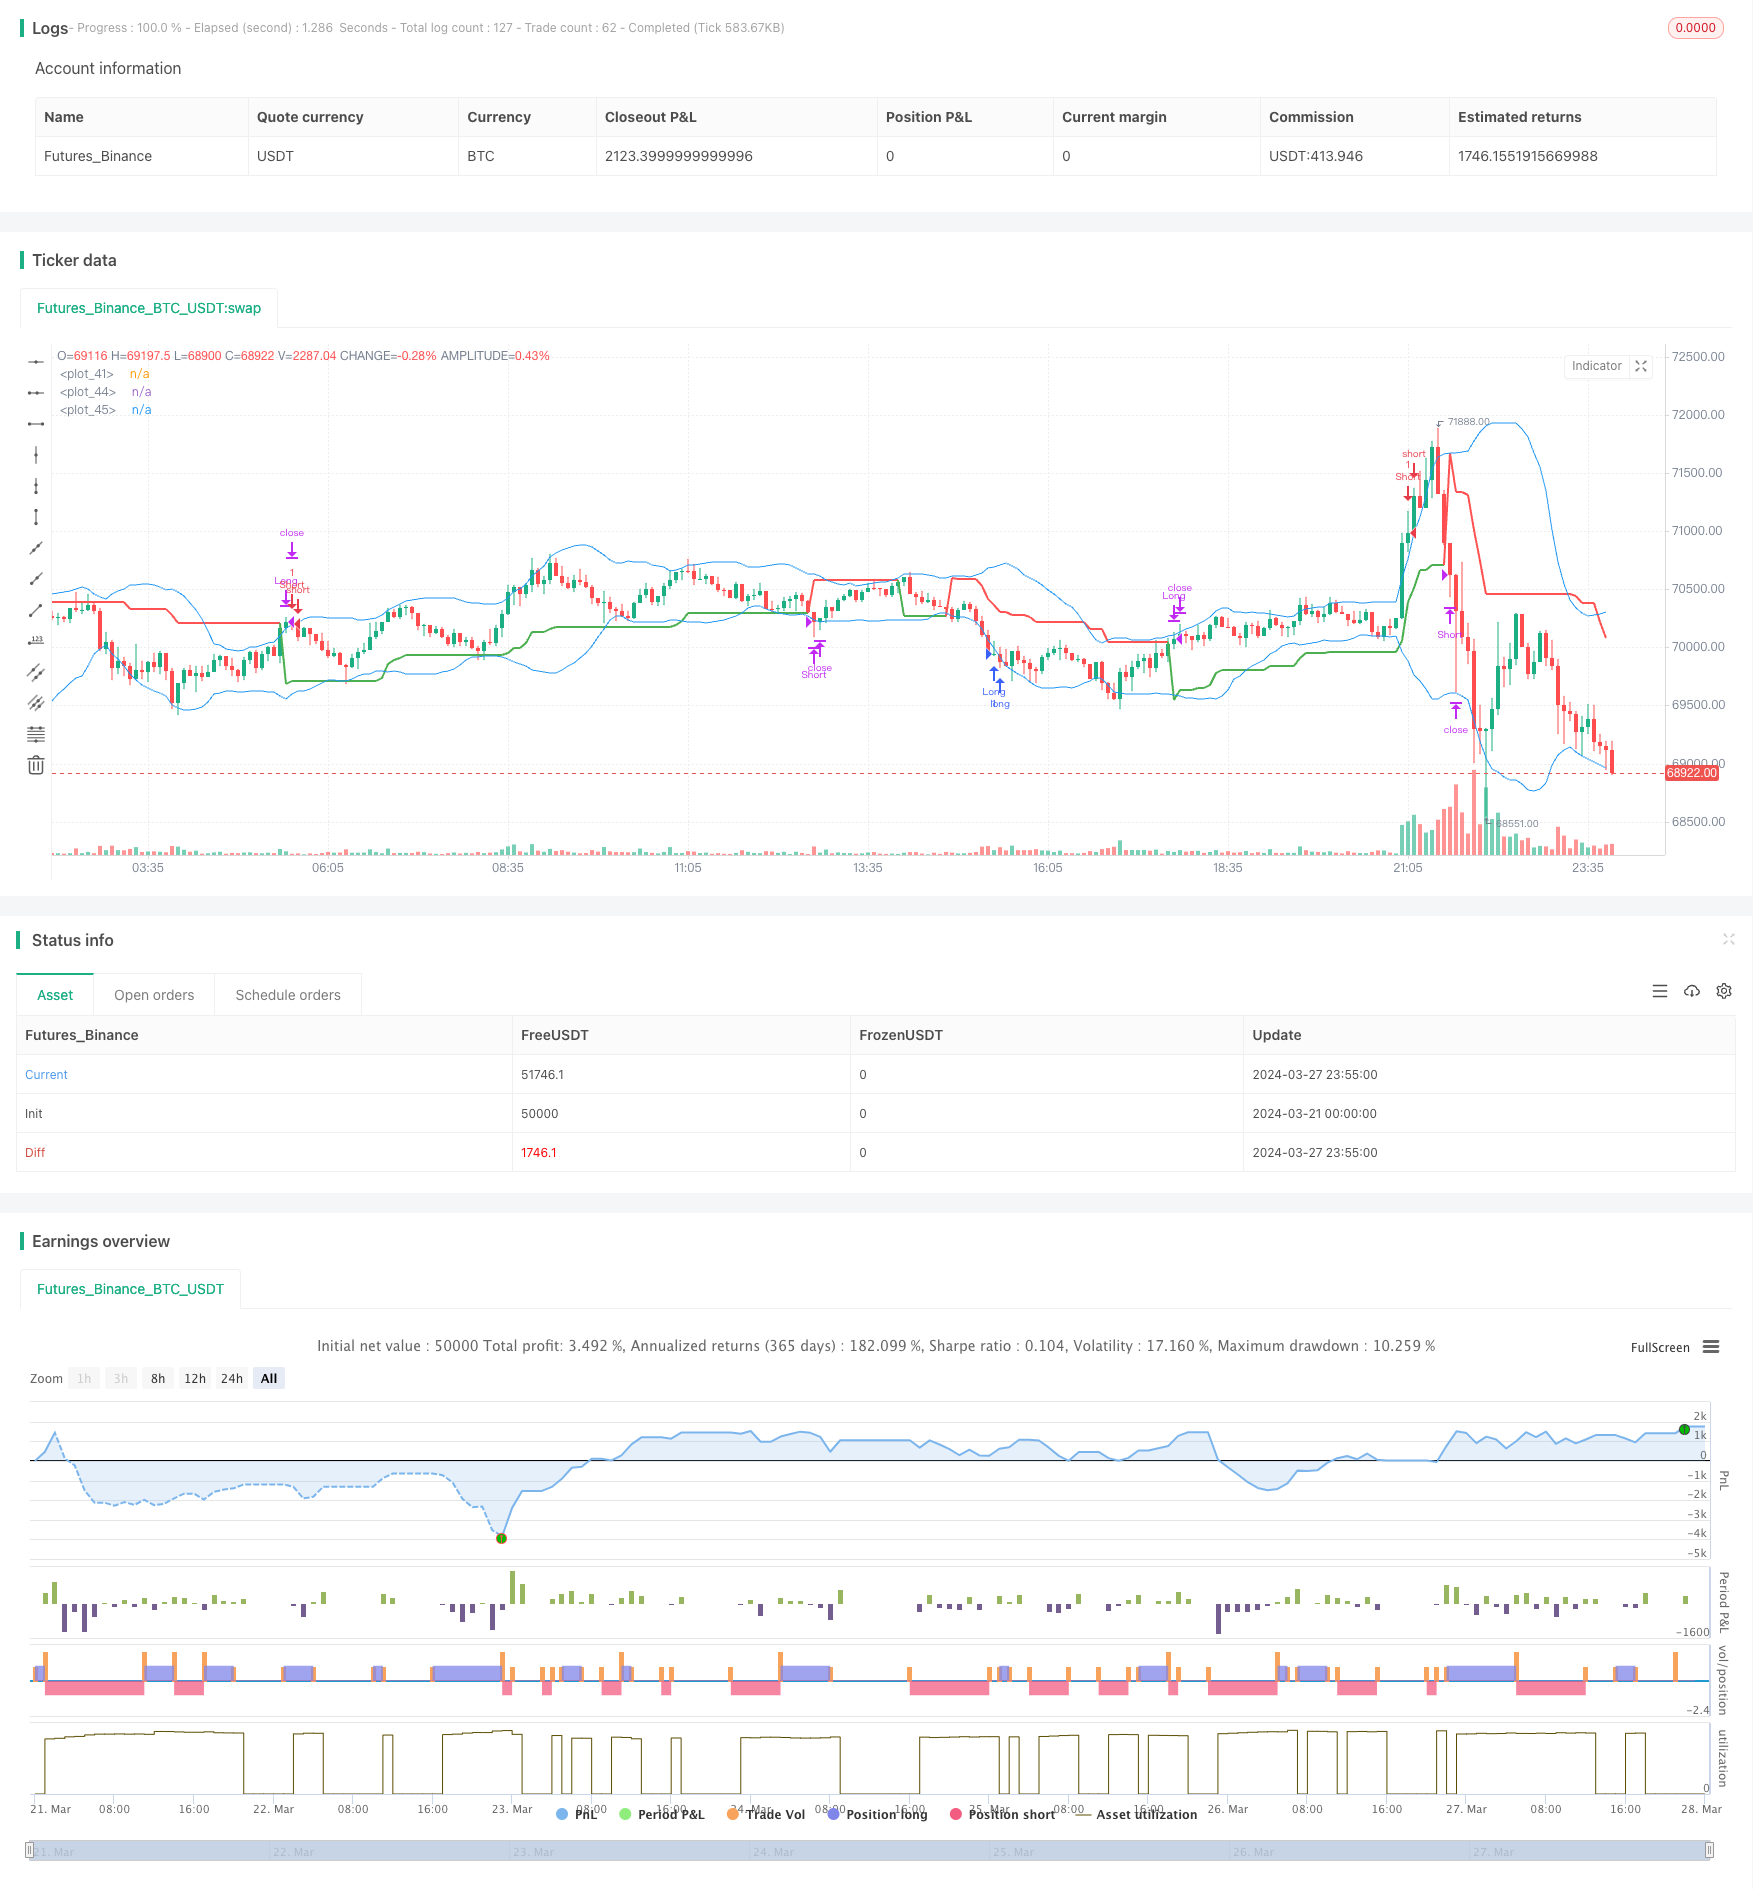
该策略结合了超级趋势指标和布林带指标,旨在捕捉市场的趋势性机会。超级趋势指标用于判断当前市场的趋势方向,而布林带指标用于衡量市场的波动率。当收盘价突破超级趋势线且位于布林带下轨时产生做多信号,当收盘价跌破超级趋势线且位于布林带上轨时产生做空信号。该策略的优势在于能够在趋势明确时及时入场,同时避免在震荡市中过早入场。
策略原理
- 计算真实波幅(ATR)和超级趋势指标,用于判断当前市场的趋势方向。
- 计算布林带上下轨,用于衡量市场的波动率。
- 当收盘价突破超级趋势线且位于布林带下轨时,产生做多信号;当收盘价跌破超级趋势线且位于布林带上轨时,产生做空信号。
- 当持有多头仓位时,如果收盘价跌破超级趋势线则平仓;当持有空头仓位时,如果收盘价突破超级趋势线则平仓。
策略优势
- 结合趋势和波动率两个维度的信息,能够更全面地把握市场机会。
- 在趋势明确时能够及时入场,有助于捕捉趋势行情的收益。
- 在震荡市中,布林带与超级趋势结合能够有效过滤掉假突破信号,降低震荡行情下的亏损风险。
- 代码逻辑清晰,参数较少,易于理解和实现。
策略风险
- 在单边趋势行情下,由于频繁出现突破信号,可能会导致交易频率过高,增加交易成本。
- 对突破点的捕捉依赖于超级趋势指标,而该指标对参数较为敏感,不同参数下指标走势差异较大,可能影响策略效果。
- 布林带宽度会随着市场波动率的变化而变化,在高波动率环境下可能会扩大止损。
策略优化方向
- 可以考虑引入更多有效的过滤条件,如交易量、市场情绪等,以进一步提高信号的可靠性。
- 对于超级趋势指标的参数,可以进行优化测试,选择最佳参数以提高策略稳定性。
- 在交易执行方面,可以引入更为细致的仓位管理和风险控制措施,如设置移动止损、动态调整仓位等,以降低单次交易的风险敞口。
总结
超级趋势布林带组合策略是一个趋势追踪型策略,通过结合趋势和波动率两个市场要素,能够比较有效地捕捉趋势性机会。但该策略也存在一定的局限性,如对参数敏感、在高波动率环境下风险加大等。因此,在实际应用中还需要根据市场特点和自身风险偏好,对策略进行适当的优化和改进。
/*backtest
start: 2024-03-21 00:00:00
end: 2024-03-28 00:00:00
period: 5m
basePeriod: 1m
exchanges: [{"eid":"Futures_Binance","currency":"BTC_USDT"}]
*/

// This Pine Script™ code is subject to the terms of the Mozilla Public License 2.0 at https://mozilla.org/MPL/2.0/
// © sabhiv27

//@version=4
strategy("Supertrend & Bollinger Bands Strategy", shorttitle="ST_BB_Strategy", overlay=true)

// Input options
factor = input(3, title="Supertrend Factor")
length = input(10, title="ATR Length")
bollinger_length = input(20, title="Bollinger Bands Length")
bollinger_deviation = input(2, title="Bollinger Bands Deviation")

// Calculate True Range for Supertrend
truerange = rma(tr, length)

// Calculate Supertrend
var float up_trend = na
var float dn_trend = na
var float trend = na
up_signal = hl2 - (factor * truerange)
dn_signal = hl2 + (factor * truerange)
up_trend := close[1] > up_trend[1] ? max(up_signal, up_trend[1]) : up_signal
dn_trend := close[1] < dn_trend[1] ? min(dn_signal, dn_trend[1]) : dn_signal
trend := close > dn_trend ? 1 : close < up_trend ? -1 : nz(trend[1], 1)

// Calculate Bollinger Bands
basis = sma(close, bollinger_length)
dev = stdev(close, bollinger_length)
upper_band = basis + bollinger_deviation * dev
lower_band = basis - bollinger_deviation * dev

// Entry conditions
long_condition = crossover(close, up_trend) and close < lower_band
short_condition = crossunder(close, dn_trend) and close > upper_band

// Exit conditions
exit_long_condition = crossover(close, dn_trend)
exit_short_condition = crossunder(close, up_trend)

// Plot Supertrend
plot(trend == 1 ? up_trend : dn_trend, color=trend == 1 ? color.green : color.red, linewidth=2)

// Plot Bollinger Bands
plot(upper_band, color=color.blue)
plot(lower_band, color=color.blue)

// Generate buy and sell signals
strategy.entry("Long", strategy.long, when=long_condition)
strategy.entry("Short", strategy.short, when=short_condition)
strategy.close("Long", when=exit_long_condition)
strategy.close("Short", when=exit_short_condition)
更多内容
- EMA双均线交叉趋势追踪策略
- 均线金叉死叉策略
- RSI 动量策略
- EMA RSI 趋势追踪与动量策略
- Gaussian Channel趋势追踪策略
- 布林带与DCA结合的高频交易策略
- 修正相对强弱指数趋势跟踪策略
- 日内多头突破策略
- EMA-MACD-SuperTrend-ADX-ATR多重指标交易信号策略
- 趋势跟随可变仓位网格策略
- MACD趋势跟踪策略
- EMA双均线交叉策略
- 黄金短线交易策略 (XAUUSD Scalper 1m)
- 基于向量蜡烛图的通道突破与自定义ChoCH策略
- 突破最高价EMA交叉策略
- 动态趋势追踪策略
- 超级趋势ATR策略
- 三次指数平均移动线与相对强弱指数结合的1分钟图表加密货币量化交易策略
- 基于RSI和双均线的1小时趋势追踪策略
- 指数移动平均线交叉量化交易策略