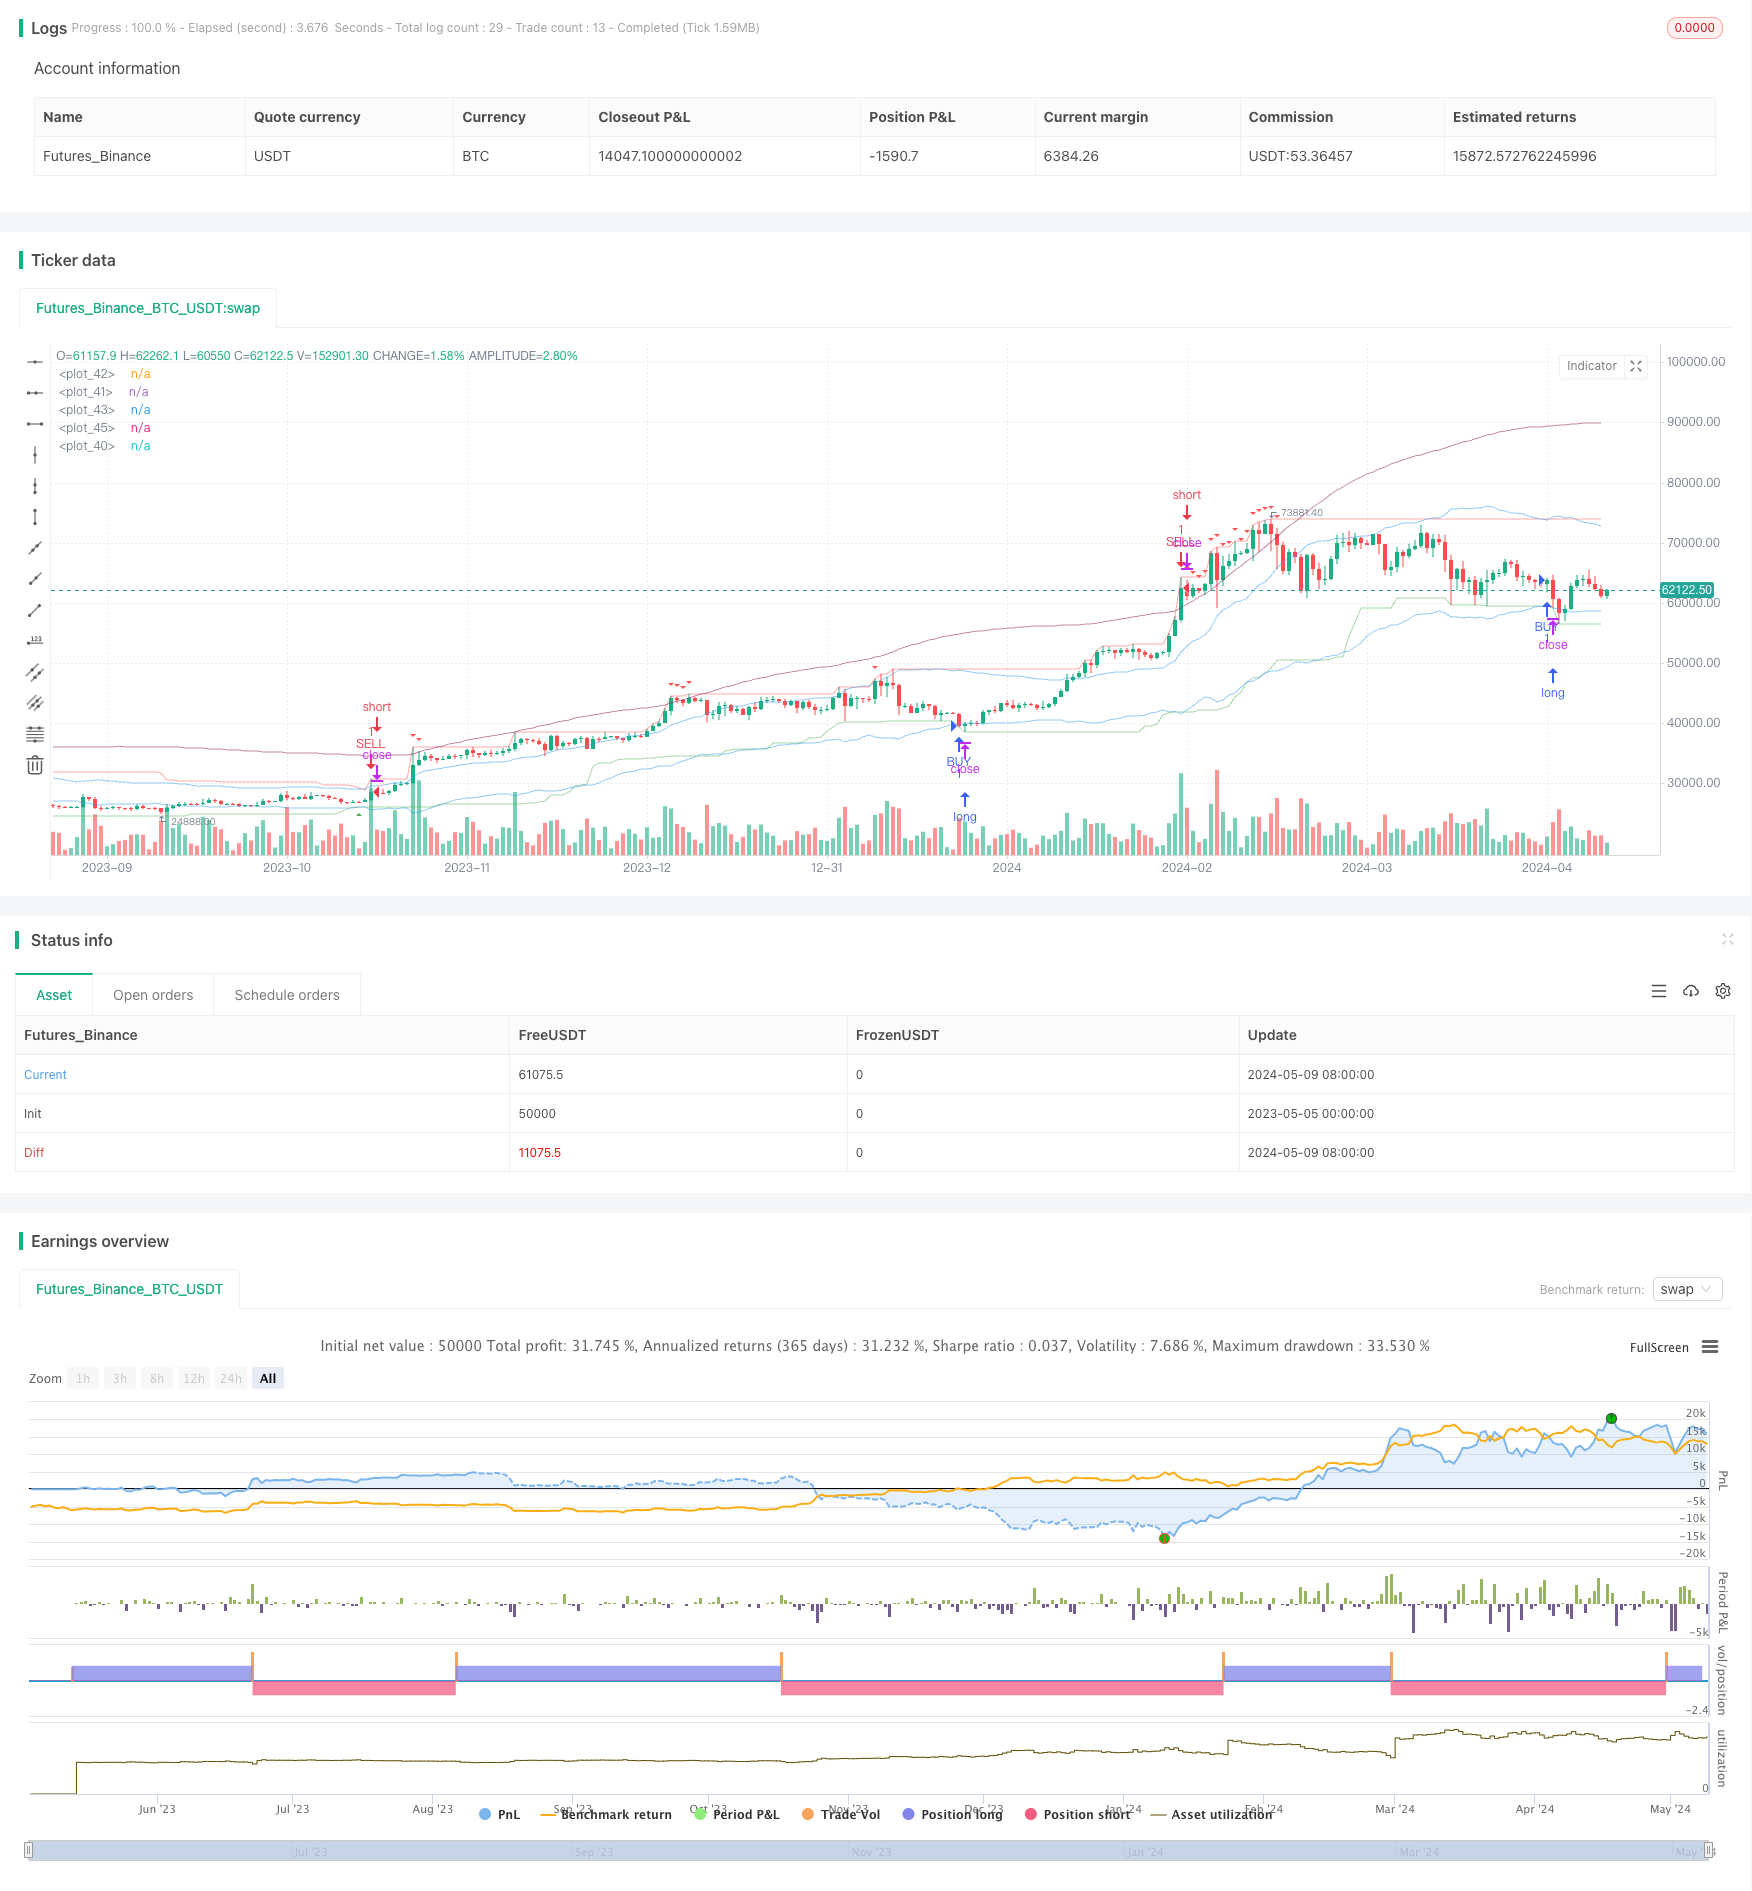
####概述 该策略使用指数移动平均线(EMA)、最高价、最低价和平均真实波幅(ATR)等技术指标,通过判断价格与EMA、最高价和最低价的关系,识别当前的趋势方向,在向上突破最低价时买入,在向下突破最高价或触及动态阻力位时卖出,以捕捉趋势行情,获取超额收益。
####策略原理 1. 计算ATR,用于衡量市场波动率,为构建动态通道提供依据。 2. 计算最高价和最低价,作为判断趋势方向的基础。 3. 计算EMA_HL,即最高价和最低价的EMA,作为动态通道的中轴线。 4. 计算EMA_HIGHEST和EMA_LOWEST,即在EMA_HL的基础上加减ATR乘以一定比例得到的上下轨。 5. 计算SELL_LINE,即在最高价的基础上加上ATR乘以一定比例得到的动态阻力位。 6. 判断多头信号:当EMA_LOWEST向上突破最低价且收盘价低于EMA_MID时,产生买入信号。 7. 判断空头信号:当EMA_HIGHEST向下突破最高价且收盘价高于EMA_MID时,或者最高价触及SELL_LINE时,产生卖出信号。
####策略优势 1. 利用EMA、最高价、最低价等指标综合判断趋势,信号可靠性高。 2. 引入ATR作为波动率衡量标准,构建动态通道,适应不同市场状态。 3. 设置SELL_LINE动态阻力位,及时锁定利润,控制回撤风险。 4. 参数可调,适应不同品种和周期,具有一定的普适性和灵活性。
####策略风险 1. 趋势识别可能存在滞后,导致入场时机不够理想。 2. 参数设置不当可能导致信号频繁,增加交易成本。 3. 对于震荡市,策略表现可能不佳,需要结合其他方法判断。 4. 极端行情下,如快速变盘,策略可能失效,需要设置止损。
####策略优化方向 1. 引入更多指标,如成交量、波动率等,丰富趋势判断维度,提高信号可靠性。 2. 对参数进行优化,如ATR倍数、EMA周期等,找到最优参数组合,提高策略稳定性。 3. 加入仓位管理,如根据ATR动态调整仓位,控制单笔风险敞口。 4. 设置止损和止盈,控制单笔最大亏损和最大收益,提高风险收益比。 5. 结合其他策略,如突破策略、均值回归策略等,形成策略组合,提高整体稳健性。
####总结 该策略利用EMA、最高价、最低价等技术指标,结合ATR构建动态通道,通过突破最高价和最低价产生交易信号,以捕捉趋势行情,是一个简单实用的趋势追踪策略。策略参数可调,适应性和灵活性较好,但在震荡市表现可能欠佳,需要通过引入更多指标、优化参数、加入风控等方式进一步优化和改进。
/*backtest
start: 2023-05-05 00:00:00
end: 2024-05-10 00:00:00
period: 1d
basePeriod: 1h
exchanges: [{"eid":"Futures_Binance","currency":"BTC_USDT"}]
*/

// This Pine Script™ code is subject to the terms of the Mozilla Public License 2.0 at https://mozilla.org/MPL/2.0/
// © Maboi_q

//@version=5
strategy("buy sell Trend", overlay=true)

atr_length = input.int(defval=14, title='atr length')
highest_length = input.int(defval=60, title='highest length')
highest_s_length = input.int(defval=60, title='sell highest length')
lowest_length = input.int(defval=30, title='lowest length')
sell_l_length = input.int(defval=55, title='sell line length')

f = 2.382
f2 = 5.618

atr = ta.atr(atr_length)
highest = ta.highest(highest_length)
lowest = ta.lowest(lowest_length)

f_atr = atr * f
ema_hl = ta.ema((highest[1] + lowest[1]) / 2, 14)
ema_highest = ema_hl + f_atr
ema_lowest = ema_hl - f_atr
ema_mid = (ema_highest + ema_lowest) / 2

bs_hi = ta.highest(highest_s_length)
f_atr2 = atr * f2
sell_line = ta.ema(bs_hi[1] + f_atr2, sell_l_length)

buy_cond = ta.crossover(ema_lowest, lowest) and close < ema_mid
sell_cond = (ta.crossunder(ema_highest, highest) and close > ema_mid) or high >= sell_line

if buy_cond
    strategy.entry('BUY', strategy.long)

if sell_cond
    strategy.entry('SELL', strategy.short)


plot(sell_line, color=color.new(color.maroon, 50))
plot(highest, color=color.new(color.red, 50))
plot(lowest, color=color.new(color.green, 50))
plot(ema_highest, color=color.new(color.blue, 50))
// plot(ema_mid, color=color.new(color.gray, 50))
plot(ema_lowest, color=color.new(color.blue, 50))

plotshape(buy_cond, title='buy', style=shape.triangleup, location=location.belowbar,
 color=color.green, textcolor=color.green, size=size.tiny)

plotshape(sell_cond, title='sell', style=shape.triangledown, location=location.abovebar,
 color=color.red, textcolor=color.red, size=size.tiny)