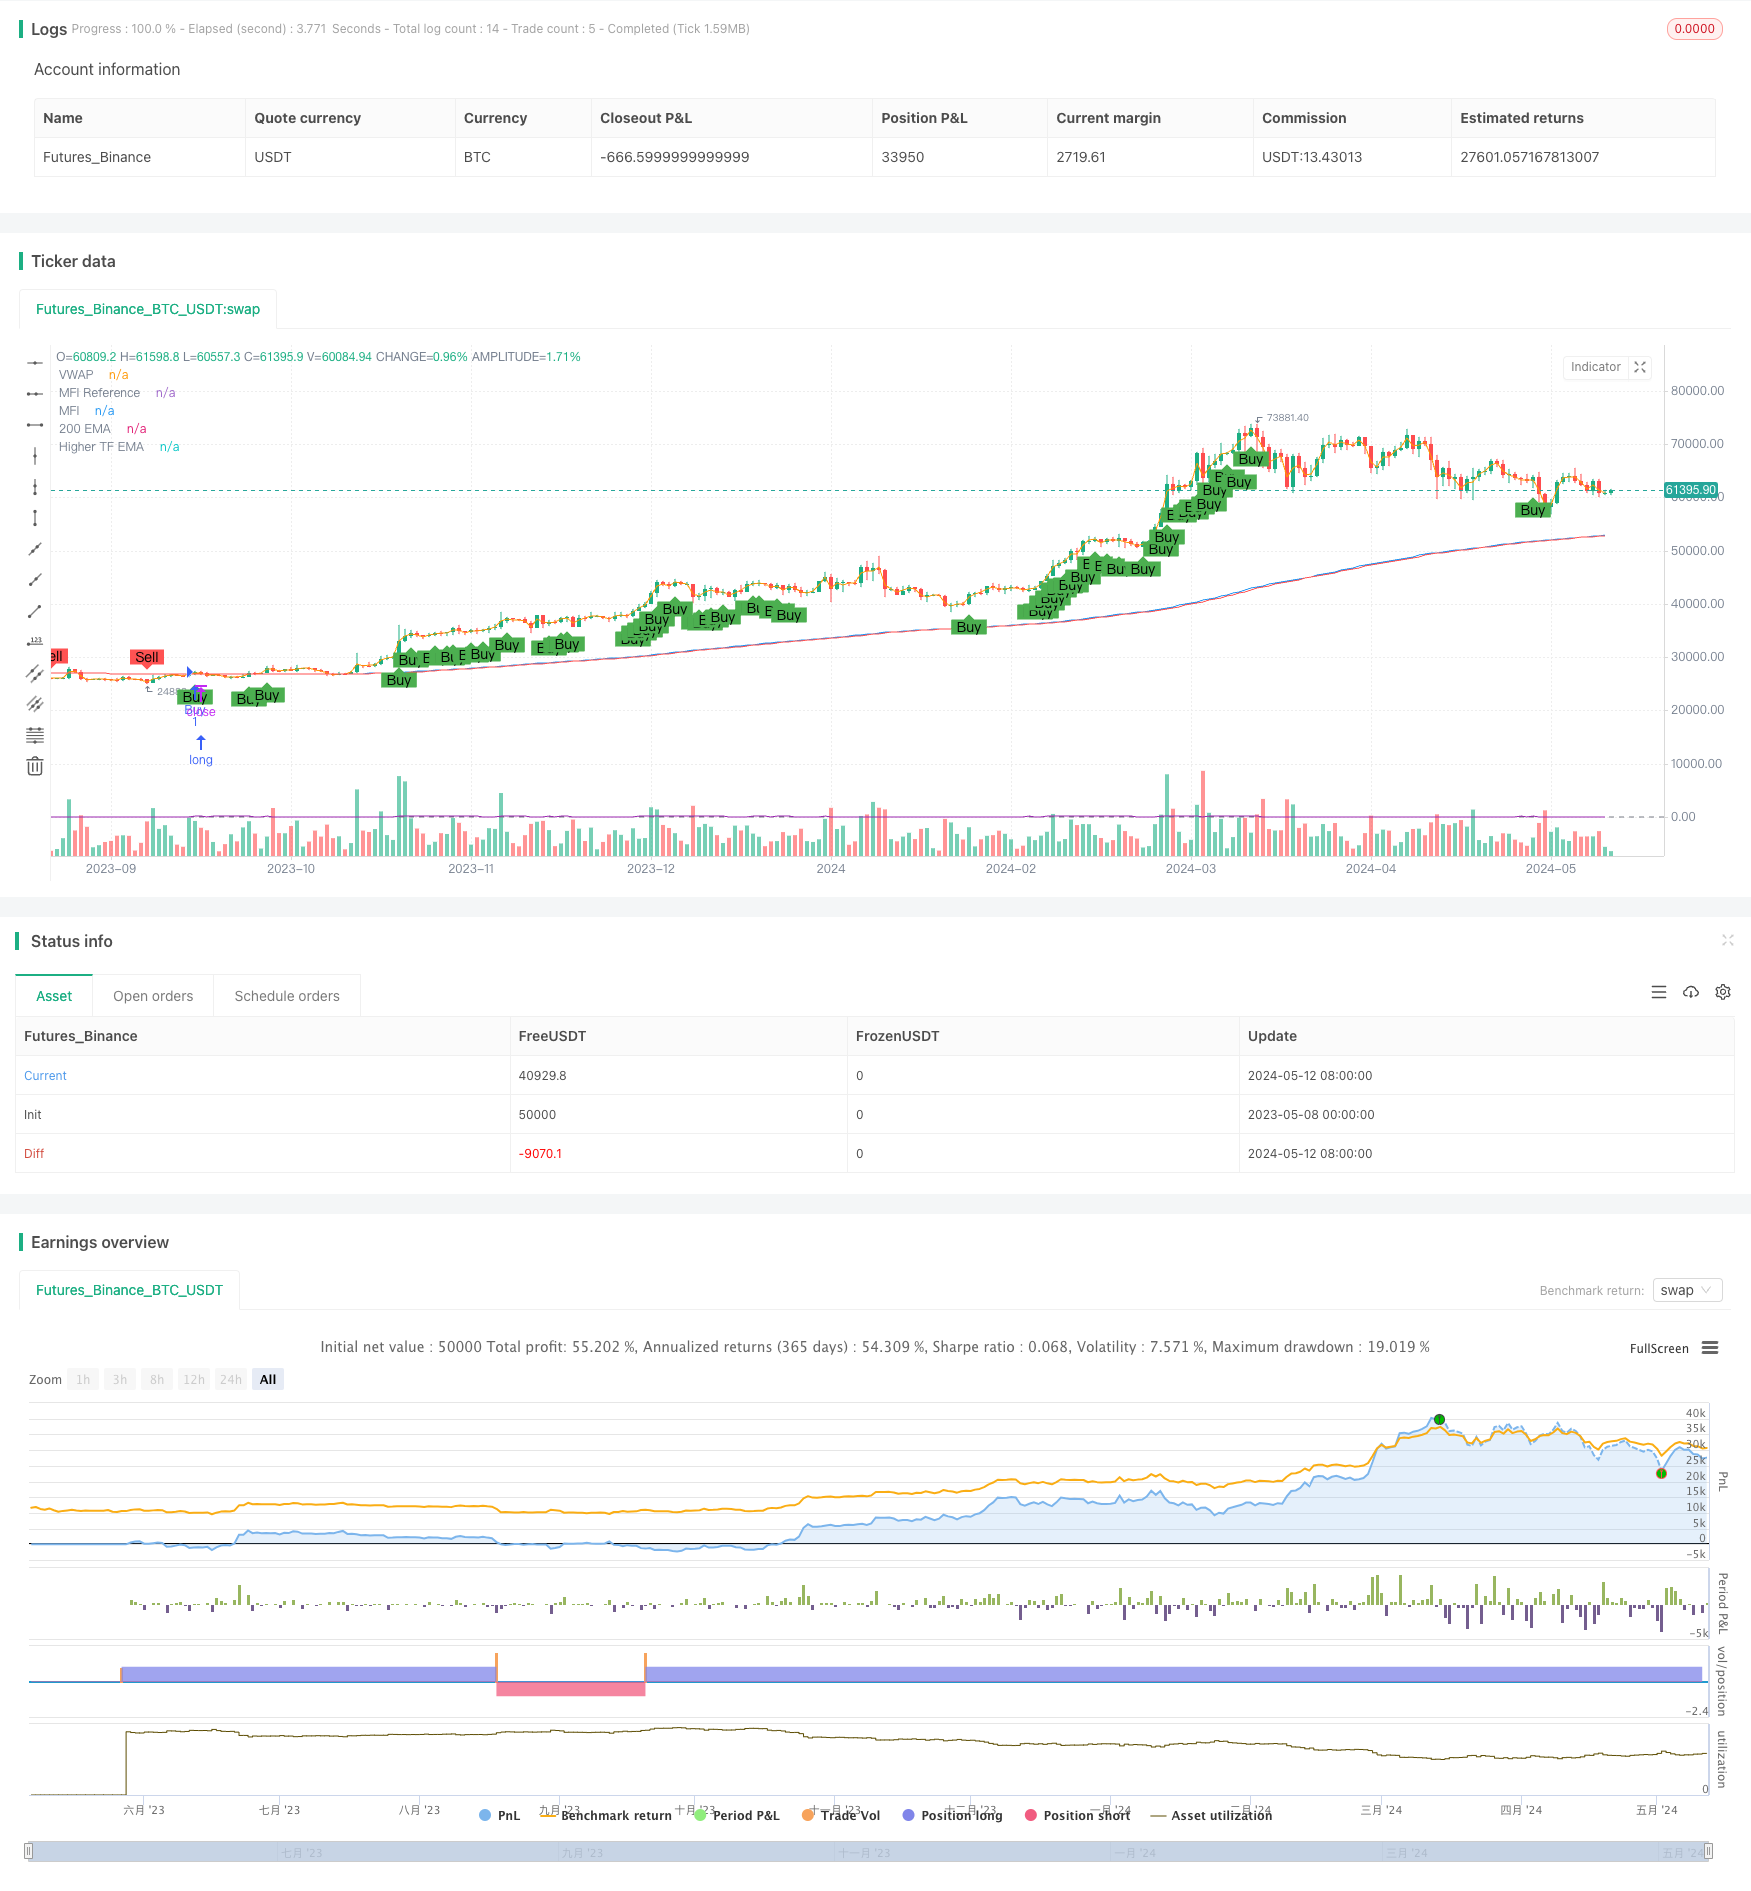
概述
该策略结合了200日指数移动平均线(200 EMA)、成交量加权平均价格(VWAP)和资金流指标(MFI)来生成买卖信号。主要思路是利用这三个指标的组合来判断趋势方向和强度,在价格突破200 EMA且VWAP和MFI指标确认的情况下产生交易信号。同时,引入高级时间周期的200 EMA作为趋势过滤,只有当前时间周期和高级时间周期的趋势一致时才进行交易。此外,还通过对价格走势的连续性进行判断来提高信号的可靠性。
策略原理
- 计算200日EMA,并根据输入的缓冲区百分比计算出缓冲区上下轨。
- 计算VWAP指标。
- 计算14周期的MFI指标,并设定买入和卖出的阈值。
- 获取高级时间周期的200 EMA作为趋势过滤。
- 判断价格走势的连续性,检查是否满足连续上涨或下跌的条件。
- 综合以上条件,产生买入信号的条件为:收盘价突破200 EMA上轨且高于VWAP,MFI大于买入阈值,收盘价高于高级时间周期的200 EMA,且价格走势连续上涨。
- 卖出信号的条件为:收盘价跌破200 EMA下轨且低于VWAP,MFI小于卖出阈值,收盘价低于高级时间周期的200 EMA,且价格走势连续下跌。
- 当满足买入或卖出条件时,策略进行相应的多头或空头交易。
策略优势
- 结合多个指标进行综合判断,有效过滤虚假信号,提高信号可靠性。
- 引入高级时间周期的趋势过滤,使交易决策与大趋势保持一致,降低逆势交易风险。
- 通过价格走势连续性的判断,进一步确认趋势强度,提高入场时机的准确性。
- 使用缓冲区概念,允许价格在一定范围内波动,避免频繁交易。
- 参数可调,灵活性高,可根据不同市场和交易风格进行优化。
策略风险
- 在震荡市或趋势转折点,指标可能会产生虚假信号,导致亏损。
- 参数设置不当可能导致策略表现不佳,如缓冲区过大可能错失交易机会,过小可能导致频繁交易。
- 策略依赖于历史数据进行计算和判断,对于突发事件或黑天鹅事件可能反应不及时。
- 在某些特殊市场环境下,如趋势极度延续或剧烈波动时,策略可能失效。
策略优化方向
- 对于参数的优化,可以通过对历史数据进行回测,寻找最佳的参数组合,如EMA周期、MFI周期和阈值、缓冲区大小等。
- 可以考虑引入其他辅助指标或市场情绪指标,如布林带、RSI等,以进一步提高信号的可靠性和稳健性。
- 在交易管理方面,可以引入止损止盈机制,如移动止损或基于ATR的动态止损,以控制单笔交易风险。
- 可以探索不同的仓位管理策略,如基于风险的仓位sizing或凯利公式等,以优化策略的风险收益比。
- 考虑引入机器学习或自适应算法,动态调整策略参数,以适应市场变化。
总结
该策略通过结合200日EMA、VWAP和MFI指标,同时考虑高级时间周期的趋势和价格走势的连续性,构建了一个相对稳健的趋势跟踪交易系统。策略通过多个条件的综合判断来过滤虚假信号,提高入场时机的准确性。同时,策略参数的灵活性允许根据不同市场和交易风格进行优化。但策略也存在一定的风险,如在震荡市或趋势转折点可能产生亏损,以及参数设置不当可能导致表现不佳等。未来可以从参数优化、引入辅助指标、风险管理等方面对策略进行进一步优化和改进。总的来说,该策略为趋势跟踪交易提供了一个较为全面和可行的框架。
策略源码
/*backtest
start: 2023-05-08 00:00:00
end: 2024-05-13 00:00:00
period: 1d
basePeriod: 1h
exchanges: [{"eid":"Futures_Binance","currency":"BTC_USDT"}]
*/

//@version=5
strategy("200 EMA, VWAP, MFI Strategy - Visible Signals", overlay=true, pyramiding=0)

// Inputs for dynamic adjustments
buffer = input.float(0.2, title="EMA Buffer Percentage", step=0.1) / 100
higherTimeframe = input.timeframe("15", title="Higher Timeframe")
mfiBuyThreshold = input(60, title="MFI Buy Threshold")
mfiSellThreshold = input(40, title="MFI Sell Threshold")
consecutiveCloses = input.int(1, title="Consecutive Closes for Confirmation")

// Calculate the 200-period EMA
ema200 = ta.ema(close, 200)
emaBufferedHigh = ema200 * (1 + buffer)
emaBufferedLow = ema200 * (1 - buffer)
emaHigher = request.security(syminfo.tickerid, higherTimeframe, ta.ema(close, 200))

// VWAP calculation
vwap = ta.vwap(hlc3)

// Money Flow Index calculation
mfiLength = 14
mfi = ta.mfi(close, mfiLength)

// Plotting the indicators
plot(ema200, title="200 EMA", color=color.blue)
plot(vwap, title="VWAP", color=color.orange)
plot(mfi, title="MFI", color=color.purple)
hline(50, "MFI Reference", color=color.gray, linestyle=hline.style_dashed)
plot(emaHigher, title="Higher TF EMA", color=color.red)

// Price action confirmation
isUpTrend = ta.rising(close, consecutiveCloses)
isDownTrend = ta.falling(close, consecutiveCloses)

// Define entry conditions
longCondition = close > emaBufferedHigh and close > vwap and mfi > mfiBuyThreshold and close > emaHigher and isUpTrend
shortCondition = close < emaBufferedLow and close < vwap and mfi < mfiSellThreshold and close < emaHigher and isDownTrend

// Trading execution
if (longCondition)
    strategy.entry("Buy", strategy.long)

if (shortCondition)
    strategy.entry("Sell", strategy.short)

// Plot shapes for signals
plotshape(series=longCondition, location=location.belowbar, color=color.green, style=shape.labelup, size=size.small, title="Buy Signal", text="Buy")
plotshape(series=shortCondition, location=location.abovebar, color=color.red, style=shape.labeldown, size=size.small, title="Sell Signal", text="Sell")