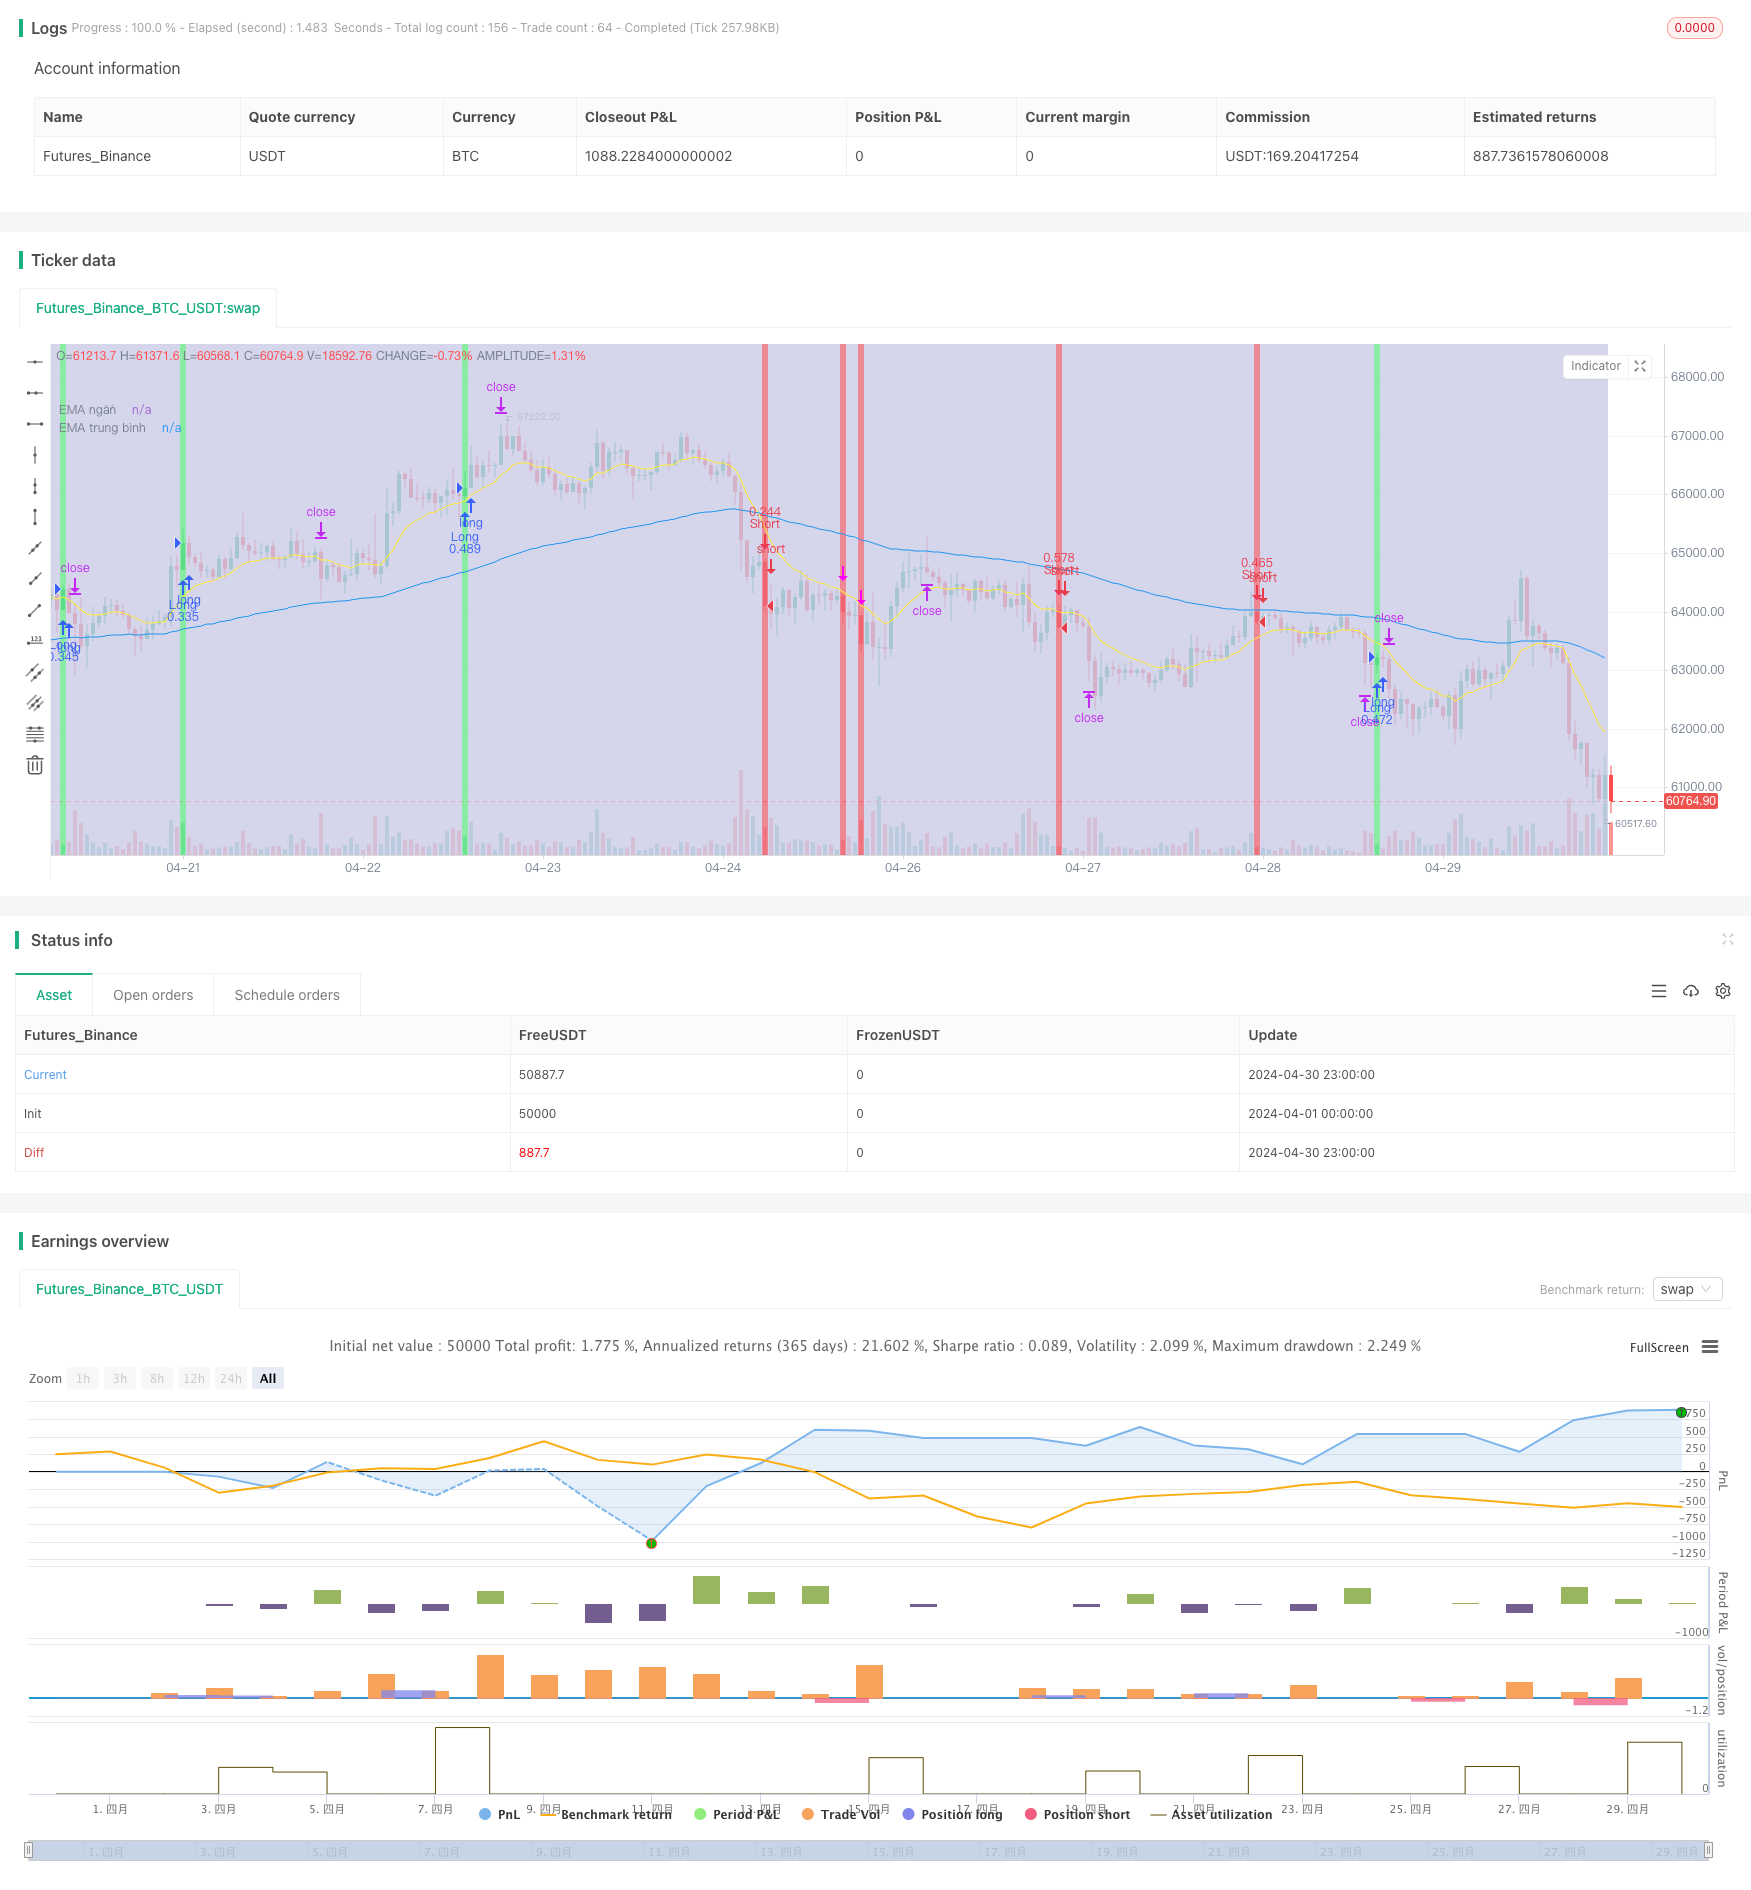
漢越-基於多EMA、ATR和RSI的趨勢順勢交易策略
Author: ChaoZhang, Date: 2024-05-14 16:37:52Tags: EMAATRRSI

概述
該策略使用三條不同週期的指數移動平均線(EMA)來判斷市場趨勢,並結合相對強弱指數(RSI)和平均真實波幅(ATR)來確定進場點和止損止盈。當價格突破三條EMA形成的通道時,並且RSI也突破其移動平均線時,策略就會觸發開倉信號。同時,ATR用於控制頭寸規模和設置止損位,而收益風險比(RR)則用於確定止盈位。該策略的主要優勢在於其簡單有效,能夠順應市場趨勢進行交易,並通過嚴格的風控措施來限制潛在損失。
策略原理
- 計算三條不同週期(短期、中期和長期)的EMA,用於判斷市場的總體趨勢。
- 使用RSI指標來確認趨勢的強度和可持續性,當RSI突破其移動平均線時,表明趨勢有所改變。
- 結合價格與EMA通道的關係以及RSI信號來產生開倉信號:當價格突破EMA通道且RSI也突破其移動平均線時,按照趨勢方向開倉。
- 利用ATR來確定頭寸規模和止損位,控制每筆交易的風險敞口。
- 根據預設的收益風險比(如1.5:1)來設置止盈位,以確保策略的盈利能力。
優勢分析
- 簡單有效:該策略僅使用了幾個常見的技術指標,邏輯清晰,易於理解和實施。
- 趨勢跟隨:通過EMA通道和RSI的結合,策略能夠順應市場趨勢進行交易,捕捉較大的價格波動。
- 風險控制:使用ATR來設置止損位和控制頭寸規模,有效限制了每筆交易的風險敞口。
- 靈活性:策略參數(如EMA週期、RSI週期、ATR倍數等)可以根據不同的市場和交易風格進行調整,以優化性能。
風險分析
- 參數優化:策略的表現在很大程度上取決於參數的選擇,不當的參數設置可能導致策略失效或表現不佳。
- 市場風險:在突發事件或極端行情下,策略可能遭受較大損失,尤其是在趨勢反轉或震盪市中。
- 過擬合:若在參數優化過程中過度擬合歷史數據,可能導致策略在實際交易中表現不佳。
優化方向
- 動態參數:根據市場狀況的變化動態調整策略參數,如在趨勢明顯時使用較長的EMA週期,在震盪市中使用較短的週期。
- 組合其他指標:引入其他技術指標(如布林帶、MACD等)來提高開倉信號的可靠性和準確性。
- 加入市場情緒:結合市場情緒指標(如恐懼貪婪指數)來調整策略的風險敞口和倉位管理。
- 多時間框架分析:在不同時間框架上分析市場趨勢和信號,以獲得更全面的市場視角和更穩健的交易決策。
總結
該策略通過結合多個常用技術指標,如EMA、RSI和ATR,構建了一個簡單有效的趨勢跟隨交易系統。它利用EMA通道來判斷市場趨勢,RSI來確認趨勢強度,並使用ATR來控制風險。策略的優勢在於其簡單性和適應性,能夠在不同市場條件下順應趨勢進行交易。然而,策略的表現在很大程度上取決於參數的選擇,不當的參數設置可能導致策略失效或表現不佳。此外,在突發事件或極端行情下,策略可能面臨較大風險。為了進一步優化策略,可以考慮引入動態參數調整、組合其他指標、加入市場情緒分析以及多時間框架分析等方法。總的來說,該策略為趨勢跟隨交易提供了一個良好的基礎,但仍需要根據實際市場情況進行調整和優化。
/*backtest
start: 2024-04-01 00:00:00
end: 2024-04-30 23:59:59
period: 1h
basePeriod: 15m
exchanges: [{"eid":"Futures_Binance","currency":"BTC_USDT"}]
*/

// This source code is subject to the terms of the Mozilla Public License 2.0 at https://mozilla.org/MPL/2.0/
// © hatnxkld

//@version=4
strategy("Win ha", overlay=true)

ss2 = input("0300-1700", title = "Khung thời gian")

t2 = time(timeframe.period,ss2)
c2 = #cacae6

bgcolor(t2 ? c2 : na, transp = 70)


//3ema
emangan=input(title="Ema ngắn", defval = 12)
ngan=ema(close, emangan)
a= plot(ngan, title="EMA ngắn", color=color.yellow)
ematb=input(title="Ema trung bình", defval = 100)
tb=ema(close, ematb)
b= plot(tb, title="EMA trung bình", color=color.blue)
//emadai=input(title="Ema dai", defval = 288)
//dai=ema(close,emadai)
//c= plot(dai, title="EMA dai", color=color.red)


// nhập hệ số nhân ATR
i=input(title="Hệ số nhân với ATR", defval=1.25)

// RSI
rsi=rsi(close, emangan)
marsi=sma(rsi, emangan)

// Kênh keltler
//heso=input(defval=1, title="Hệ số Kênh Keltler")
//atr=atr(emangan)
//tren=ngan+atr*heso
//d=plot(tren, title="Kênh trên", color=color.white)
//duoi=ngan-atr*heso
//e=plot(duoi, title="Kênh dưới", color=color.white)
//fill(d,e, color=color.rgb(48, 58, 53))

ban = ( close[1]>open[1] and (high[1]-close[1])>(close[1]-low[1]) and open>close and close<low[1]   )


//or (    open[1] > close[1] and (high[1]-open[1])>(open[1]-low[1]) and (open[1]-close[1])>(close[1]-low[1]) and open>close and close <low[1]     )   )  //and time(timeframe.period,"2200-1300")
//and (close[1]-open[1])>(open[1]-low[1])
//high > ngan and close < ngan and ngan<tb and
// and time(timeframe.period,"1000-2300")
bgcolor(color = ban ? color.rgb(235, 106, 123) : na)
//bgcolor(color.rgb(82, 255, 154),transp = 100, offset = 1, show_last = 2)
//and time(timeframe.period,"2300-1500") and ((open>ngan and close<ngan) or (open>tren and close<tren))
plotshape(ban , style=shape.arrowdown, location=location.abovebar, color=#ff00ff, size=size.tiny, textcolor=color.rgb(255, 59, 213))
alertcondition(ban, "Ban", "Ban")

mua=  (  open[1]>close[1] and (close[1]-low[1])>(high[1]-close[1]) and close > open and close > high[1]  )  //and time(timeframe.period,"2200-1300")


//or  (  close[1]>open[1] and (open[1]-low[1]) > (high[1]-open[1]) and (close[1]-open[1])>(high[1]-close[1]) and close>open and close>high[1]      ) )
//and (open[1]-close[1])>(high[1]-open[1])
//low < ngan and close > ngan and ngan>tb and
//or  (  close[1]>open[1] and (open[1]-low[1]) > (high[1]-open[1]) and (close[1]-open[1])>(high[1]-close[1]) and close>open and close>high[1]      )

// and time(timeframe.period,"1000-2300")
bgcolor(color= mua? color.rgb(108, 231, 139):na)
//and time(timeframe.period,"2300-1500") and ((open<ngan and close>ngan)or (open<duoi and close>duoi) )
plotshape(mua , style=shape.arrowup, location=location.belowbar, color=#00ff6a, size=size.tiny, textcolor=color.rgb(83, 253, 60))
alertcondition(mua , "Mua", "Mua")


//len1 = ban==true and (high-low)>2*atr
//plotshape(len1 , style=shape.flag, location=location.abovebar, color=#ff00ff, size=size.tiny, title="Sell Signal", text="Xuong 1", textcolor=color.rgb(255, 59, 213))

//bann= ban==true and rsi < marsi and marsi[2]>marsi[1]
//plotshape(bann , style=shape.labeldown, location=location.abovebar, color=#ff00ff, size=size.tiny, title="Sell Signal", text="BAN 2", textcolor=color.rgb(240, 234, 239))

//bannn = mua==true and rsi>marsi and marsi[2]<marsi[1]
//plotshape(bannn , style=shape.labelup, location=location.belowbar, color=#00ff6a, size=size.tiny, title="Buy Signal", text="Mua 2", textcolor=color.rgb(237, 241, 236))

//a1= ban==true and (high - low)<atr
//plotshape(a1 , style=shape.xcross, location=location.bottom, color=#00ff6a, size=size.tiny, title="Sell", text="<atr", textcolor=color.rgb(240, 95, 76))

//a2 = ban ==true and (high - low)>atr and (high - low)<(2*atr)
//plotshape(a2 , style=shape.xcross, location=location.bottom, color=#00ff6a, size=size.tiny, title="Sell", text="<2atr", textcolor=color.rgb(237, 241, 236))

//a3= ban==true and (high - low)>(2*atr)
//plotshape(a3 , style=shape.xcross, location=location.bottom, color=#00ff6a, size=size.tiny, title="Sell", text=">2atr", textcolor=color.rgb(234, 252, 74))


//b1= mua==true and (high - low)<atr
//plotshape(b1 , style=shape.xcross, location=location.bottom, color=#00ff6a, size=size.tiny, title="Buy", text="<atr", textcolor=color.rgb(237, 241, 236))

//b2 = mua ==true and (high - low)>atr and (high - low)<(2*atr)
//plotshape(b2 , style=shape.xcross, location=location.bottom, color=#00ff6a, size=size.tiny, title="Buy", text="<2atr", textcolor=color.rgb(237, 241, 236))

//b3= mua==true and (high - low)>(2*atr)
//plotshape(b3 , style=shape.xcross, location=location.bottom, color=#00ff6a, size=size.tiny, title="Buy", text=">2atr", textcolor=color.rgb(237, 241, 236))

// Đặt SL TP ENTRY
risk= input(title="Rủi ro % per Trade", defval=0.5)
rr= input(title="RR", defval=1.5)
onlylong= input(defval=false)
onlyshort=input(defval=false)

stlong = mua and strategy.position_size<=0 ? low[1]:na
stoplong= fixnan(stlong)

stshort = ban and strategy.position_size>=0 ? high[1]:na
stopshort= fixnan(stshort)

enlong = mua and strategy.position_size<=0 ? close:na
entrylong =fixnan(enlong)

enshort = ban and strategy.position_size>=0 ? close:na
entryshort = fixnan(enshort)

amountL = risk/100* strategy.initial_capital / (entrylong - stoplong)
amountS = risk/100* strategy.initial_capital / (stopshort - entryshort)

TPlong= mua and strategy.position_size<=0? entrylong + (entrylong -stoplong)*rr:na
takeprofitlong =fixnan(TPlong)
TPshort = ban and strategy.position_size>=0? entryshort - (stopshort - entryshort)*rr:na
takeprofitshort = fixnan(TPshort)

strategy.entry("Long", strategy.long , when = enlong and not onlyshort, qty= amountL )
strategy.exit("exitL", "Long", stop = stoplong, limit= takeprofitlong)

strategy.entry("Short", strategy.short , when = enshort and not onlylong, qty= amountS )
strategy.exit("exitS", "Short", stop = stopshort, limit= takeprofitshort)
相关内容
- 多重指标智能金字塔策略
- 黄金趋势通道反转突破动量策略
- EMA与RSI交叉策略
- ATR-RSI增强型趋势追踪交易系统
- RSI50_EMA长仓策略
- 4小时时间框架上的吞没形态交易策略与动态止盈止损优化
- 动态止损倍数多周期RSI趋势跟踪策略
- 基于EMA平滑RSI和ATR动态止盈止损的多时序量化交易策略
- 多时间框架融合型指数均线交叉策略
- AlphaTradingBot 交易策略
更多内容
- 8小时 ema
- RSI量化交易策略
- 布林带ATR趋势跟踪策略
- 基于斐波那契回调和成交量增量的交易策略
- RSI双重差分策略
- 加密货币大幅波动随机RSI策略
- 三重相对强弱指数量化交易策略
- 趋势跟踪与动量交易相结合的双重MACD优化策略
- 基于连续三根阴线和双均线的交易策略
- DZ交易时段突破策略
- 200均线、VWAP、MFI趋势跟踪策略
- EMA交叉策略与RSI背离,30分钟趋势识别和价格竭尽
- 无上引线看涨K线突破策略
- 相对强弱指数均值回归策略
- BMSB 布林麦克超级趋势交易策略
- EMA双均线固定风险止损止盈
- SMA双均线交易策略
- 基于布林带、移动平均线和相对强弱指数的短线交易策略
- 基于双移动平均线交叉策略
- EMA、MACD、RSI三重指标动量策略