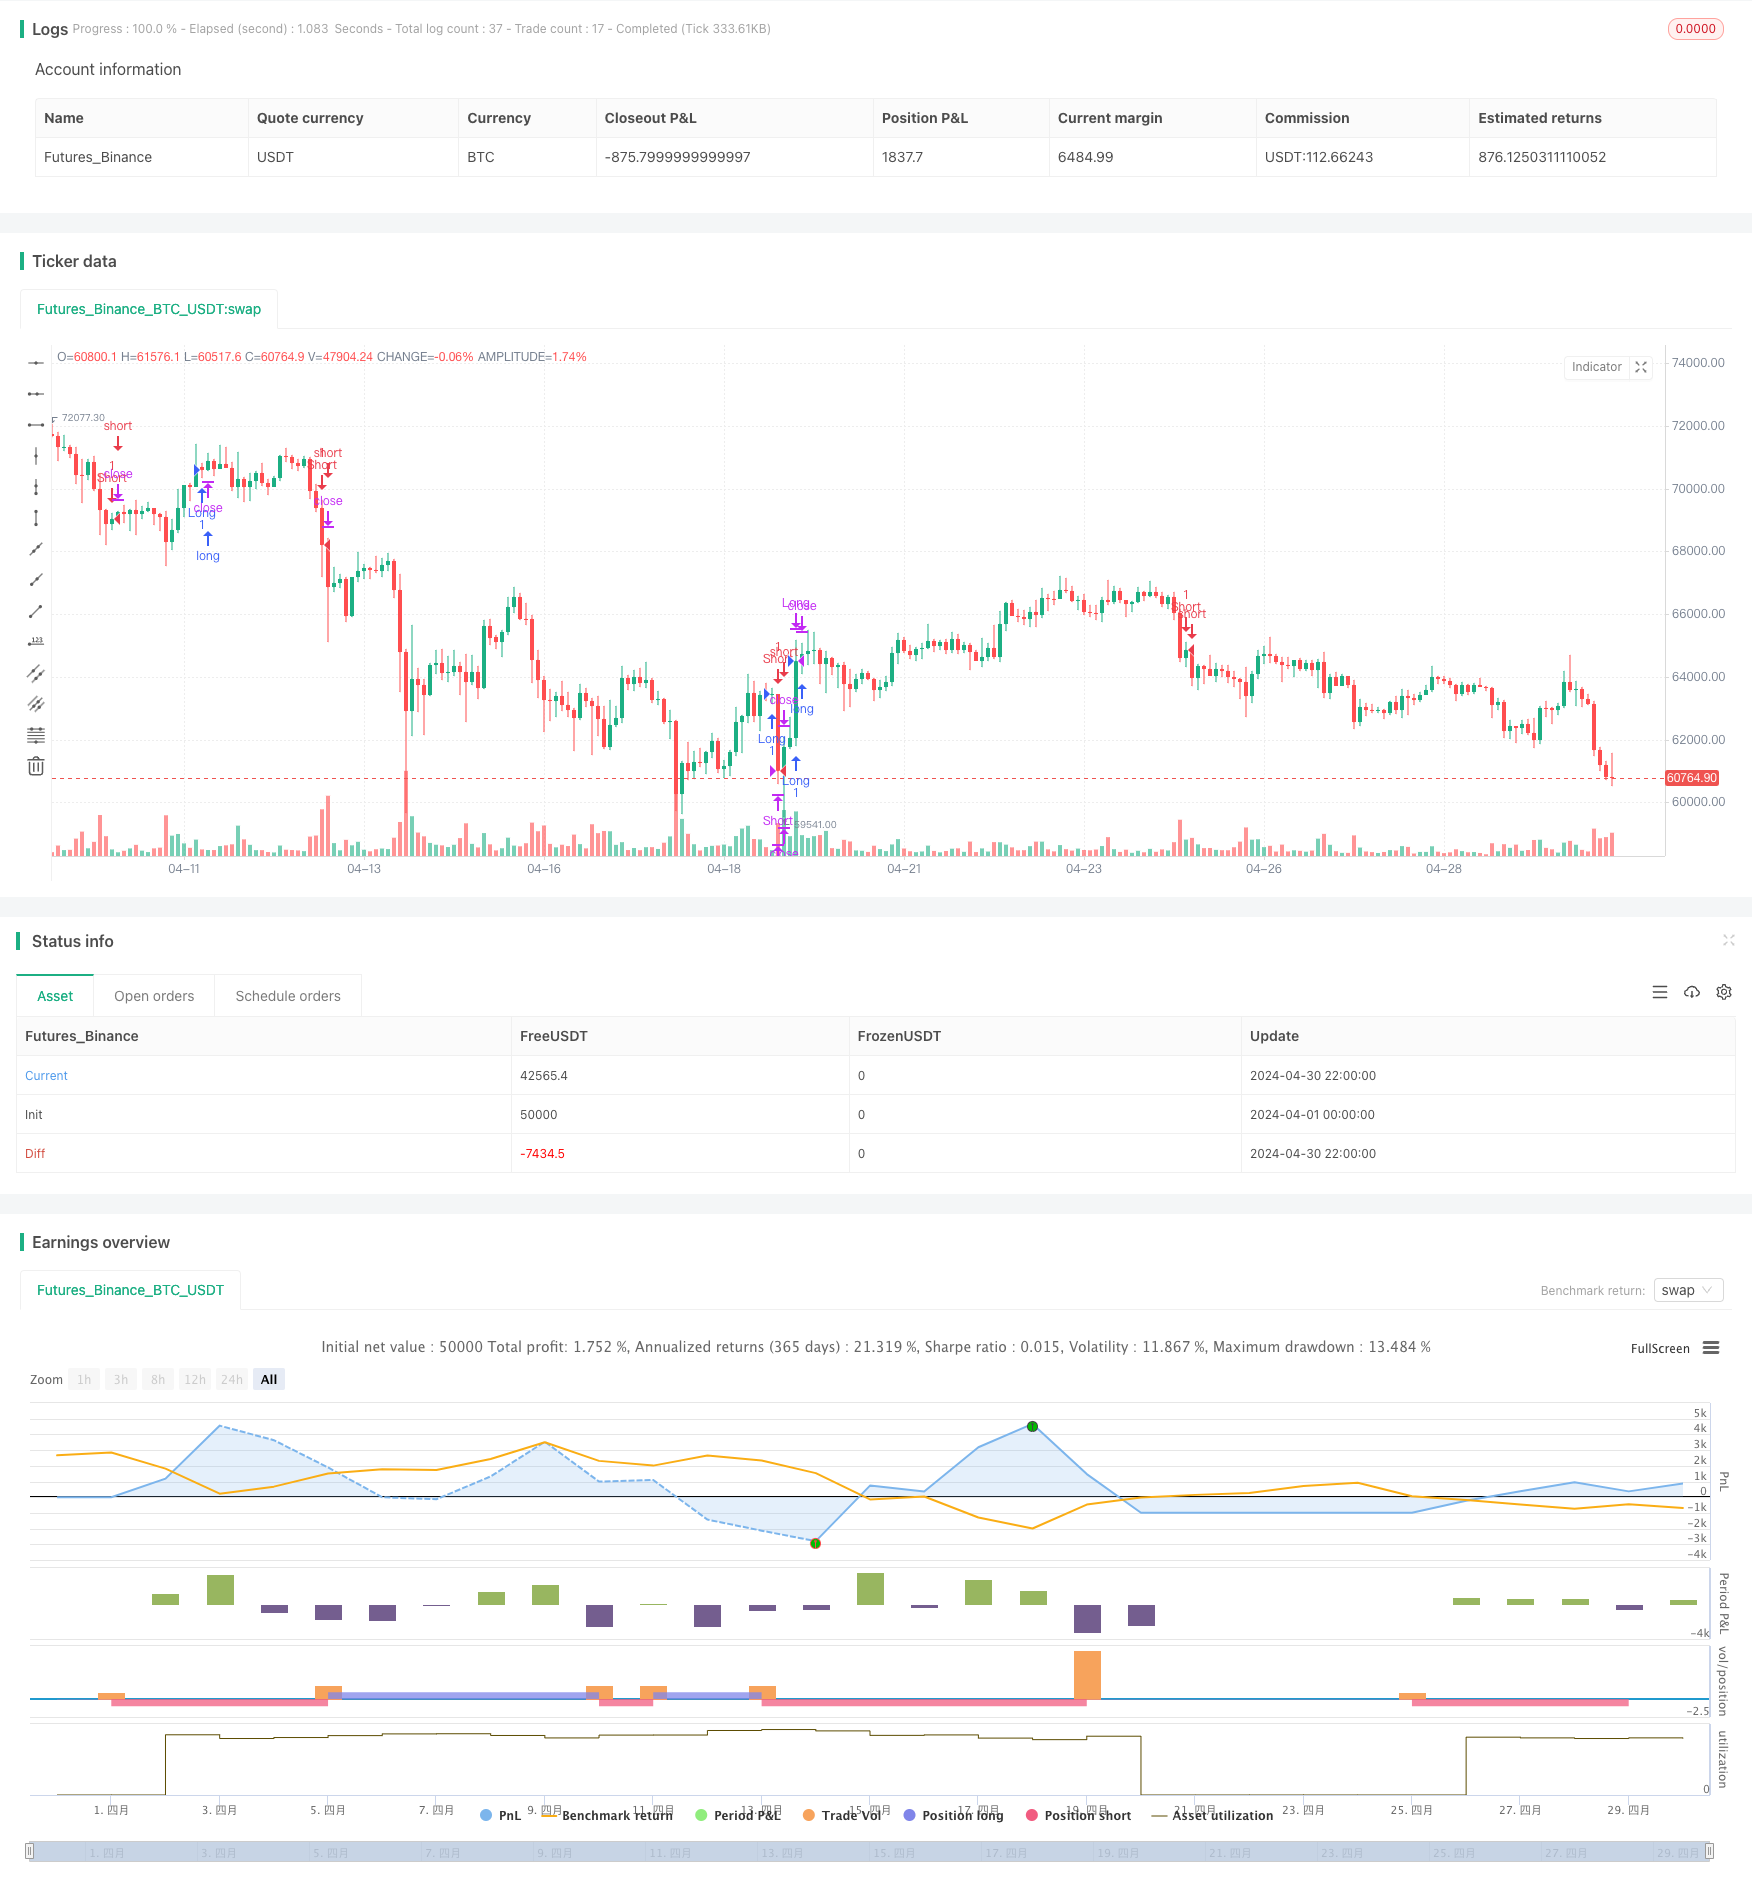
EMA交叉策略与RSI背离,30分钟趋势识别和价格竭尽
Author: ChaoZhang, Date: 2024-05-14 16:23:48Tags: EMARSI

概述
该策略结合了EMA交叉、RSI背离、30分钟趋势识别和价格竭尽等技术指标,旨在捕捉市场趋势和价格拐点。策略通过EMA13和EMA26的交叉来确定趋势方向,利用RSI背离来识别潜在的趋势反转,同时考虑30分钟时间框架内的趋势状态和价格竭尽情况,以优化进场点位。
策略原理
- EMA交叉:当EMA13上穿EMA26时产生买入信号,下穿时产生卖出信号。
- RSI背离:当价格创新低而RSI未创新低时,产生看涨背离;当价格创新高而RSI未创新高时,产生看跌背离。
- 30分钟趋势识别:通过比较收盘价与30分钟EMA5和EMA10的关系,判断当前30分钟时间框架内的趋势状态。
- 价格竭尽:利用RSI指标识别价格的超买和超卖状态。
- 交易信号:综合以上因素,在EMA交叉、RSI背离、30分钟上升趋势且价格超卖时产生买入信号;在EMA交叉、RSI背离、30分钟下降趋势且价格超买时产生卖出信号。
策略优势
- 多维度分析:结合趋势、动量和价格竭尽等多个维度,提高信号准确性。
- 趋势确认:通过30分钟时间框架内的趋势判断,避免在震荡市中频繁交易。
- 拐点捕捉:利用RSI背离和价格竭尽,捕捉潜在的趋势反转点。
- 风险控制:在趋势确认和拐点信号出现后再进行交易,降低风险。
策略风险
- 参数优化:策略中使用的EMA周期、RSI周期等参数可能需要根据不同市场和资产进行优化。
- 趋势转换:在趋势转换初期,EMA交叉和RSI背离信号可能会出现延迟或误导。
- 假信号:某些情况下,RSI背离可能产生假信号,导致错误交易。
- 突发事件:策略可能无法应对市场中的突发事件和非理性波动。
策略优化方向
- 动态参数优化:根据市场状态和波动率,动态调整EMA和RSI周期等参数。
- 趋势强度过滤:引入ADX等趋势强度指标,过滤弱趋势或震荡市中的信号。
- 多时间框架确认:结合多个时间框架的趋势和信号,提高信号可靠性。
- 止损和止盈:引入合适的止损和止盈策略,进一步控制风险和优化收益。
总结
该策略通过结合EMA交叉、RSI背离、30分钟趋势识别和价格竭尽等技术指标,在多个维度上分析市场,以捕捉趋势和潜在的拐点。策略优势在于多维度分析、趋势确认、拐点捕捉和风险控制,但同时也存在参数优化、趋势转换、假信号和突发事件等风险。未来可以通过动态参数优化、趋势强度过滤、多时间框架确认以及止损和止盈等方面对策略进行优化,以进一步提高策略的稳健性和盈利能力。
/*backtest
start: 2024-04-01 00:00:00
end: 2024-04-30 23:59:59
period: 2h
basePeriod: 15m
exchanges: [{"eid":"Futures_Binance","currency":"BTC_USDT"}]
*/

//@version=5
strategy("EMA Cross Strategy with RSI Divergence, 30-Minute Trend Identification, and Price Exhaustion", overlay=true)

// Definição das médias móveis exponenciais para tendência de curto prazo (30 minutos)
EMA5_30min = ta.ema(close, 5)
EMA10_30min = ta.ema(close, 10)

// Definição das médias móveis exponenciais
EMA13 = ta.ema(close, 13)
EMA26 = ta.ema(close, 26)

// RSI com período padrão de 7
rsi = ta.rsi(close, 7)

// Detecção do cruzamento das EMAs
crossUp = ta.crossover(EMA13, EMA26)
crossDown = ta.crossunder(EMA13, EMA26)

// Detecção de divergência no RSI
bullishDivergence = ta.crossunder(close, EMA13) and ta.crossunder(rsi, 30)
bearishDivergence = ta.crossover(close, EMA13) and ta.crossover(rsi, 70)

// Geração de sinais de entrada
entrySignal = crossUp ? 1 : (crossDown ? -1 : 0)

// Abertura da posição
if (entrySignal == 1)
    strategy.entry("Long", strategy.long)
else if (entrySignal == -1)
    strategy.entry("Short", strategy.short)

// Fechamento da posição
if (entrySignal == 1 and ta.crossover(close, EMA26))
    strategy.close("Long")
else if (entrySignal == -1 and ta.crossunder(close, EMA26))
    strategy.close("Short")

// Comando de compra e venda
buySignal = crossUp and close > EMA13 and close > EMA26
sellSignal = crossDown and close < EMA13 and close < EMA26

// Aplicando a lógica de divergência RSI
if (bullishDivergence)
    strategy.entry("Bullish Divergence", strategy.long)
if (bearishDivergence)
    strategy.entry("Bearish Divergence", strategy.short)

// Identificação de tendência nos últimos 30 minutos
isUptrend30min = close > EMA5_30min and close > EMA10_30min
isDowntrend30min = close < EMA5_30min and close < EMA10_30min

// Identificação de exaustão do preço com base no RSI
isOversold = rsi < 30
isOverbought = rsi > 70

// Executando os sinais de compra e venda
if (buySignal and isUptrend30min and isOversold)
    strategy.entry("Buy", strategy.long)
if (sellSignal and isDowntrend30min and isOverbought)
    strategy.entry("Sell", strategy.short)
相关内容
- Low finder
- 动态均线趋势跟踪与相对强弱指标确认交易策略
- RSI与双EMA交叉信号量化策略
- EMA多头均线交叉策略
- 多周期RSI动量与三重EMA趋势跟踪复合策略
- 双均线RSI趋势发散策略:基于指数移动平均和相对强弱的趋势捕捉系统
- RSI与EMA结合的动态多周期量化交易策略
- crypto futures hourly scalping with ma & rsi - ogcheckers
- 均线交叉、相对强弱指标、成交量价格趋势、吞没形态策略
- 双指数移动平均线与相对强弱指数交叉策略
- 双均线RSI趋势反转交易策略 - 基于EMA和RSI的动量突破系统
更多内容
- 布林带ATR趋势跟踪策略
- 基于斐波那契回调和成交量增量的交易策略
- RSI双重差分策略
- 加密货币大幅波动随机RSI策略
- 三重相对强弱指数量化交易策略
- 趋势跟踪与动量交易相结合的双重MACD优化策略
- 基于连续三根阴线和双均线的交易策略
- DZ交易时段突破策略
- 漢越-基於多EMA、ATR和RSI的趨勢順勢交易策略
- 200均线、VWAP、MFI趋势跟踪策略
- 无上引线看涨K线突破策略
- 相对强弱指数均值回归策略
- BMSB 布林麦克超级趋势交易策略
- EMA双均线固定风险止损止盈
- SMA双均线交易策略
- 基于布林带、移动平均线和相对强弱指数的短线交易策略
- 基于双移动平均线交叉策略
- EMA、MACD、RSI三重指标动量策略
- 多时间框架逆转确认交易策略
- 拉里·威廉姆斯三周期动态均线交易策略