概述
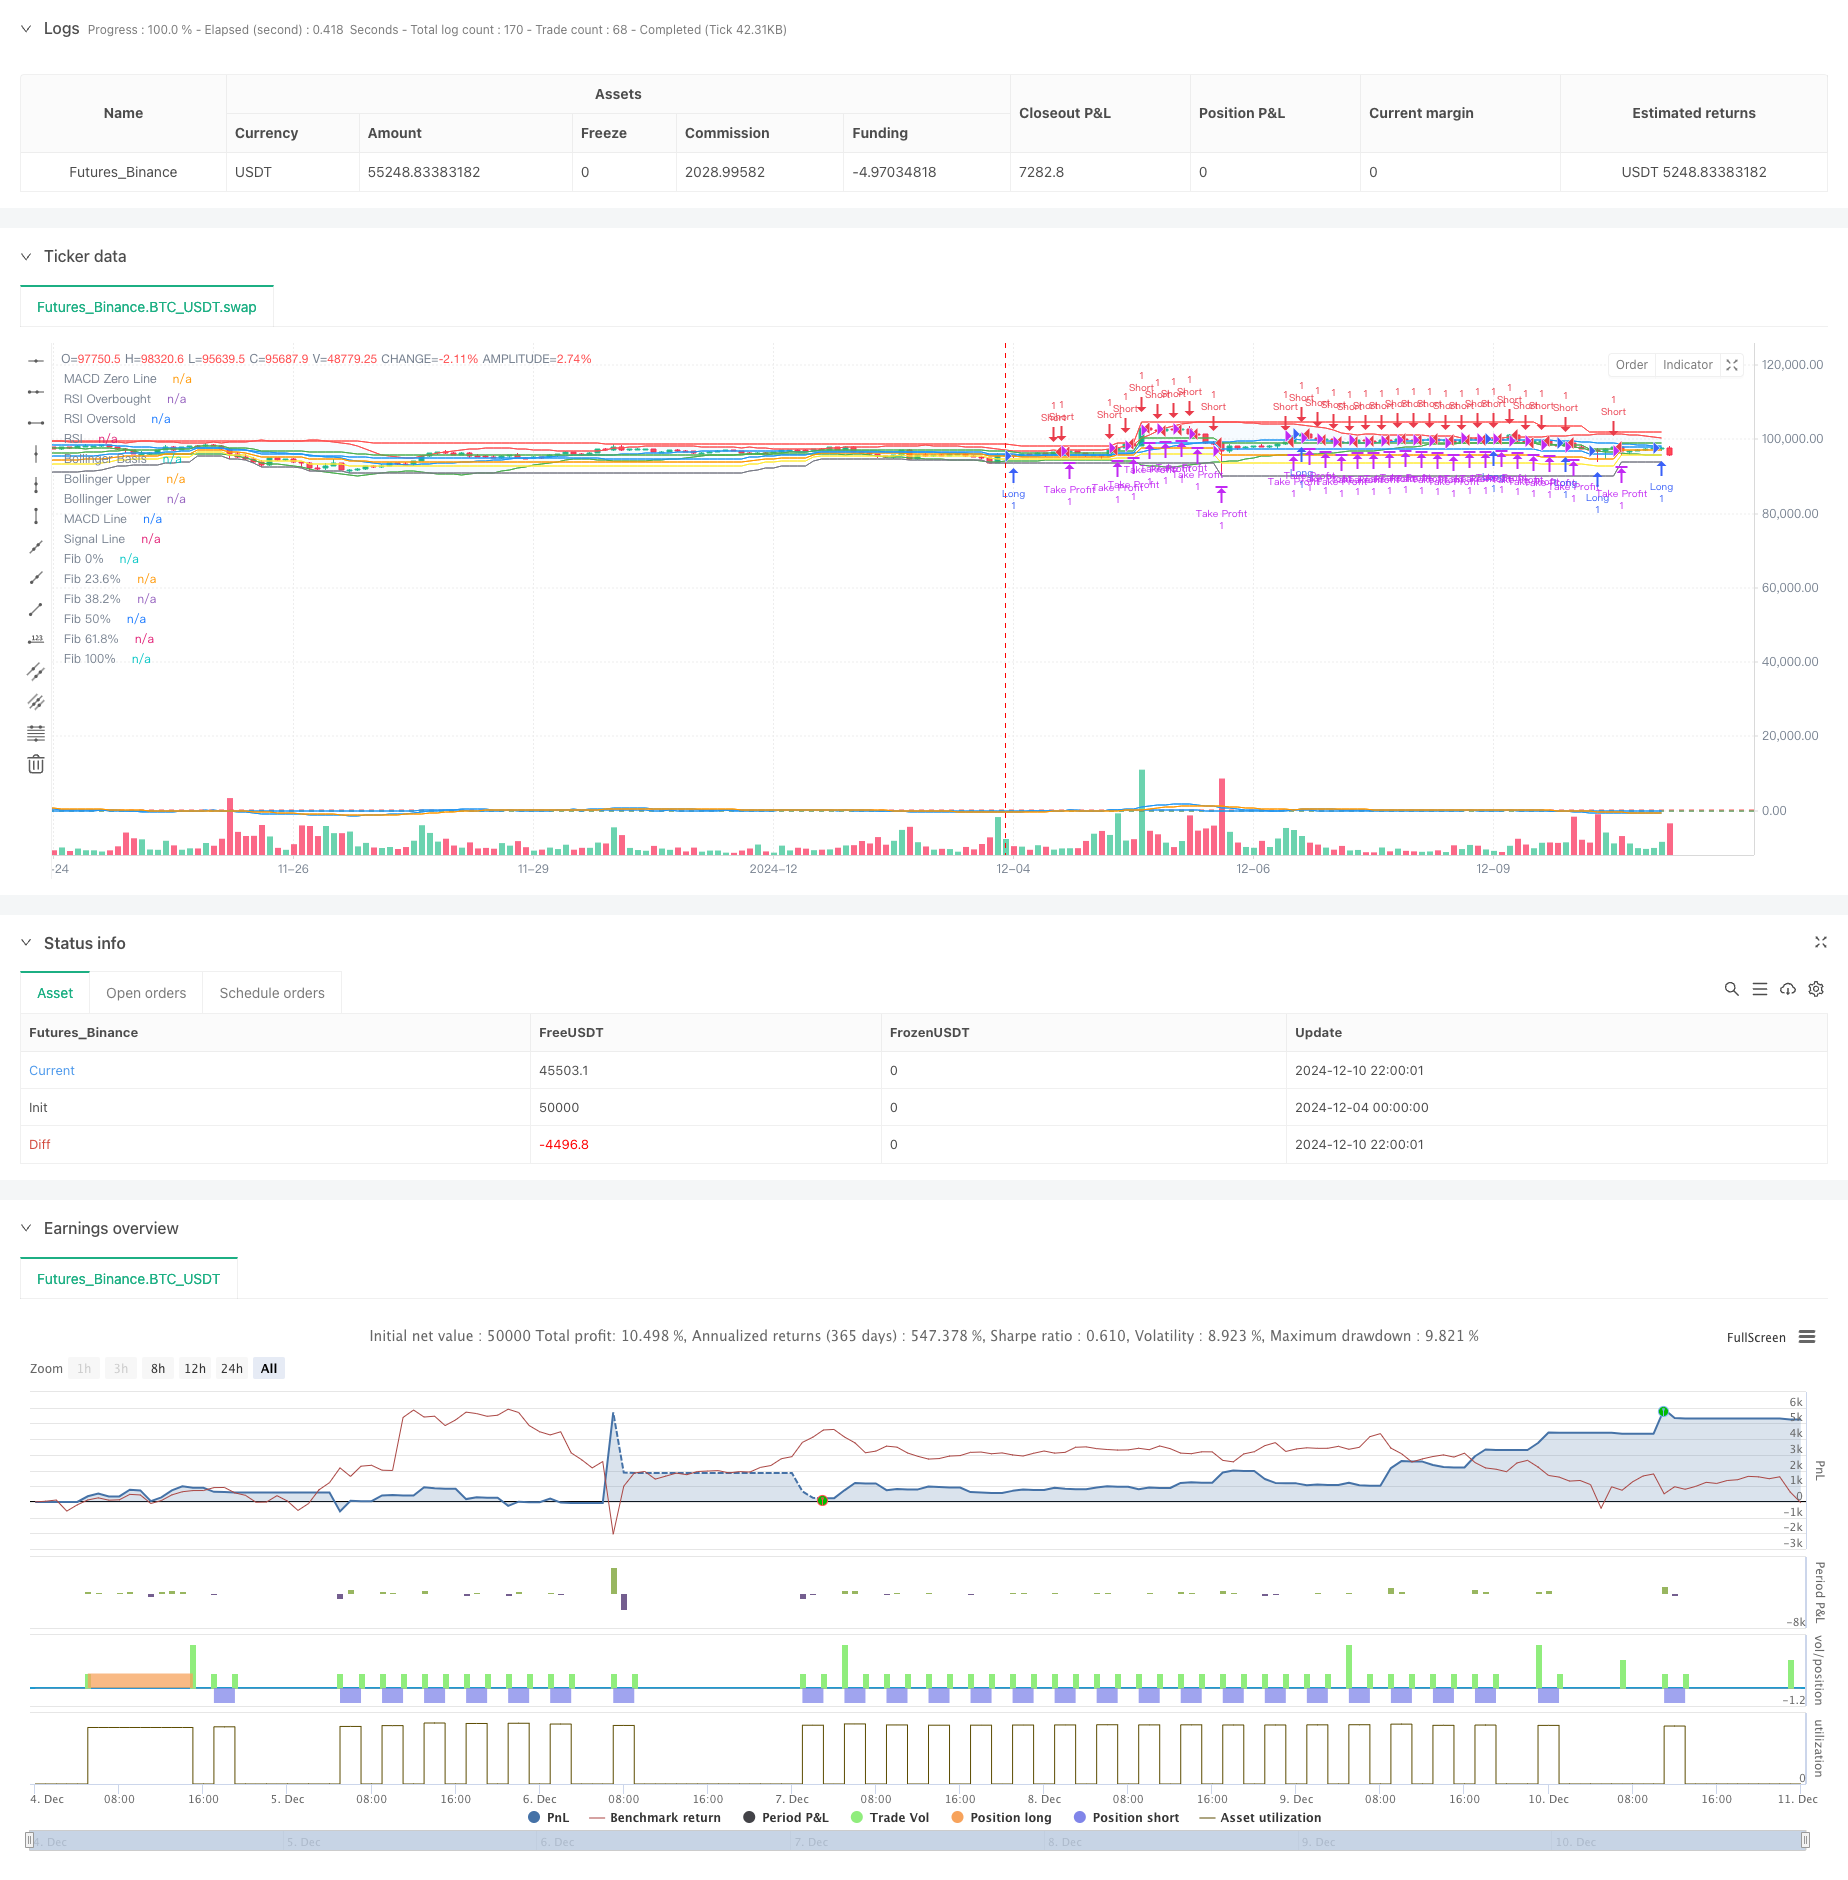
该策略是一个结合了布林带、斐波那契回撤、MACD和RSI等多个技术指标的综合交易系统。策略通过多指标协同配合,在不同市场条件下捕捉交易机会,并应用最大利润止盈方法进行风险控制。系统采用模块化设计,各指标参数可灵活调整,具有较强的适应性和实用性。
策略原理
策略运用四个主要技术指标生成交易信号: 1. 布林带信号:价格突破下轨产生做多信号,突破上轨产生做空信号 2. 斐波那契信号:价格处于0-23.6%区间产生做多信号,处于61.8-100%区间产生做空信号 3. MACD信号:MACD线上穿信号线产生做多信号,下穿产生做空信号 4. RSI信号:RSI低于超卖线产生做多信号,高于超买线产生做空信号 当任一指标产生信号时,系统即开始交易。同时,策略应用最大利润止盈方法,在达到预设盈利目标或触发止损时自动平仓。
策略优势
- 多指标协同:通过整合多个技术指标,提高信号可靠性
- 灵活性强:各指标参数可根据不同市场环境灵活调整
- 风险控制完善:采用最大利润止盈和固定止损相结合的方式
- 自适应性好:策略可适应不同市场周期和波动条件
- 执行效率高:代码结构清晰,运算负荷适中
策略风险
- 信号重叠:多个指标同时产生信号可能导致过度交易
- 参数敏感:不同参数组合可能产生显著不同的效果
- 市场适应性:在某些市场条件下可能表现不佳
- 滑点影响:高频交易可能受到滑点影响
- 资金管理:需要合理设置仓位以控制风险
策略优化方向
- 信号权重:可为不同指标设置权重,提高信号质量
- 市场环境识别:添加市场环境识别模块,根据不同市场调整策略
- 动态参数:引入自适应参数调整机制
- 交易成本:优化交易频率以减少成本
- 信号过滤:增加额外的过滤条件减少误信号
总结
该策略通过多指标协同配合,在保证策略稳定性的同时提高了交易效率。虽然存在一定风险,但通过合理的风险控制和持续优化,策略具有较好的实用价值。建议在实盘交易前进行充分的回测和参数优化。
策略源码
/*backtest
start: 2024-12-04 00:00:00
end: 2024-12-11 00:00:00
period: 2h
basePeriod: 2h
exchanges: [{"eid":"Futures_Binance","currency":"BTC_USDT"}]
*/

//@version=5
strategy("Demo GPT Bollinger, Fibonacci, MACD & RSI with Max Profit Exit", overlay=true)

// === User Inputs for Bollinger Bands ===
length_bb = input.int(20, minval=1, title="Bollinger Bands Length")
maType_bb = input.string("SMA", title="Bollinger Bands MA Type", options=["SMA", "EMA", "SMMA (RMA)", "WMA", "VWMA"])
src_bb = input(close, title="Bollinger Bands Source")
mult_bb = input.float(2.0, minval=0.001, maxval=50, title="Bollinger Bands StdDev")
offset_bb = input.int(0, title="Bollinger Bands Offset", minval=-500, maxval=500)

// === User Inputs for Fibonacci Levels ===
lookback_fib = input.int(50, minval=1, title="Fibonacci Lookback Period")

// === User Inputs for MACD ===
macd_fast = input.int(12, minval=1, title="MACD Fast Length")
macd_slow = input.int(26, minval=1, title="MACD Slow Length")
macd_signal = input.int(9, minval=1, title="MACD Signal Length")

// === User Inputs for RSI ===
rsi_length = input.int(14, title="RSI Length")
rsi_overbought = input.int(70, title="RSI Overbought Level")
rsi_oversold = input.int(30, title="RSI Oversold Level")

// === Start and End Date Inputs ===
start_date = input(timestamp("2023-01-01 00:00:00"), title="Start Date")
end_date = input(timestamp("2069-12-31 23:59:59"), title="End Date")

// === Moving Average Function ===
ma(source, length, _type) =>
    switch _type
        "SMA" => ta.sma(source, length)
        "EMA" => ta.ema(source, length)
        "SMMA (RMA)" => ta.rma(source, length)
        "WMA" => ta.wma(source, length)
        "VWMA" => ta.vwma(source, length)

// === Bollinger Bands Calculation ===
basis_bb = ma(src_bb, length_bb, maType_bb)
dev_bb = mult_bb * ta.stdev(src_bb, length_bb)
upper_bb = basis_bb + dev_bb
lower_bb = basis_bb - dev_bb

// === Fibonacci Levels Calculation ===
highest_price = ta.highest(high, lookback_fib)
lowest_price = ta.lowest(low, lookback_fib)

fib_0 = lowest_price
fib_23 = lowest_price + 0.236 * (highest_price - lowest_price)
fib_38 = lowest_price + 0.382 * (highest_price - lowest_price)
fib_50 = lowest_price + 0.5 * (highest_price - lowest_price)
fib_61 = lowest_price + 0.618 * (highest_price - lowest_price)
fib_100 = highest_price

// === MACD Calculation ===
[macd_line, signal_line, _] = ta.macd(close, macd_fast, macd_slow, macd_signal)

// === RSI Calculation ===
rsi = ta.rsi(close, rsi_length)

// === Plotting for Reference ===
plot(basis_bb, "Bollinger Basis", color=color.blue, offset=offset_bb)
p1_bb = plot(upper_bb, "Bollinger Upper", color=color.red, offset=offset_bb)
p2_bb = plot(lower_bb, "Bollinger Lower", color=color.green, offset=offset_bb)
fill(p1_bb, p2_bb, title="Bollinger Bands Background", color=color.rgb(33, 150, 243, 95))

plot(fib_0, "Fib 0%", color=color.gray)
plot(fib_23, "Fib 23.6%", color=color.yellow)
plot(fib_38, "Fib 38.2%", color=color.orange)
plot(fib_50, "Fib 50%", color=color.blue)
plot(fib_61, "Fib 61.8%", color=color.green)
plot(fib_100, "Fib 100%", color=color.red)

hline(0, "MACD Zero Line", color=color.gray)
plot(macd_line, "MACD Line", color=color.blue)
plot(signal_line, "Signal Line", color=color.orange)

hline(rsi_overbought, "RSI Overbought", color=color.red)
hline(rsi_oversold, "RSI Oversold", color=color.green)
plot(rsi, "RSI", color=color.blue)

// === Combined Trading Logic ===
// Bollinger Bands Signals
long_bb = ta.crossover(close, lower_bb)
short_bb = ta.crossunder(close, upper_bb)

// Fibonacci Signals
long_fib = close <= fib_23 and close >= fib_0
short_fib = close >= fib_61 and close <= fib_100

// MACD Signals
long_macd = ta.crossover(macd_line, signal_line)
short_macd = ta.crossunder(macd_line, signal_line)

// RSI Signals
long_rsi = rsi < rsi_oversold
short_rsi = rsi > rsi_overbought

// Combined Long and Short Conditions
long_condition = (long_bb or long_fib or long_macd or long_rsi)
short_condition = (short_bb or short_fib or short_macd or short_rsi)
// === Max Profit Exit Logic ===
// Define the maximum profit exit percentage
take_profit_percentage = input.float(5.0, title="Take Profit (%)", minval=0.1, maxval=100) / 100
stop_loss_percentage = input.float(2.0, title="Stop Loss (%)", minval=0.1, maxval=100) / 100

// Track the highest price during the trade
var float max_profit_price = na
if (strategy.opentrades > 0)
    max_profit_price := na(max_profit_price) ? strategy.opentrades.entry_price(0) : math.max(max_profit_price, high)

// Calculate the take profit and stop loss levels based on the max profit price
take_profit_level = max_profit_price * (1 + take_profit_percentage)
stop_loss_level = max_profit_price * (1 - stop_loss_percentage)

// Exit the trade if the take profit or stop loss level is hit
if (strategy.opentrades > 0)
    if (close >= take_profit_level)
        strategy.exit("Take Profit", from_entry="Long", limit=take_profit_level)
    if (close <= stop_loss_level)
        strategy.exit("Stop Loss", from_entry="Long", stop=stop_loss_level)

if (strategy.opentrades > 0)
    if (close <= take_profit_level)
        strategy.exit("Take Profit", from_entry="Short", limit=take_profit_level)
    if (close >= stop_loss_level)
        strategy.exit("Stop Loss", from_entry="Short", stop=stop_loss_level)

// === Execute Trades ===
if (long_condition)
    strategy.entry("Long", strategy.long, when=not na(long_condition))

if (short_condition)
    strategy.entry("Short", strategy.short, when=not na(short_condition))
相关推荐