概述
这个量化交易策略结合了CCI (商品通道指标)或动量指标、RSI (相对强弱指标)和背离分析,旨在捕捉市场趋势的转折点。该策略主要利用CCI或动量指标的零线交叉信号,结合RSI的超买超卖水平和潜在的背离模式来生成交易信号。这种多指标融合的方法旨在提高交易的准确性和可靠性,同时通过考虑多个市场因素来减少假信号。
策略原理
信号源选择:策略允许用户选择CCI或动量指标作为主要的信号源。这种灵活性使交易者能够根据个人偏好或特定市场条件调整策略。
交叉信号:策略使用所选指标(CCI或动量)与零线的交叉来识别潜在的趋势变化。向上交叉被视为看涨信号,向下交叉被视为看跌信号。
RSI过滤:策略整合了RSI指标来确定市场是否处于超买或超卖状态。这有助于确认潜在的反转点,增加交易信号的可靠性。
背离分析:策略可选择性地考虑RSI的常规背离。bullish背离(价格低点上升而RSI低点下降)被用作额外的看涨确认,而bearish背离则用作看跌确认。
入场条件:
- 做多:当选定的指标向上穿越零线,RSI处于超卖区域,且(如果启用)出现bullish背离时。
- 做空:当选定的指标向下穿越零线,RSI处于超买区域,且(如果启用)出现bearish背离时。
可视化:策略在图表上绘制买入和卖出信号,便于快速识别交易机会。
警报:策略设置了条件触发警报,当生成买入或卖出信号时通知交易者。
策略优势
多指标融合:通过结合CCI/动量、RSI和背离分析,策略提供了一个全面的市场视角,有助于减少假信号并提高交易准确性。
灵活性:允许用户选择CCI或动量作为主要信号源,使策略能够适应不同的市场环境和交易风格。
趋势识别:利用零线交叉信号有效捕捉潜在的趋势变化,助力交易者及时进场。
过滤机制:使用RSI的超买超卖水平作为过滤器,有助于避免在极端市场条件下的不利交易。
背离确认:可选的背离分析为交易信号提供了额外的确认,增强了策略的可靠性。
可视化和警报:通过图表上的信号标记和警报功能,交易者可以轻松识别和跟踪交易机会。
参数化:策略的关键参数(如指标长度、RSI阈值等)都是可调整的,允许交易者根据具体需求进行优化。
策略风险
假信号风险:尽管策略采用了多重确认机制,但在剧烈波动的市场中仍可能产生假信号,导致不必要的交易。
滞后性:所使用的指标都具有一定的滞后性,可能导致在快速变化的市场中错过一些交易机会或延迟入场。
过度依赖技术指标:策略完全基于技术指标,忽视了基本面因素,这在某些市场情况下可能导致误判。
参数敏感性:策略的性能可能对参数设置高度敏感,不当的参数选择可能导致策略表现不佳。
市场条件变化:在某些市场条件下(如长期横盘或极端波动),策略可能表现不佳。
过度交易:在某些市场条件下,策略可能生成过多的交易信号,增加交易成本并可能导致过度交易。
背离识别的主观性:背离的识别可能存在一定的主观性,不同的交易者可能对同一市场情况有不同的解读。
策略优化方向
动态参数调整:实现参数的动态调整机制,使策略能够自适应不同的市场条件。例如,根据市场波动性自动调整RSI的超买超卖阈值。
增加趋势过滤器:引入额外的趋势指标(如移动平均线)来确认整体市场趋势,只在趋势方向上开仓,以减少逆势交易。
整合成交量分析:将成交量指标纳入策略,用于确认价格走势的有效性,提高信号质量。
优化入场时机:在当前信号基础上,增加更精细的入场规则,如等待回调后再入场,以获得更好的价格。
实现动态止损/止盈:根据市场波动性或关键支撑阻力位设置动态的止损止盈水平,改善风险管理。
时间过滤:加入时间过滤器,避开波动性较大或流动性较低的时段,如市场开盘和收盘前后。
多时间框架分析:整合多个时间框架的分析,以提高交易信号的可靠性和降低虚假信号的风险。
机器学习优化:利用机器学习算法优化参数选择和信号生成过程,提高策略的适应性和性能。
总结
CCI动量背离趋势交易策略是一个综合性的技术分析方法,它巧妙地结合了多个技术指标来捕捉市场趋势的转折点。通过融合CCI或动量指标的零线交叉信号、RSI的超买超卖水平以及可选的背离分析,该策略为交易者提供了一个全面的市场视角。
策略的主要优势在于其多层次的信号确认机制,这有助于提高交易的准确性和可靠性。同时,策略的灵活性允许交易者根据个人偏好和市场条件进行调整。然而,像所有技术分析策略一样,它也面临着假信号、滞后性和市场条件变化等风险。
为了进一步提高策略的稳健性和适应性,建议考虑实施动态参数调整、增加趋势过滤器、整合成交量分析等优化方向。这些改进可以帮助策略更好地应对不同的市场环境,减少假信号,并提高整体性能。
总的来说,这个策略为交易者提供了一个有潜力的框架,可以通过持续的优化和个性化调整,成为一个有效的交易工具。然而,使用者仍需谨慎,进行充分的回测和实盘验证,并始终牢记风险管理的重要性。
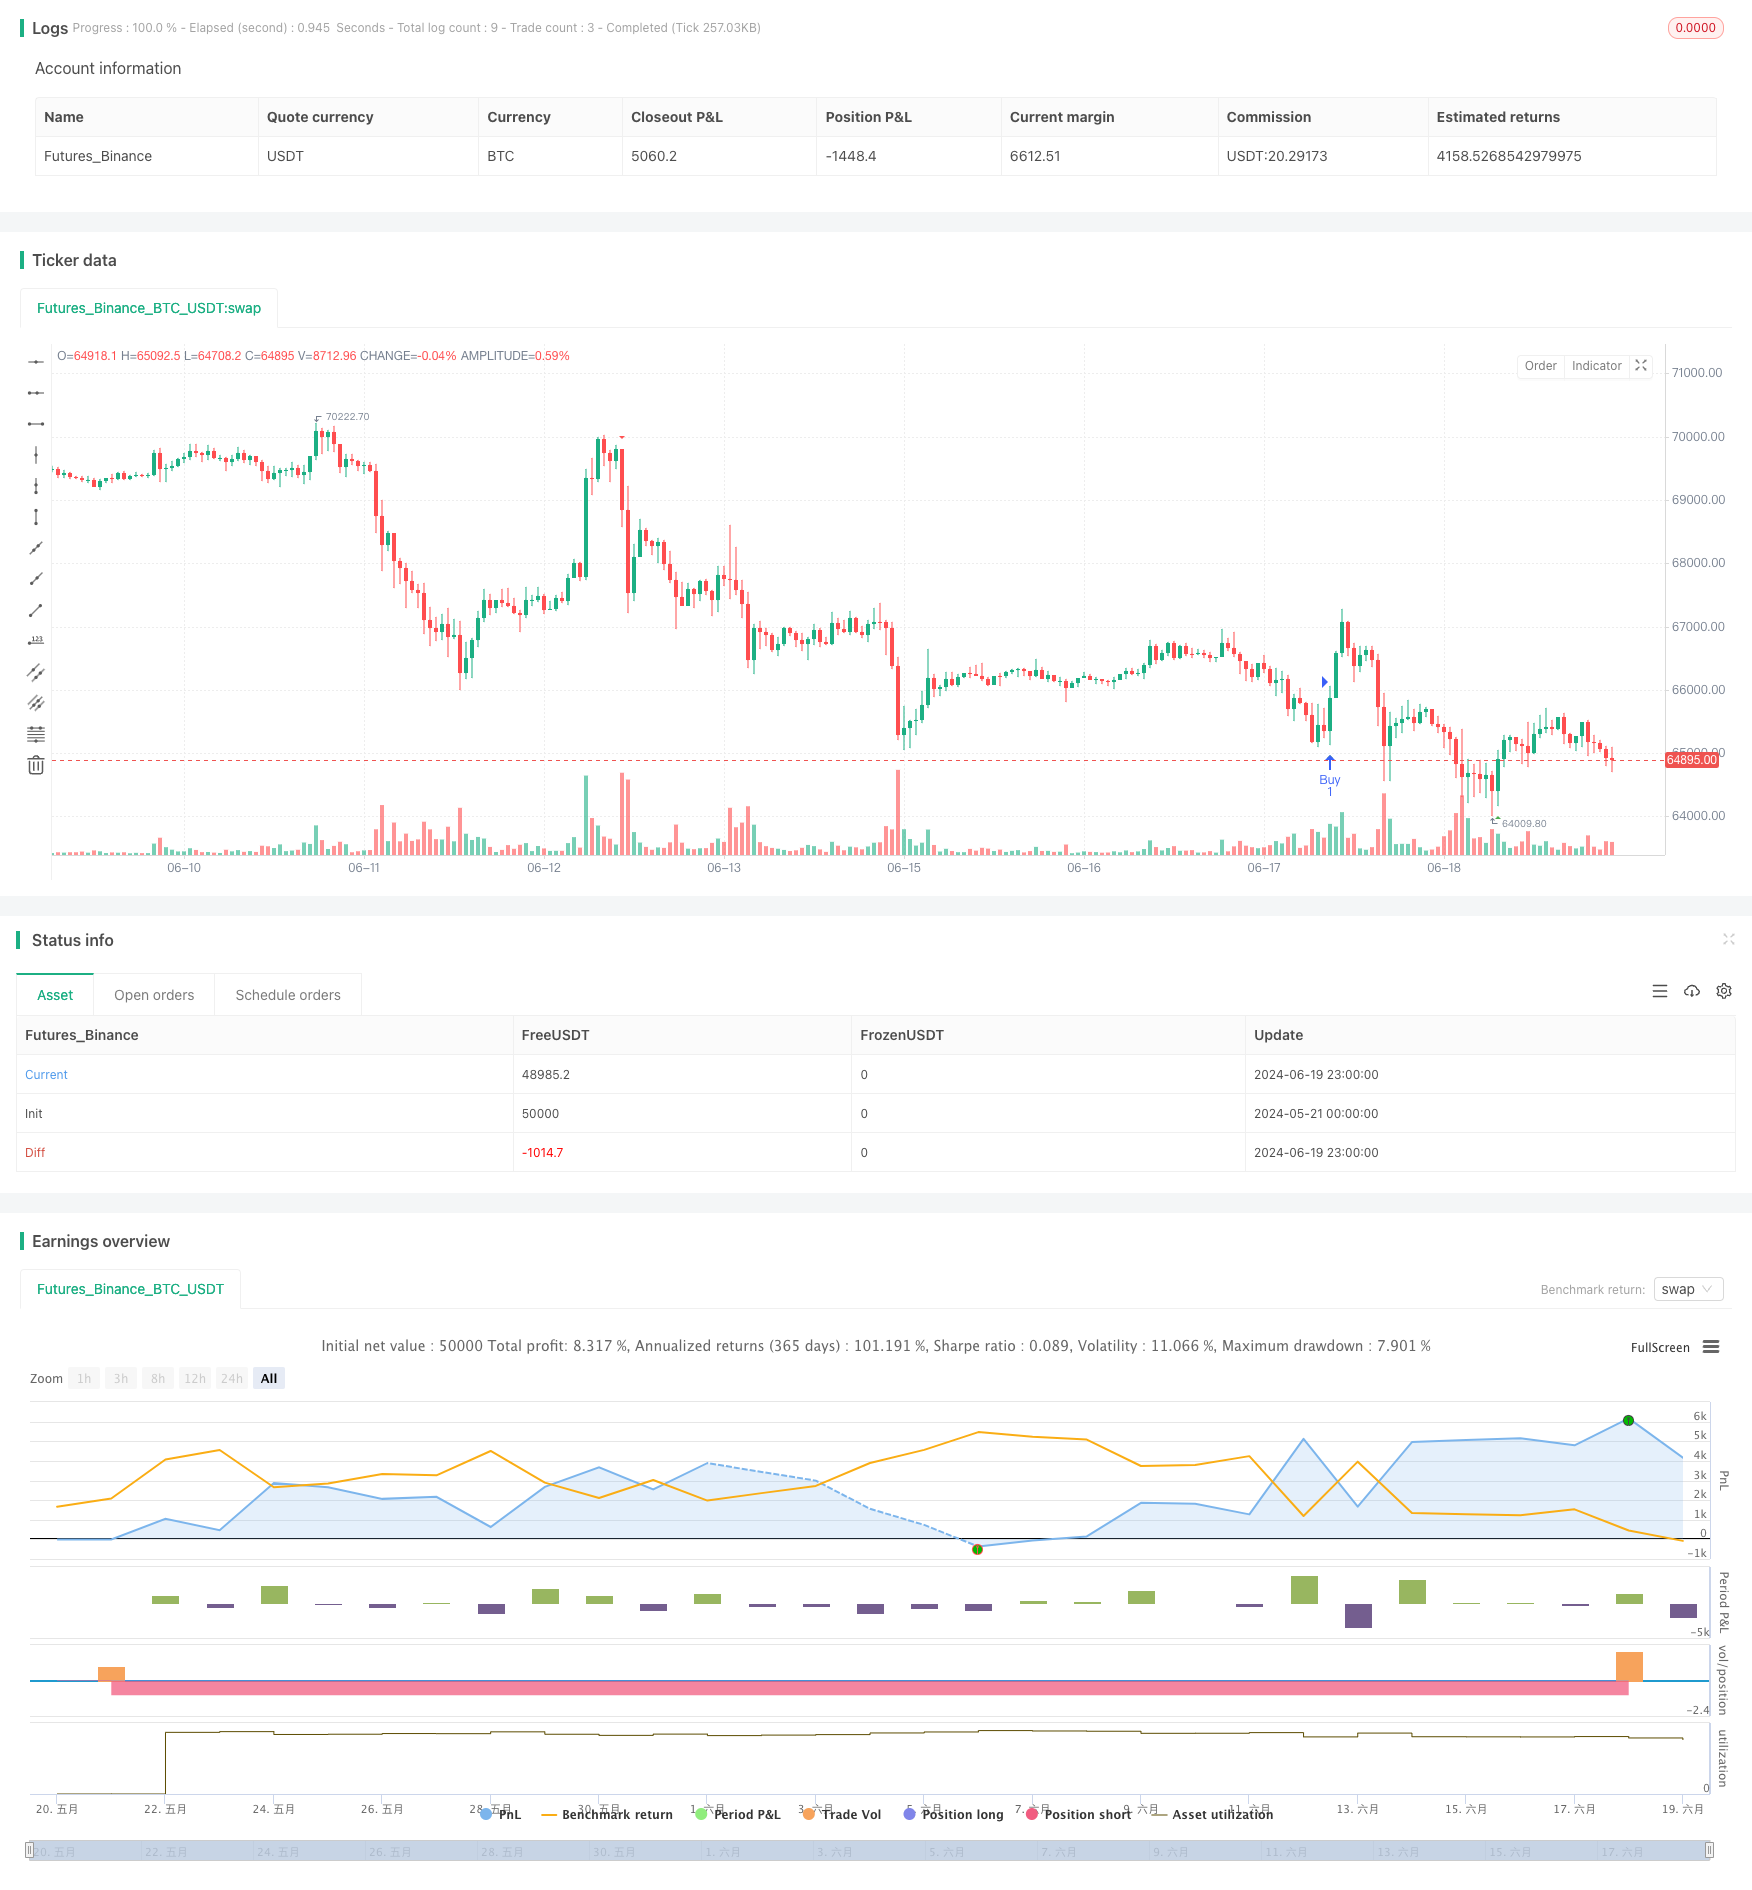
/*backtest
start: 2024-05-21 00:00:00
end: 2024-06-20 00:00:00
period: 1h
basePeriod: 15m
exchanges: [{"eid":"Futures_Binance","currency":"BTC_USDT"}]
*/

//@version=5
strategy("bayush", overlay=true)

// Input settings
entrySignalSource = input.string("CCI", "Entry Signal Source", options=["CCI", "Momentum"], tooltip="Choose the entry signal source: CCI or Momentum")
ccimomLength = input.int(10, minval=1, title="CCI/Momentum Length")
useDivergence = input.bool(true, title="Use Divergence", tooltip="Consider regular bullish/bearish divergence")
rsiOverbought = input.int(65, minval=1, title="RSI Overbought Level")
rsiOversold = input.int(35, minval=1, title="RSI Oversold Level")
rsiLength = input.int(14, minval=1, title="RSI Length")

// Calculate CCI and Momentum
source = entrySignalSource == "Momentum" ? close - close[ccimomLength] : ta.cci(close, ccimomLength)
crossUp = ta.cross(source, 0)
crossDown = ta.cross(0, source)

// Calculate RSI
rsi = ta.rsi(close, rsiLength)
oversold = rsi <= rsiOversold or rsi[1] <= rsiOversold or rsi[2] <= rsiOversold or rsi[3] <= rsiOversold
overbought = rsi >= rsiOverbought or rsi[1] >= rsiOverbought or rsi[2] >= rsiOverbought or rsi[3] >= rsiOverbought

// Divergence Conditions
bullishDivergence = rsi[0] > rsi[1] and rsi[1] < rsi[2]
bearishDivergence = rsi[0] < rsi[1] and rsi[1] > rsi[2]

// Entry Conditions
longEntryCondition = crossUp and oversold and (not useDivergence or bullishDivergence)
shortEntryCondition = crossDown and overbought and (not useDivergence or bearishDivergence)

// Execute trades based on signals
strategy.entry("Buy", strategy.long, when=longEntryCondition)
strategy.entry("Sell", strategy.short, when=shortEntryCondition)

// Plot buy and sell signals
plotshape(series=longEntryCondition, style=shape.triangleup, location=location.belowbar, color=color.green, size=size.small, title="Buy Signal")
plotshape(series=shortEntryCondition, style=shape.triangledown, location=location.abovebar, color=color.red, size=size.small, title="Sell Signal")

// Entry signal alerts
alertcondition(longEntryCondition, title="BUY Signal", message="Buy Entry Signal")
alertcondition(shortEntryCondition, title="SELL Signal", message="Sell Entry Signal")