概述
本策略是一个结合了简单移动平均线(SMA)交叉和超趋势(SuperTrend)指标的自适应动量交易系统。它在5分钟时间框架上运行,利用两条SMA的交叉来捕捉趋势变化,同时使用SuperTrend指标来确认趋势方向和生成交易信号。该策略还包含了基于百分比的止盈机制,以保护盈利并控制风险。
策略原理
SMA交叉:使用两条不同周期(默认为20和50)的简单移动平均线。当短期SMA上穿长期SMA时,视为潜在的做多信号;当短期SMA下穿长期SMA时,视为潜在的做空信号。
SuperTrend指标:基于ATR(平均真实范围)计算上轨和下轨。当价格突破上轨时,趋势被认为是上升;当价格跌破下轨时,趋势被认为是下降。这有助于过滤掉弱势信号并确认强势趋势。
交易逻辑:
- 做多条件:短期SMA上穿长期SMA,且SuperTrend指示上升趋势。
- 做空条件:短期SMA下穿长期SMA,且SuperTrend指示下降趋势。
止盈设置:基于入场价格的固定百分比(默认为1%)设置止盈点。这有助于在趋势反转前锁定利润。
可视化:策略在图表上绘制了SMA线、SuperTrend指标,以及买卖信号标记,便于直观理解市场状况和交易逻辑。
策略优势
趋势跟踪与动量结合:通过结合SMA交叉和SuperTrend指标,策略能够有效捕捉市场趋势并跟随强势动量。
自适应性强:SuperTrend指标基于ATR计算,能够根据市场波动性自动调整,使策略在不同市场环境下保持稳定性。
信号确认机制:要求SMA交叉和SuperTrend指标同时满足条件才会触发交易,有效减少了假突破带来的风险。
风险管理:内置的百分比止盈机制有助于及时锁定利润,防止回撤过大。
可视化效果好:策略在图表上清晰标注了各种指标和信号,便于交易者直观理解市场状况和策略逻辑。
参数灵活可调:策略提供了多个可调参数,如SMA周期、ATR周期、ATR乘数等,使用者可以根据不同市场和个人偏好进行优化。
策略风险
震荡市场表现欠佳:在横盘或者震荡市场中,策略可能产生频繁的假信号,导致过度交易和亏损。
滞后性:SMA和SuperTrend都是滞后指标,在快速反转的市场中可能反应不及时,造成入场或出场延迟。
固定止盈可能错过大趋势:虽然固定百分比止盈有助于控制风险,但在强劲趋势中可能导致过早退出,错过更大的利润机会。
参数敏感性:策略性能可能对参数设置较为敏感,不同的参数组合在不同市场环境下表现差异较大。
缺乏止损机制:当前策略没有明确的止损设置,在市场突发性逆转时可能面临较大风险。
策略优化方向
引入自适应参数:可以考虑使用自适应机制动态调整SMA周期和SuperTrend参数,以更好地适应不同市场环境。
增加市场环境过滤:引入波动率指标(如ATR)或趋势强度指标(如ADX),在低波动或弱趋势市场中减少交易频率。
优化止盈机制:可以考虑使用跟踪止盈或者基于ATR的动态止盈,以在保护利润的同时不过早退出强势趋势。
加入止损设置:引入基于ATR的动态止损或固定风险比例的止损,以更好地控制风险。
多时间框架分析:结合更高时间框架的趋势信息,以提高交易信号的可靠性。
加入成交量分析:引入成交量指标,在交易信号确认时考虑成交量因素,提高信号质量。
优化交易频率:可以考虑增加交易间隔限制或信号确认机制,减少过度交易。
回测与优化:对策略进行全面的历史回测,并使用遗传算法或网格搜索等方法优化参数组合。
总结
SMA交叉结合超趋势的自适应动量交易策略是一个综合了趋势跟踪和动量交易理念的量化交易系统。通过结合SMA交叉和SuperTrend指标,该策略能够有效捕捉市场趋势并生成交易信号。其自适应特性和信号确认机制有助于提高交易的可靠性和稳定性。
然而,该策略也存在一些潜在风险,如在震荡市场中的表现欠佳和对参数设置的敏感性。为了进一步提高策略的鲁棒性和性能,可以考虑引入自适应参数机制、优化止盈止损设置、增加市场环境过滤等优化措施。
总的来说,这是一个具有良好基础的策略框架,通过持续优化和回测,有潜力成为一个可靠的交易系统。交易者在使用时应注意根据具体交易品种和市场环境进行参数调整,并始终保持对风险的警惕。
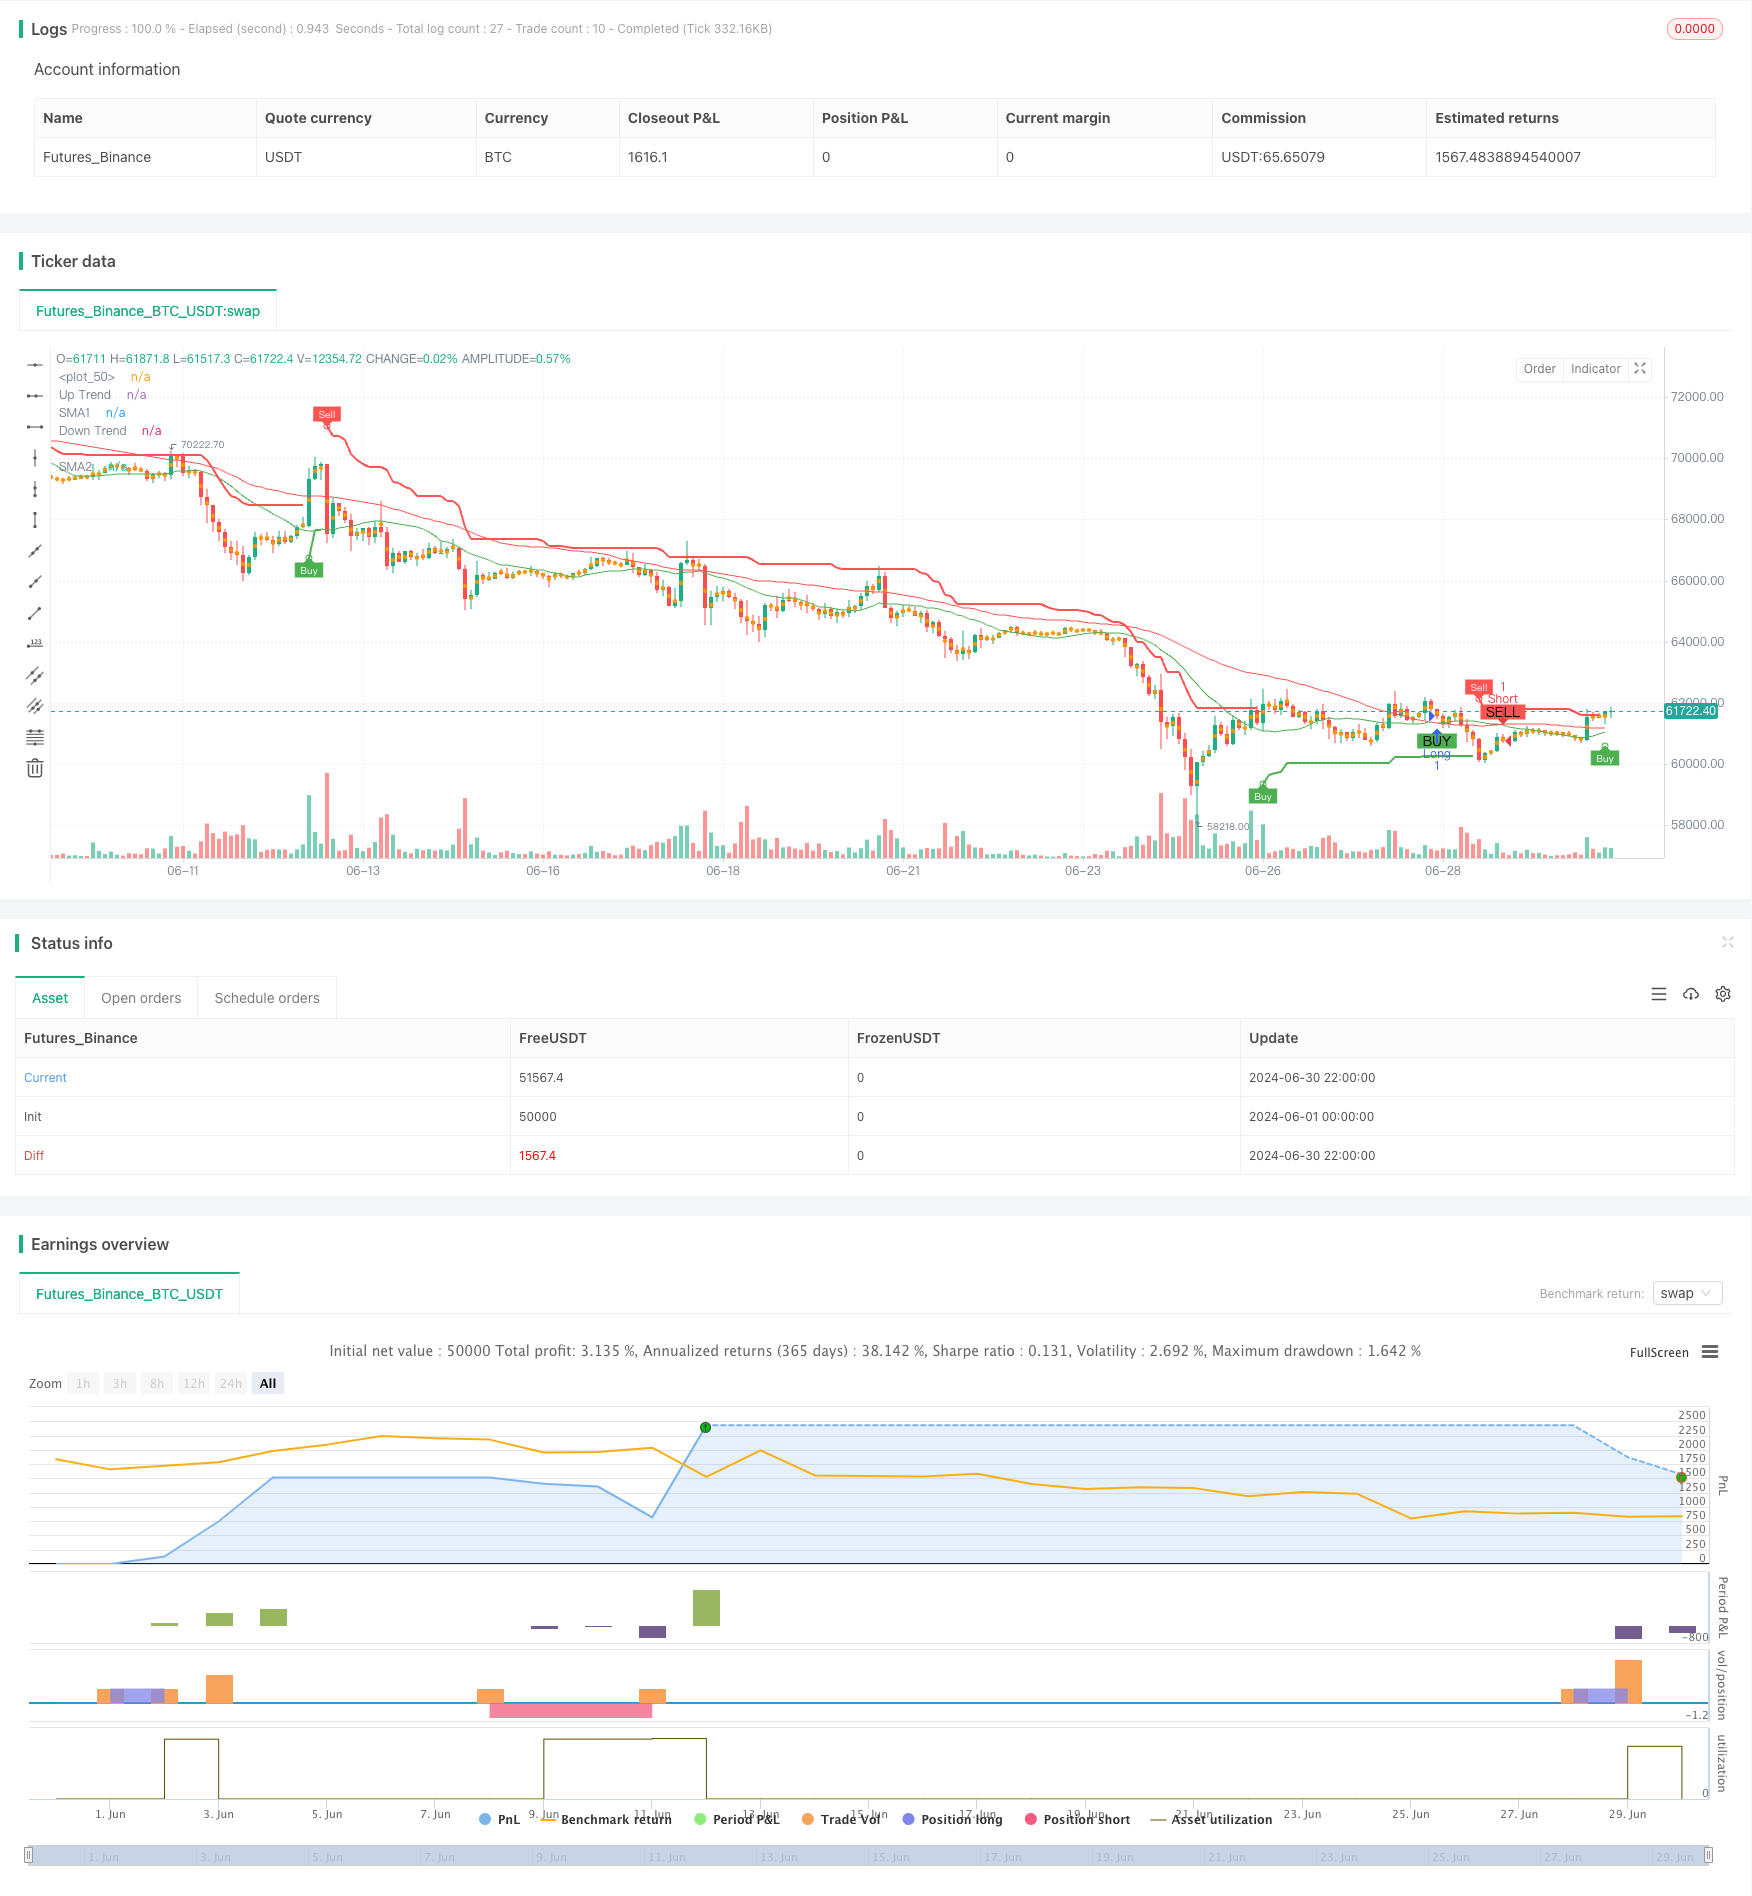
/*backtest
start: 2024-06-01 00:00:00
end: 2024-06-30 23:59:59
period: 2h
basePeriod: 15m
exchanges: [{"eid":"Futures_Binance","currency":"BTC_USDT"}]
*/

//@version=5
strategy("SMA Crossover with Supertrend", overlay=true, format=format.price, precision=2)

// Input parameters for SMAs
SMA1Length = input.int(20, title="SMA1 Length")
SMA2Length = input.int(50, title="SMA2 Length")

// Input parameters for Supertrend
Periods = input.int(10, title="ATR Period")
src = input(hl2, title="Source")
Multiplier = input.float(3.0, title="ATR Multiplier")
changeATR = input.bool(true, title="Change ATR Calculation Method?")
showsignals = input.bool(true, title="Show Buy/Sell Signals?")
highlighting = input.bool(true, title="Highlighter On/Off?")

// Calculate EMAs
SMA1 = ta.sma(close, SMA1Length)
SMA2 = ta.sma(close, SMA2Length)

// Plot SMAs
plot(SMA1, color=color.green, title="SMA1")
plot(SMA2, color=color.red, title="SMA2")

// Calculate Supertrend
atr2 = ta.sma(ta.tr, Periods)
atr = changeATR ? ta.atr(Periods) : atr2

up = src - (Multiplier * atr)
up1 = nz(up[1], up)
up := close[1] > up1 ? math.max(up, up1) : up

dn = src + (Multiplier * atr)
dn1 = nz(dn[1], dn)
dn := close[1] < dn1 ? math.min(dn, dn1) : dn

trend = 1
trend := nz(trend[1], trend)
trend := trend == -1 and close > dn1 ? 1 : trend == 1 and close < up1 ? -1 : trend

upPlot = plot(trend == 1 ? up : na, title="Up Trend", style=plot.style_linebr, linewidth=2, color=color.green)
buySignal = trend == 1 and trend[1] == -1
plotshape(buySignal ? up : na, title="UpTrend Begins", location=location.absolute, style=shape.circle, size=size.tiny, color=color.green, transp=0)
plotshape(buySignal and showsignals ? up : na, title="Buy", text="Buy", location=location.absolute, style=shape.labelup, size=size.tiny, color=color.green, textcolor=color.white, transp=0)

dnPlot = plot(trend == 1 ? na : dn, title="Down Trend", style=plot.style_linebr, linewidth=2, color=color.red)
sellSignal = trend == -1 and trend[1] == 1
plotshape(sellSignal ? dn : na, title="DownTrend Begins", location=location.absolute, style=shape.circle, size=size.tiny, color=color.red, transp=0)
plotshape(sellSignal and showsignals ? dn : na, title="Sell", text="Sell", location=location.absolute, style=shape.labeldown, size=size.tiny, color=color.red, textcolor=color.white, transp=0)

mPlot = plot(ohlc4, title="", style=plot.style_circles, linewidth=0)
longFillColor = highlighting ? (trend == 1 ? color.green : color.white) : color.white
shortFillColor = highlighting ? (trend == -1 ? color.red : color.white) : color.white
fill(mPlot, upPlot, title="UpTrend Highlighter", color=longFillColor)
fill(mPlot, dnPlot, title="DownTrend Highlighter", color=shortFillColor)

alertcondition(buySignal, title="SuperTrend Buy", message="SuperTrend Buy!")
alertcondition(sellSignal, title="SuperTrend Sell", message="SuperTrend Sell!")
changeCond = trend != trend[1]
alertcondition(changeCond, title="SuperTrend Direction Change", message="SuperTrend has changed direction!")

// Entry Conditions
longCondition = ta.crossover(SMA1, SMA2) and trend == 1
shortCondition = ta.crossunder(SMA1, SMA2) and trend == -1


// Execute Trades
strategy.entry("Long", strategy.long, when=longCondition)
strategy.entry("Short", strategy.short, when=shortCondition)


// Exit Conditions
takeProfitPercent = input.float(1.0, title="Take Profit (%)") / 100
longTakeProfit = strategy.position_avg_price * (1 + takeProfitPercent)
shortTakeProfit = strategy.position_avg_price * (1 - takeProfitPercent)

strategy.exit("Take Profit Long", from_entry="Long", limit=longTakeProfit)
strategy.exit("Take Profit Short", from_entry="Short", limit=shortTakeProfit)

// Plot Entry Signals
plotshape(series=longCondition, location=location.belowbar, color=color.green, style=shape.labelup, text="BUY")
plotshape(series=shortCondition, location=location.abovebar, color=color.red, style=shape.labeldown, text="SELL")