概述
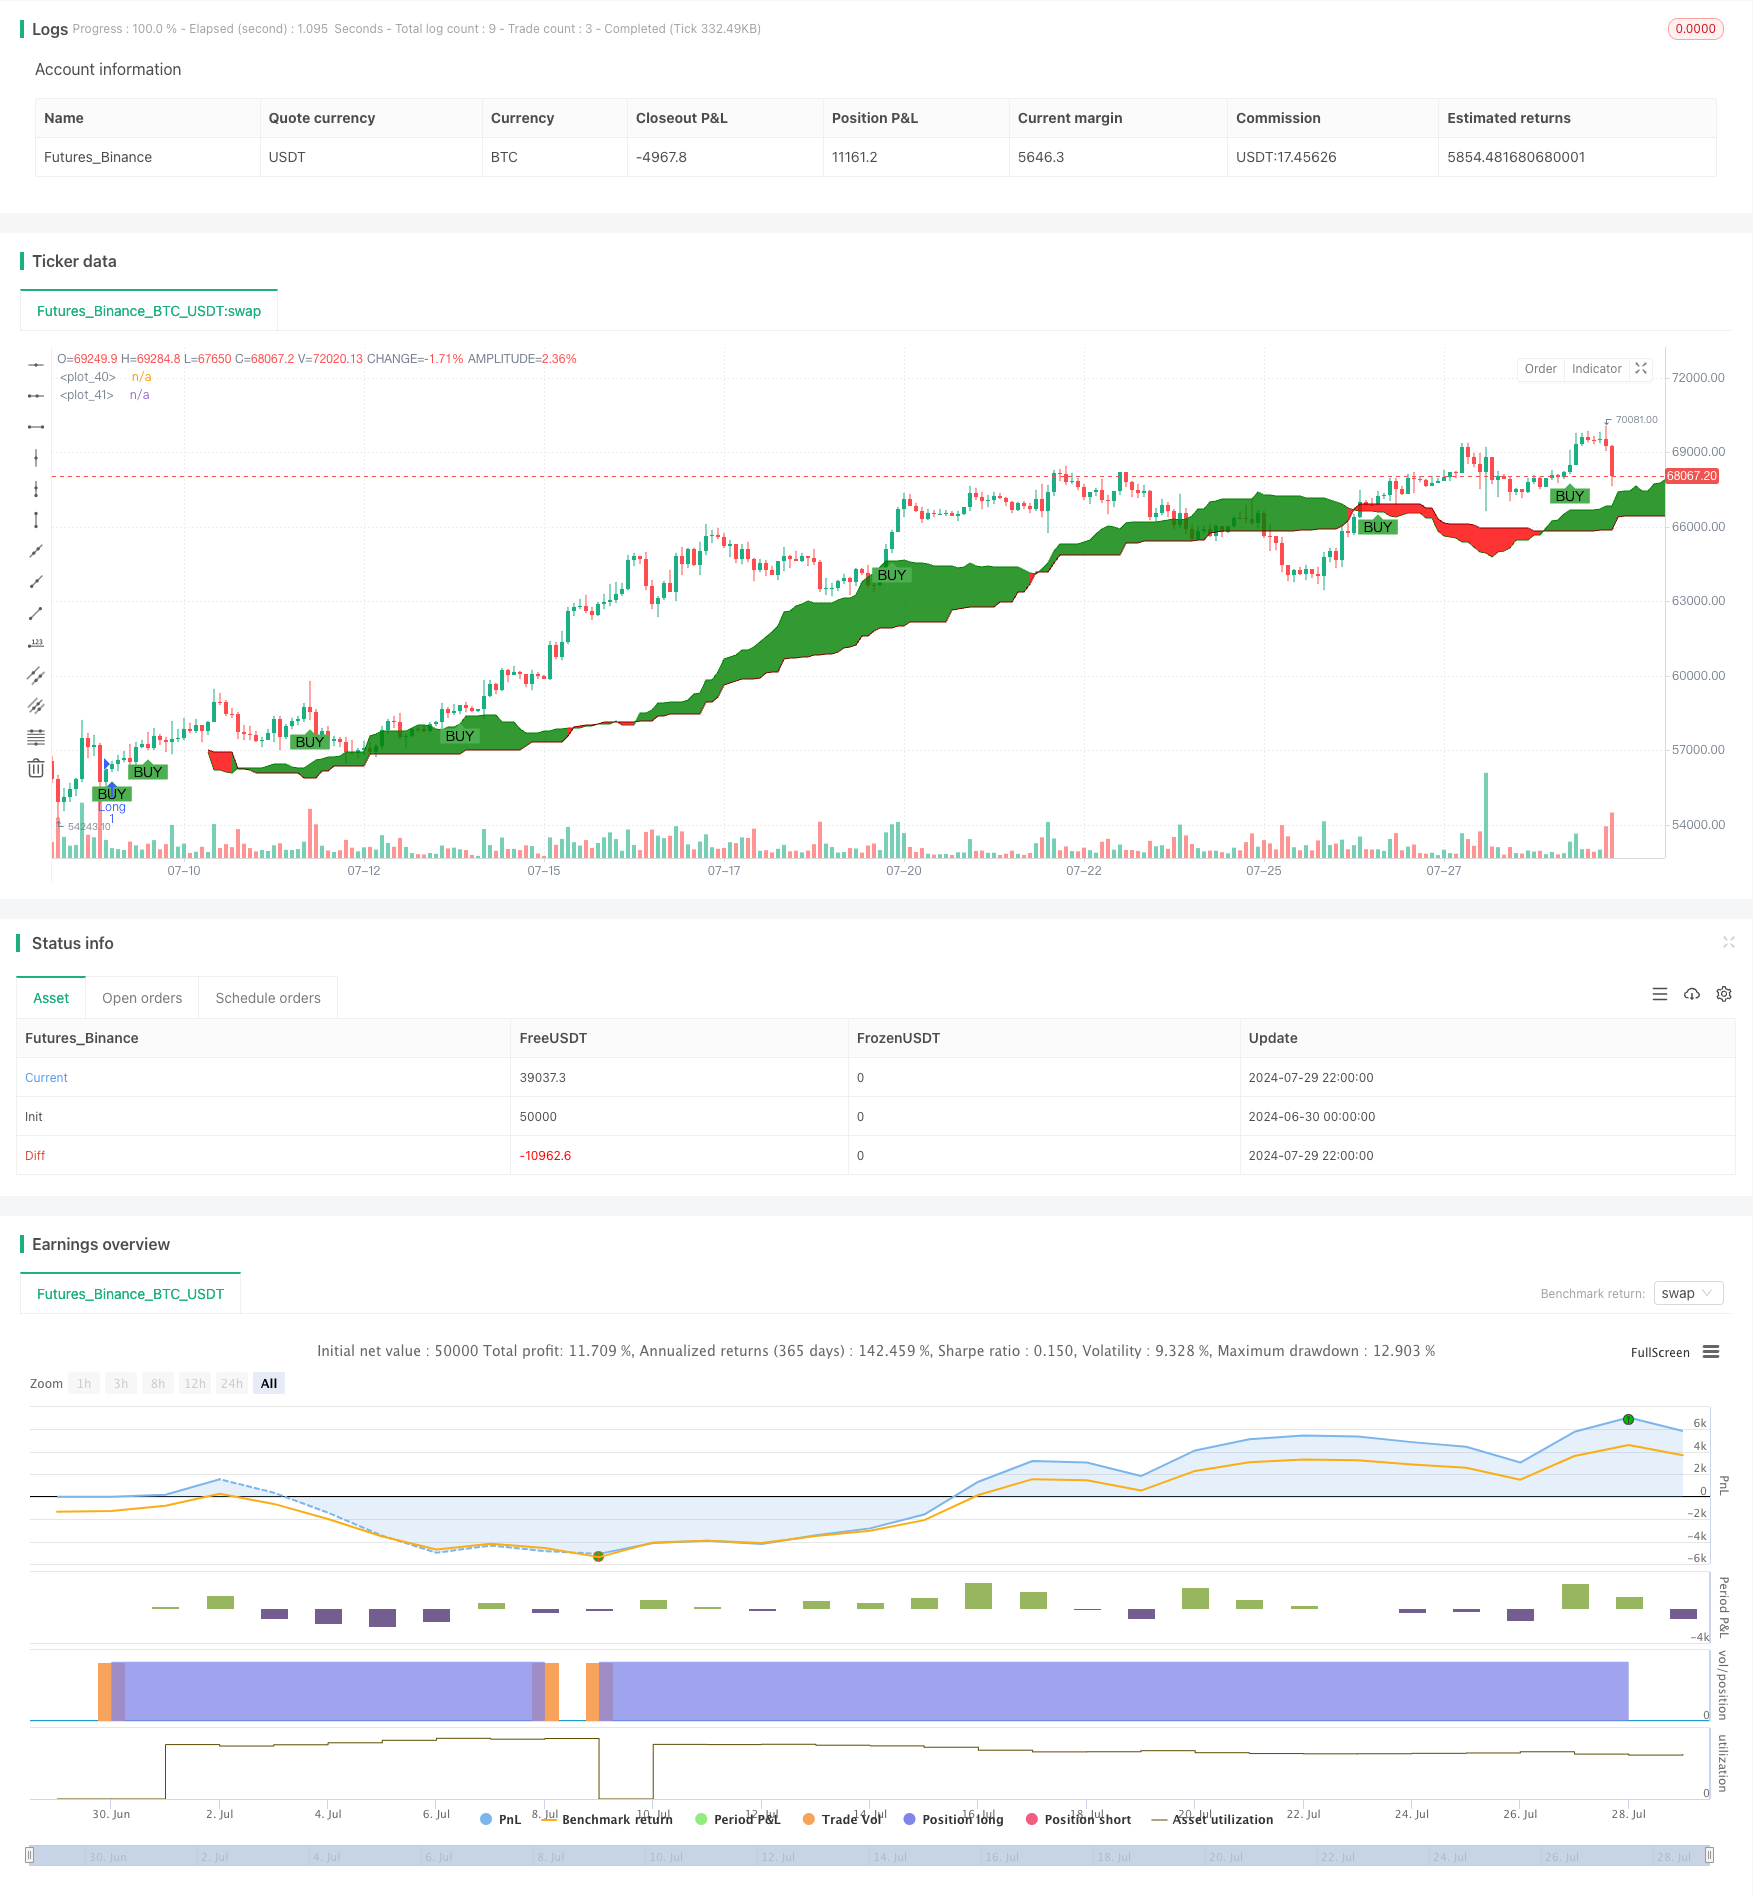
基于多维度动态云图的Ichimoku高级多周期交易策略是一个复杂而全面的技术分析工具,旨在捕捉市场中的长期趋势和重要转折点。该策略基于传统的一目均衡表(Ichimoku Kinko Hyo)指标,通过动态调整关键参数和引入风险管理机制,实现了对不同市场周期的适应性分析。策略核心在于利用Tenkan-sen(转换线)、Kijun-sen(基准线)、Senkou Span A和B(先行带A和B)以及Chikou Span(滞后线)等多个指标线的交叉和相对位置关系,结合价格与云图(Kumo)的位置,生成买入和卖出信号。
策略原理
信号生成机制:
- 买入信号: 当Tenkan-sen向上穿越Kijun-sen,且价格位于云图之上时触发。
- 卖出信号: 当Tenkan-sen向下穿越Kijun-sen,且价格位于云图之下时触发。
参数动态调整:
- Tenkan-sen周期: 9个周期
- Kijun-sen周期: 26个周期
- Senkou Span B周期: 52个周期
- 位移(Displacement): 26个周期
风险管理:
- 引入可调节的止损百分比(默认5%)和获利百分比(默认10%)
- 适用于长期交易,特别适合周线或月线图表
视觉化:
- 使用自定义颜色方案增强云图和各指标线的可视化效果
- 通过调整云图透明度(90%)提高可读性
多维度分析:
- 结合价格、多条均线和云图位置进行多角度市场分析
- 通过Chikou Span反映价格的历史表现,增加决策参考
策略优势
全面性: 整合了多个技术指标,提供了对市场趋势、动量和潜在支撑/阻力位的全面分析。
适应性: 通过可调节的参数,策略可以适应不同的市场环境和交易周期。
风险管理: 内置的止损和获利机制有助于控制风险,保护利润。
视觉直观: 自定义的颜色方案和透明度设置使得市场状态一目了然。
长期稳定性: 特别适合长期交易者,有助于捕捉大趋势并减少噪音干扰。
多维度分析: 通过综合考虑多个指标,降低了假信号的风险。
自动化: 策略可以轻松集成到自动交易系统中,减少人为干预。
策略风险
滞后性: Ichimoku指标本质上是滞后指标,在快速变化的市场中可能反应不及时。
过度依赖: 过分依赖单一策略可能忽视其他重要的市场因素。
参数敏感性: 不同市场环境可能需要不同的参数设置,需要定期优化。
假突破: 在震荡市场中可能产生较多假信号,增加交易成本。
复杂性: 多个指标的综合分析可能导致决策过程复杂化,特别是对新手交易者。
回测偏差: 历史数据回测效果良好不代表未来表现,需要警惕过度拟合。
市场适应性: 策略在趋势明显的市场中表现较好,但在横盘或剧烈波动市场中效果可能不佳。
策略优化方向
动态参数调整: 引入自适应机制,根据市场波动性自动调整各项参数。
多时间框架分析: 整合不同时间周期的信号,提高决策的可靠性。
量化指标融合: 结合成交量、波动率等其他技术指标,增强信号的可信度。
机器学习优化: 利用机器学习算法优化参数选择和信号生成过程。
情绪分析整合: 引入市场情绪指标,如VIX或社交媒体情绪分析,丰富决策依据。
风险管理高级化: 实现动态止损和获利目标,根据市场状况自动调整。
回测框架增强: 开发更全面的回测系统,包括滑点、交易成本等实际因素。
总结
基于多维度动态云图的Ichimoku高级多周期交易策略是一个强大而灵活的技术分析工具,特别适合长期趋势交易。通过整合多个Ichimoku指标线和云图分析,结合智能的风险管理机制,该策略能够提供全面的市场洞察和交易信号。虽然存在一些固有的风险和局限性,但通过持续优化和适当的使用,它有潜力成为交易者工具箱中的有力武器。未来的优化方向应聚焦于提高策略的适应性、精确性和鲁棒性,以应对不断变化的市场环境。总的来说,这是一个值得深入研究和实践的高级交易策略,尤其适合那些追求长期稳定收益的投资者和交易者。
/*backtest
start: 2024-06-30 00:00:00
end: 2024-07-30 00:00:00
period: 2h
basePeriod: 15m
exchanges: [{"eid":"Futures_Binance","currency":"BTC_USDT"}]
*/

//@version=5
strategy("Ichimoku",overlay = true)
//indicator("Flexible Ichimoku Cloud for Long-Term Trading", overlay=true, shorttitle="Ichimoku")

// Inputs for the Ichimoku Cloud
tenkan_period = input.int(9, title="Tenkan-sen Period")
kijun_period = input.int(26, title="Kijun-sen Period")
senkou_b_period = input.int(52, title="Senkou Span B Period")
displacement = input.int(26, title="Displacement")

// Inputs for Risk Management
stop_loss_percentage = input.float(5.0, title="Stop-Loss Percentage", minval=0.1, step=0.1) / 100 // Default to 5% for long-term
take_profit_percentage = input.float(10.0, title="Take-Profit Percentage", minval=0.1, step=0.1) / 100 // Default to 10% for long-term

// Colors and Styling
tenkan_color = input.color(color.blue, title="Tenkan-sen Color")
kijun_color = input.color(color.red, title="Kijun-sen Color")
senkou_a_color = input.color(color.green, title="Senkou Span A Color")
senkou_b_color = input.color(color.maroon, title="Senkou Span B Color")
chikou_color = input.color(color.purple, title="Chikou Span Color")
cloud_bull_color = input.color(color.green, title="Bullish Cloud Color", inline="cloud")
cloud_bear_color = input.color(color.red, title="Bearish Cloud Color", inline="cloud")
cloud_transparency = input.int(90, title="Cloud Transparency", minval=0, maxval=100)

// Calculating the Ichimoku components
tenkan_sen = (ta.highest(high, tenkan_period) + ta.lowest(low, tenkan_period)) / 2
kijun_sen = (ta.highest(high, kijun_period) + ta.lowest(low, kijun_period)) / 2
senkou_span_a = ta.sma(tenkan_sen + kijun_sen, 1) / 2
senkou_span_b = (ta.highest(high, senkou_b_period) + ta.lowest(low, senkou_b_period)) / 2
chikou_span = close[displacement]

// Plotting the Ichimoku components
//plot(tenkan_sen, color=tenkan_color, title="Tenkan-sen", linewidth=2)
//plot(kijun_sen, color=kijun_color, title="Kijun-sen", linewidth=2)
//plot(senkou_span_a, color=senkou_a_color, title="Senkou Span A", offset=displacement, linewidth=1)
//plot(senkou_span_b, color=senkou_b_color, title="Senkou Span B", offset=displacement, linewidth=1)
//plot(chikou_span, color=chikou_color, title="Chikou Span", offset=-displacement, linewidth=1)

// Plotting the Kumo (Cloud)
p1 = plot(senkou_span_a, offset=displacement, color=senkou_a_color)
p2 = plot(senkou_span_b, offset=displacement, color=senkou_b_color)
fill(p1, p2, color=senkou_span_a > senkou_span_b ? color.new(cloud_bull_color, cloud_transparency) : color.new(cloud_bear_color, cloud_transparency), title="Kumo")

// Long and Short Conditions
longCondition = ta.crossover(tenkan_sen, kijun_sen) and close > senkou_span_a and close > senkou_span_b
shortCondition = ta.crossunder(tenkan_sen, kijun_sen) and close < senkou_span_a and close < senkou_span_b

// Plotting Buy and Sell Signals
plotshape(series=longCondition, location=location.belowbar, color=color.green, style=shape.labelup, text="BUY", title="Buy Signal", size=size.small)
plotshape(series=shortCondition, location=location.abovebar, color=color.red, style=shape.labeldown, text="SELL", title="Sell Signal", size=size.small)

var float entry_price = na
var float stop_loss = na
var float take_profit = na

if (longCondition)
    entry_price := close
    stop_loss := close * (1 - stop_loss_percentage)
    take_profit := close * (1 + take_profit_percentage)

if (shortCondition)
    entry_price := close
    stop_loss := close * (1 + stop_loss_percentage)
    take_profit := close * (1 - take_profit_percentage)

// Plotting Stop-Loss and Take-Profit Levels
//plot(entry_price, color=color.yellow, title="Entry Price", linewidth=1, offset=-displacement)
//plot(stop_loss, color=color.red, title="Stop-Loss Level", linewidth=1, offset=-displacement)
//plot(take_profit, color=color.green, title="Take-Profit Level", linewidth=1, offset=-displacement)

// Plotting Stop-Loss and Take-Profit Labels
//label.new(bar_index, stop_loss, text="SL", color=color.red, style=label.style_label_down, textcolor=color.white, size=size.small)
//label.new(bar_index, take_profit, text="Take-Profit", color=color.green, style=label.style_label_up, textcolor=color.white, size=size.small)

// Alerts for Buy and Sell Signals
alertcondition(longCondition, title="Buy Alert", message="Ichimoku Buy Signal")
alertcondition(shortCondition, title="Sell Alert", message="Ichimoku Sell Signal")

strategy.entry("Long",strategy.long, when=longCondition)
strategy.close("Long",when=shortCondition)