概述
本策略是一个基于多重技术指标背离的交易系统,结合了RSI、MACD和随机指标的信号来识别潜在的买入和卖出机会。该策略还集成了灵活的止盈和止损机制,以管理风险并锁定利润。通过综合分析多个指标的背离信号,该策略旨在提高交易决策的准确性和可靠性。
策略原理
该策略的核心原理是利用多重技术指标的背离来识别潜在的趋势反转点。具体而言,策略使用以下三个指标:
- 相对强弱指数(RSI):用于衡量价格动量。
- 移动平均线趋同/背离指标(MACD):用于识别趋势方向和强度。
- 随机指标(Stochastic):用于判断资产是否处于超买或超卖状态。
策略通过以下步骤运作:
- 计算RSI、MACD和随机指标的值。
- 检测每个指标的背离情况:
- RSI背离:当RSI穿越其14周期简单移动平均线时。
- MACD背离:当MACD线穿越信号线时。
- 随机指标背离:当随机指标穿越其14周期简单移动平均线时。
- 当所有三个指标都显示背离时,策略生成交易信号:
- 买入信号:RSI背离 + MACD背离 + 随机指标背离
- 卖出信号:RSI背离 + MACD背离 + 随机指标不背离
- 执行交易并设置止盈和止损水平:
- 止盈水平:入场价格的20%
- 止损水平:入场价格的10%
这种多重确认的方法旨在减少假信号,提高交易的准确性。
策略优势
多重指标确认:通过结合RSI、MACD和随机指标的信号,策略能够更准确地识别潜在的趋势反转点,减少假信号的影响。
灵活的风险管理:集成的止盈和止损机制允许交易者根据个人风险偏好和市场条件调整风险回报比。
适应性强:策略可以应用于不同的时间框架和各种金融工具,具有广泛的适用性。
自动化交易:策略可以轻松实现自动化,减少人为情绪影响,提高执行效率。
清晰的入场和出场规则:明确定义的交易规则消除了主观判断,有助于保持交易纪律。
动态止盈止损:基于入场价格百分比的止盈止损设置,能够根据不同的市场波动性自动调整。
趋势捕捉能力:通过识别背离,策略有潜力在早期阶段捕捉到新趋势的形成。
策略风险
过度交易风险:多重指标可能导致频繁的交易信号,增加交易成本并可能影响整体性能。
滞后性问题:技术指标本质上是滞后的,可能导致在趋势已经发生显著变化后才进行交易。
市场条件敏感性:在横盘或低波动性市场中,策略可能表现不佳,产生更多假信号。
固定止盈止损的局限性:虽然基于百分比的止盈止损提供了一定的灵活性,但可能不适合所有市场条件。
参数优化风险:过度优化指标参数可能导致过拟合,在实际交易中表现不佳。
相关性风险:在某些市场条件下,不同指标可能高度相关,降低多重确认的有效性。
缺乏基本面考虑:纯技术分析方法可能忽视重要的基本面因素,影响长期表现。
策略优化方向
动态指标参数:引入自适应机制,根据市场波动性动态调整RSI、MACD和随机指标的参数。
市场regime识别:整合市场状态分类算法,在不同的市场环境(如趋势、震荡)中调整策略行为。
止盈止损优化:实现动态止盈止损,考虑市场波动性和支撑阻力水平,而不仅仅依赖固定百分比。
加入成交量分析:整合成交量指标,提高趋势反转识别的准确性。
时间过滤器:引入基于时间的过滤器,避免在已知的低流动性或高波动性时段交易。
机器学习增强:利用机器学习算法优化指标组合和权重,提高信号质量。
风险管理改进:实现更复杂的仓位管理策略,如基于波动性的仓位大小调整。
多时间框架分析:整合多个时间框架的分析,提高交易决策的稳健性。
基本面整合:考虑将关键的基本面指标或事件纳入决策过程,实现更全面的分析。
总结
“多指标背离买卖策略与自适应止盈止损”是一个复杂而全面的交易系统,通过整合多个技术指标的背离信号来识别潜在的趋势反转机会。该策略的优势在于其多重确认机制和灵活的风险管理方法,这有助于提高交易决策的准确性和可靠性。然而,它也面临诸如过度交易、滞后性和市场条件敏感性等挑战。
通过实施建议的优化措施,如动态参数调整、市场状态识别和更先进的风险管理技术,该策略有潜力进一步提升其性能和适应性。重要的是,交易者在实际应用中应当谨慎,充分测试策略在不同市场条件下的表现,并根据个人风险承受能力和投资目标进行必要的调整。
总的来说,这个策略为量化交易者提供了一个强大的框架,可以作为构建更复杂和个性化交易系统的基础。通过持续的优化和改进,它有潜力成为一个有效的交易工具,帮助交易者在复杂多变的金融市场中取得成功。
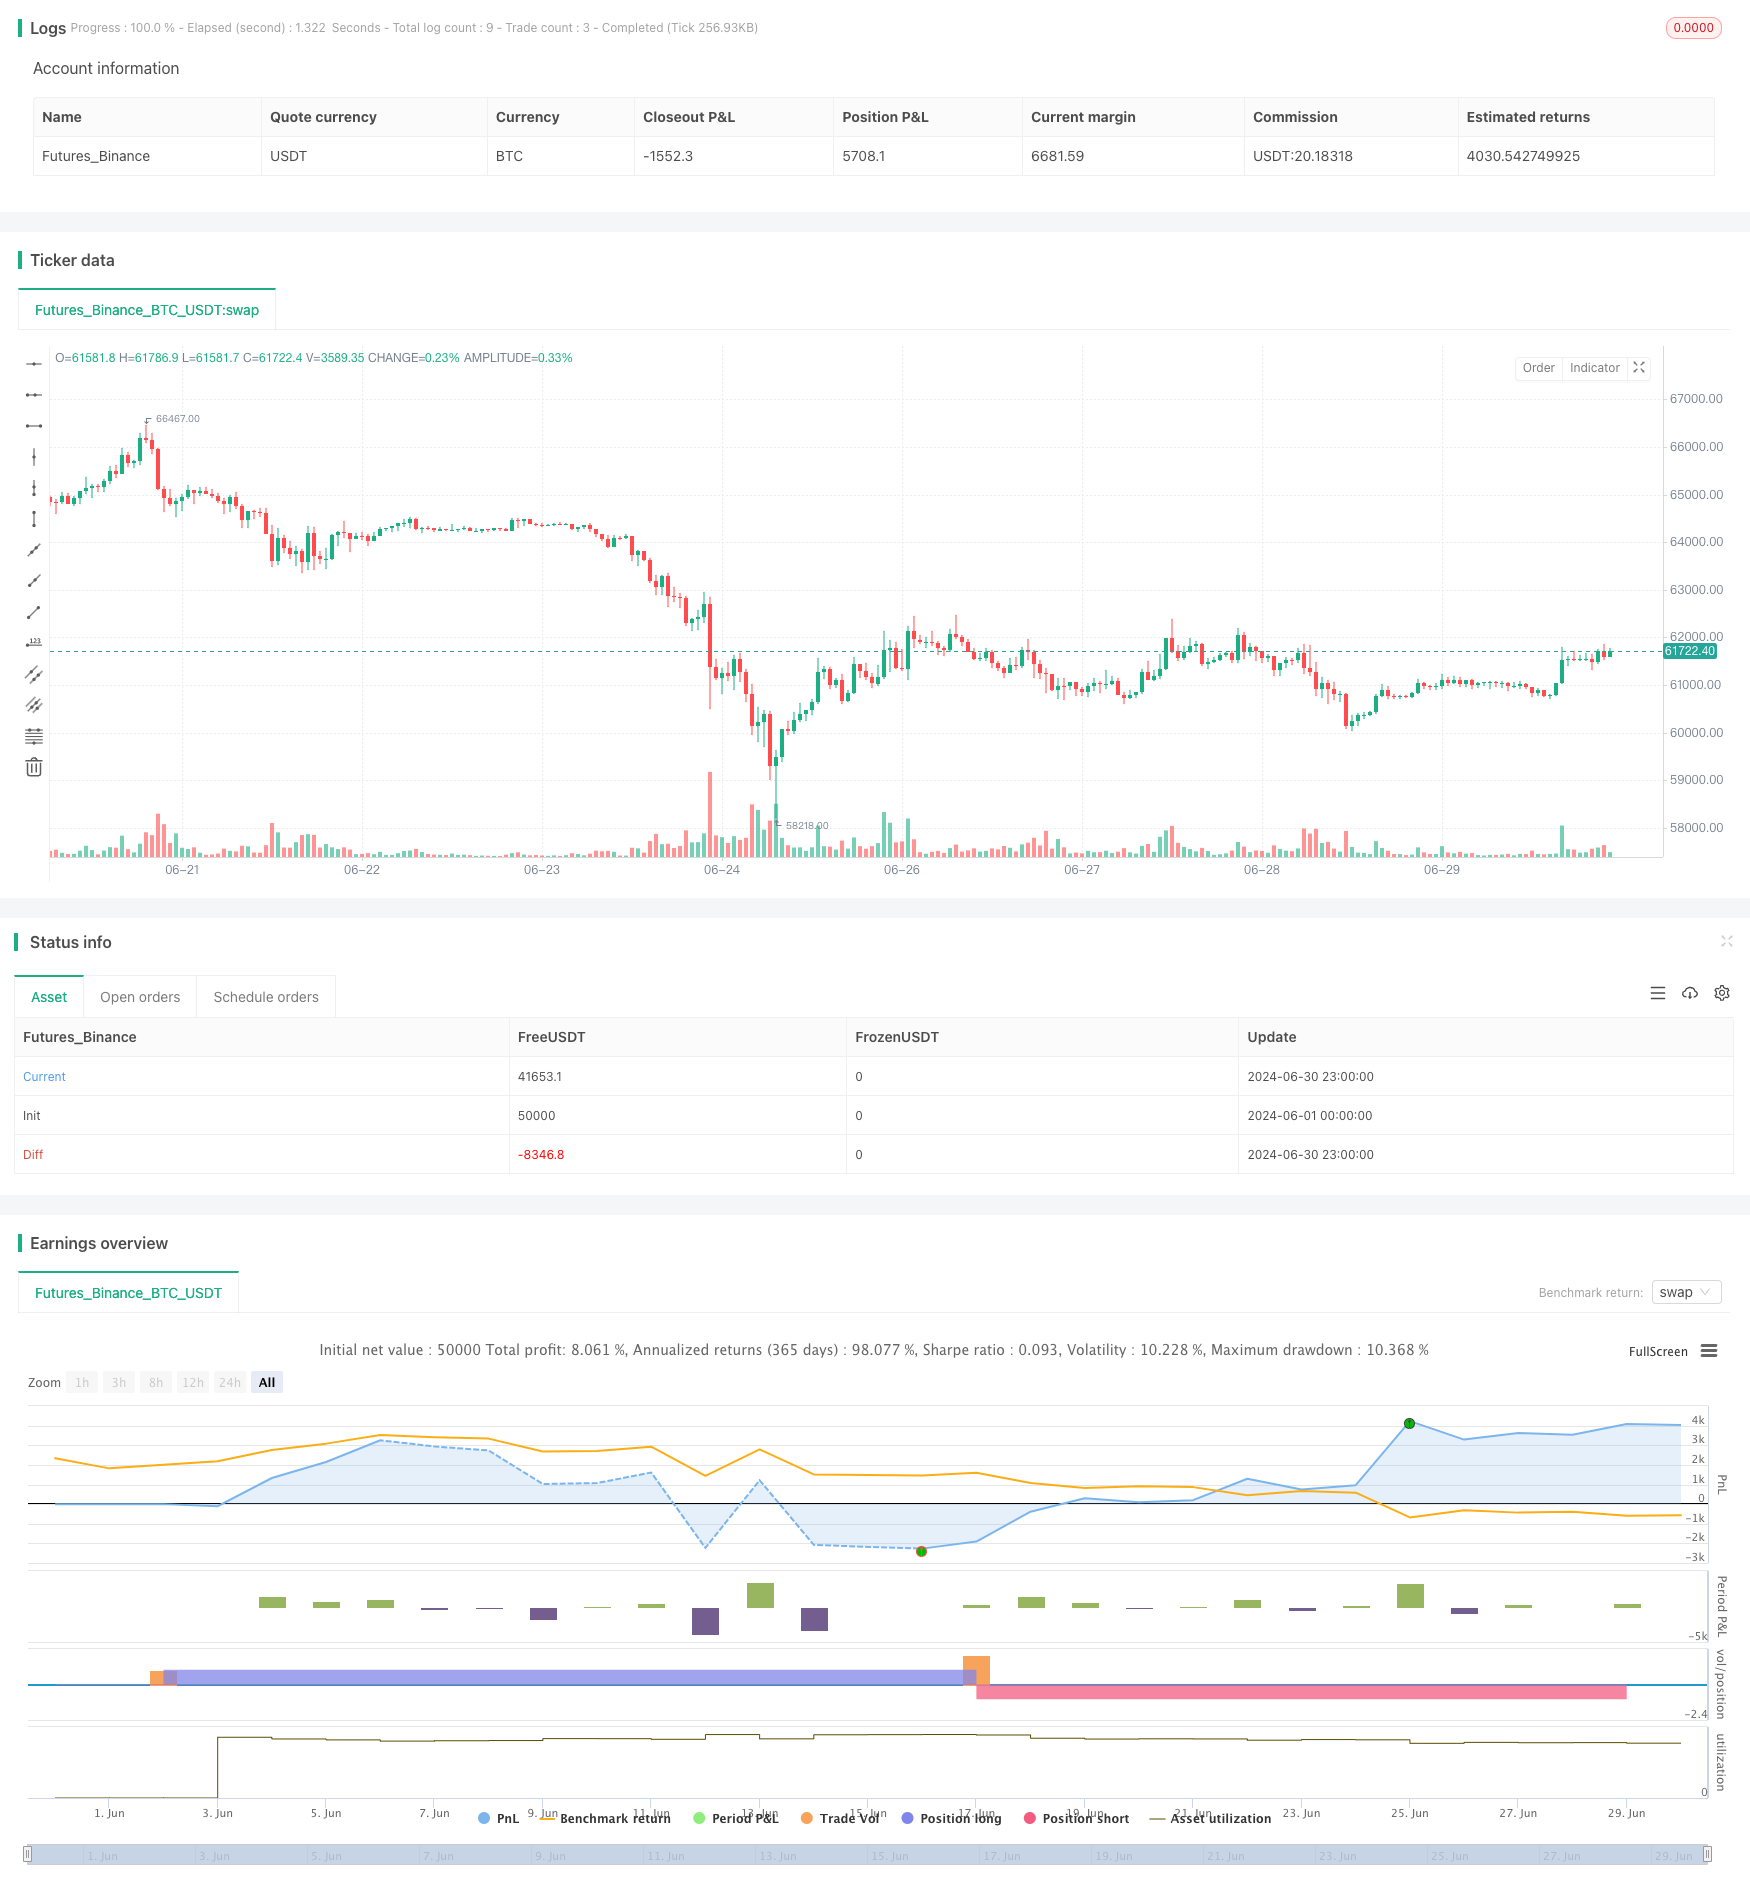
/*backtest
start: 2024-06-01 00:00:00
end: 2024-06-30 23:59:59
period: 1h
basePeriod: 15m
exchanges: [{"eid":"Futures_Binance","currency":"BTC_USDT"}]
*/

//You will have to choose between High profits and high risks or low profits and low risks? By adjusting TP and SL values
//.........................Working principle
//Even though many pyramid orders are opened  The position will be closed when the specified TP target profit is reached.
//..... and setting SL is to ensure safety from being dragged down and losing a large sum of money (it is very important, you need to know what percentage the price swings on the moving chart are in most cases).
//I wish you good luck and prosperity as you use this indicator.


//@version=5
strategy("Multi-Divergence Buy/Sell Strategy with TP and SL", overlay=true)

// Input parameters
rsiLength = input(14, "RSI Length")
macdShortLength = input(12, "MACD Short Length")
macdLongLength = input(26, "MACD Long Length")
macdSignalSmoothing = input(9, "MACD Signal Smoothing")
stochLength = input(14, "Stochastic Length")
stochOverbought = input(80, "Stochastic Overbought Level")
stochOversold = input(20, "Stochastic Oversold Level")

// Take Profit and Stop Loss as percentage of entry price
takeProfitPerc = input(20.0, "Take Profit (%)") / 100.0
stopLossPerc = input(10.0, "Stop Loss (%)") / 100.0

// Calculate RSI
rsi = ta.rsi(close, rsiLength)

// Calculate MACD
[macdLine, signalLine, _] = ta.macd(close, macdShortLength, macdLongLength, macdSignalSmoothing)

// Calculate Stochastic
stoch = ta.stoch(close, high, low, stochLength)

// Determine divergences
rsiDivergence = ta.crossover(rsi, ta.sma(rsi, 14))
macdDivergence = ta.crossover(macdLine, signalLine)
stochDivergence = ta.crossover(stoch, ta.sma(stoch, 14))

// Determine buy/sell conditions
buyCondition = rsiDivergence and macdDivergence and stochDivergence
sellCondition = rsiDivergence and macdDivergence and not stochDivergence

// Execute buy/sell orders
if (buyCondition)
    strategy.entry("Buy", strategy.long)

if (sellCondition)
    strategy.entry("Sell", strategy.short)

// Calculate take profit and stop loss levels
longTakeProfitPrice = strategy.position_avg_price * (1 + takeProfitPerc)
longStopLossPrice = strategy.position_avg_price * (1 - stopLossPerc)
shortTakeProfitPrice = strategy.position_avg_price * (1 - takeProfitPerc)
shortStopLossPrice = strategy.position_avg_price * (1 + stopLossPerc)

// Close positions at take profit or stop loss level
if (strategy.position_size > 0)
    strategy.exit("Take Profit/Stop Loss", "Buy", limit=longTakeProfitPrice, stop=longStopLossPrice)

if (strategy.position_size < 0)
    strategy.exit("Take Profit/Stop Loss", "Sell", limit=shortTakeProfitPrice, stop=shortStopLossPrice)

// Plotting buy/sell signals
plotshape(buyCondition, title="Buy Signal", location=location.belowbar, color=color.green, style=shape.labelup, text="Buy")
plotshape(sellCondition, title="Sell Signal", location=location.abovebar, color=color.red, style=shape.labeldown, text="Sell")