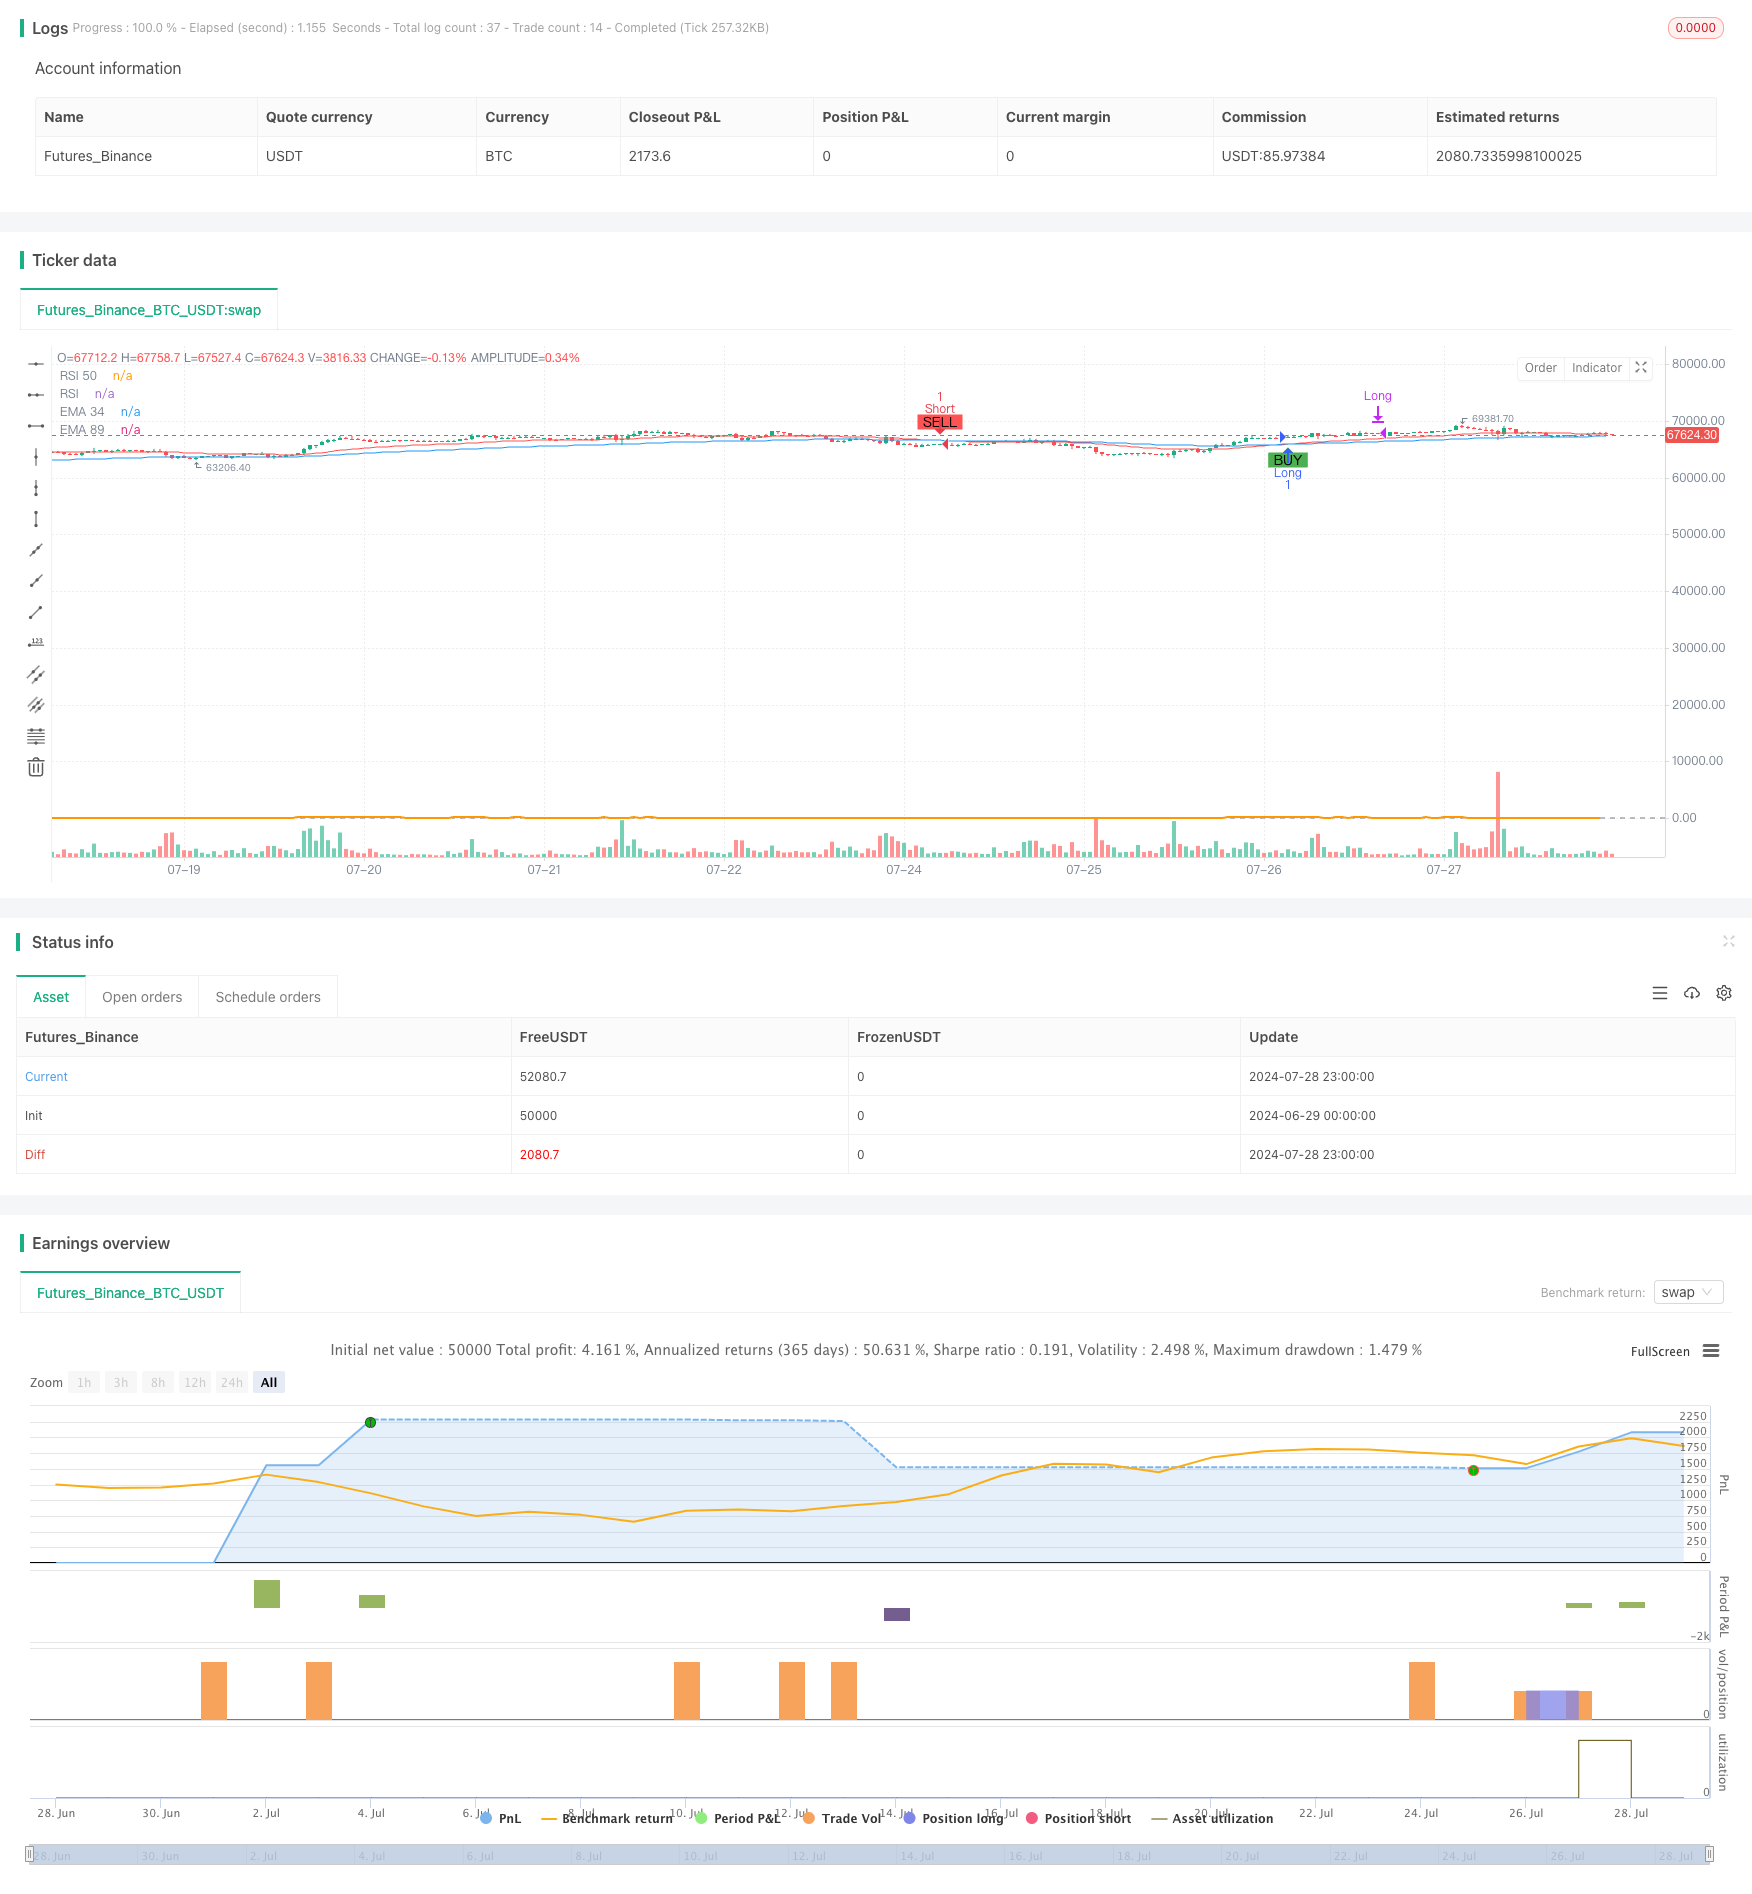
概述
这个策略是一个基于多个技术指标的综合交易系统,主要利用指数移动平均线(EMA)、相对强弱指数(RSI)和交易量来生成交易信号并管理仓位。该策略通过EMA交叉来确定市场趋势,同时使用RSI指标来判断超买超卖情况,并结合交易量来确认信号强度。此外,策略还包含了动态止盈止损机制和固定持仓时间限制,以控制风险和优化交易表现。
策略原理
交易信号生成:
- 多头入场:EMA34上穿EMA89,且RSI大于30
- 空头入场:EMA34下穿EMA89,且RSI小于70
动态止盈止损:
- 当交易量大于20根K线平均交易量的3倍时,更新止盈止损价格
- 止盈止损价格设置为高交易量出现时的收盘价
固定持仓时间:
- 无论盈亏,在开仓后15根K线强制平仓
EMA止损:
- 使用EMA34作为动态止损线
交易量确认:
- 使用高交易量条件来确认信号强度和更新止盈止损价格
策略优势
多指标协同:结合EMA、RSI和交易量,全面分析市场情况,提高信号可靠性。
动态风险管理:根据市场波动实时调整止盈止损,适应不同市场环境。
固定持仓时间:避免长期持仓带来的风险,控制每笔交易的暴露时间。
EMA动态止损:利用均线作为动态支撑阻力,提供更灵活的止损保护。
交易量确认:利用交易量突破来确认信号强度,提高交易的准确性。
可视化辅助:在图表上标注买卖信号和关键价格水平,便于分析和决策。
策略风险
震荡市风险:在横盘震荡市场中,EMA交叉可能产生频繁的虚假信号。
RSI阈值固定:固定的RSI阈值可能不适用于所有市场环境。
交易量阈值敏感性:3倍平均交易量的阈值可能过高或过低,需要根据具体市场调整。
固定持仓时间限制:15根K线的固定平仓时间可能导致过早结束盈利交易。
止盈止损价格设置:以高交易量出现时的收盘价作为止盈止损价格可能不够优化。
策略优化方向
动态RSI阈值:根据市场波动性自动调整RSI的超买超卖阈值。
优化交易量阈值:引入自适应机制,根据历史数据动态调整交易量突破倍数。
改进持仓时间管理:结合趋势强度和盈利情况,动态调整最大持仓时间。
优化止盈止损设置:考虑引入ATR指标,根据市场波动性动态设置止盈止损价格。
增加趋势过滤器:引入长周期EMA或趋势指标,避免在主要趋势相反的方向交易。
引入价格行为分析:结合K线形态和支撑阻力水平,提高入场和出场的精确度。
考虑加入回撤控制:设置最大回撤限制,在达到特定回撤水平时强制平仓。
总结
这个多指标综合型动态交易策略通过结合EMA、RSI和交易量,创建了一个全面的交易系统。它不仅能够捕捉市场趋势,还能通过动态止盈止损和固定持仓时间来管理风险。策略的优势在于其多维度分析和灵活的风险管理,但同时也面临着市场环境变化带来的挑战。通过进一步优化RSI阈值、交易量判断标准、持仓时间管理以及止盈止损设置,该策略有潜力在不同市场环境中取得更好的表现。最终,这个策略为交易者提供了一个可靠的框架,可以根据个人交易风格和市场特点进行定制和改进。
/*backtest
start: 2024-06-29 00:00:00
end: 2024-07-29 00:00:00
period: 1h
basePeriod: 15m
exchanges: [{"eid":"Futures_Binance","currency":"BTC_USDT"}]
*/

//@version=5
strategy("EMA & RSI Strategy", overlay=true)

// Install indicators
ema34 = ta.ema(close, 34)
ema89 = ta.ema(close, 89)
ema54 = ta.ema(close, 54)
ema150 = ta.ema(close, 150)
rsi = ta.rsi(close, 14)

// Draw indicator
plot(ema34, color=color.red, title="EMA 34")
plot(ema89, color=color.blue, title="EMA 89")
//plot(ema54, color=color.green, title="EMA 54")
//plot(ema150, color=color.yellow, title="EMA 150")
hline(50, "RSI 50", color=color.gray)
plot(rsi, title="RSI", color=color.orange, linewidth=2, offset=-1)

// condition long or short
longCondition = ta.crossover(ema34, ema89) and rsi > 30
shortCondition = ta.crossunder(ema34, ema89) and rsi < 70

// Add strategy long
if (longCondition)
    strategy.entry("Long", strategy.long)

// Add strategy short
if (shortCondition)
    strategy.entry("Short", strategy.short)

// Calculate the average volume of previous candles
length = 20 // Number of candles to calculate average volume
avgVolume = ta.sma(volume, length)
highVolumeCondition = volume > 3 * avgVolume

// Determine take profit and stop loss prices when there is high volume
var float takeProfitPriceLong = na
var float stopLossPriceLong = na
var float takeProfitPriceShort = na
var float stopLossPriceShort = na

if (longCondition)
    takeProfitPriceLong := na
    stopLossPriceLong := na

if (shortCondition)
    takeProfitPriceShort := na
    stopLossPriceShort := na

// Update take profit and stop loss prices when volume is high
if (strategy.opentrades.entry_id(0) == "Long" and highVolumeCondition)
    takeProfitPriceLong := close
    stopLossPriceLong := close

if (strategy.opentrades.entry_id(0) == "Short" and highVolumeCondition)
    takeProfitPriceShort := close
    stopLossPriceShort := close

// Execute exit orders for buy and sell orders when there is high volume
if (not na(takeProfitPriceLong))
    strategy.exit("Take Profit Long", from_entry="Long", limit=takeProfitPriceLong, stop=stopLossPriceLong)

if (not na(takeProfitPriceShort))
    strategy.exit("Take Profit Short", from_entry="Short", limit=takeProfitPriceShort, stop=stopLossPriceShort)

// Track the number of candles since the order was opened
var int barsSinceEntryLong = na
var int barsSinceEntryShort = na
var bool longPositionClosed = false
var bool shortPositionClosed = false

if (longCondition)
    barsSinceEntryLong := 0
    longPositionClosed := false
if (shortCondition)
    barsSinceEntryShort := 0
    shortPositionClosed := false

if (strategy.opentrades.entry_id(0) == "Long")
    barsSinceEntryLong := barsSinceEntryLong + 1

if (strategy.opentrades.entry_id(0) == "Short")
    barsSinceEntryShort := barsSinceEntryShort + 1

// Check the conditions to close the order at the 15th candle
if (strategy.opentrades.entry_id(0) == "Long" and barsSinceEntryLong >= 15 and not longPositionClosed)
    strategy.close("Long")
    longPositionClosed := true

if (strategy.opentrades.entry_id(0) == "Short" and barsSinceEntryShort >= 15 and not shortPositionClosed)
    strategy.close("Short")
    shortPositionClosed := true

// Thêm stop loss theo EMA34
if (strategy.opentrades.entry_id(0) == "Long")
    strategy.exit("Stop Loss Long", from_entry="Long", stop=ema34)
if (strategy.opentrades.entry_id(0) == "Short")
    strategy.exit("Stop Loss Short", from_entry="Short", stop=ema34)

// Displays buy/sell signals and price levels on the chart
plotshape(series=longCondition, location=location.belowbar, color=color.green, style=shape.labelup, text="BUY")
plotshape(series=shortCondition, location=location.abovebar, color=color.red, style=shape.labeldown, text="SELL")

// Displays take profit and stop loss prices on the chart
// var line takeProfitLineLong = na
// var line stopLossLineLong = na
// var line takeProfitLineShort = na
// var line stopLossLineShort = na

// if (not na(takeProfitPriceLong))
//     if na(takeProfitLineLong)
//         takeProfitLineLong := line.new(x1=bar_index, y1=takeProfitPriceLong, x2=bar_index + 1, y2=takeProfitPriceLong, color=color.blue, width=1, style=line.style_dashed)
//     else
//         line.set_xy1(takeProfitLineLong, x=bar_index, y=takeProfitPriceLong)
//         line.set_xy2(takeProfitLineLong, x=bar_index + 1, y=takeProfitPriceLong)

// if (not na(stopLossPriceLong))
//     if na(stopLossLineLong)
//         stopLossLineLong := line.new(x1=bar_index, y1=stopLossPriceLong, x2=bar_index + 1, y2=stopLossPriceLong, color=color.red, width=1, style=line.style_dashed)
//     else
//         line.set_xy1(stopLossLineLong, x=bar_index, y=stopLossPriceLong)
//         line.set_xy2(stopLossLineLong, x=bar_index + 1, y=stopLossPriceLong)

// if (not na(takeProfitPriceShort))
//     if na(takeProfitLineShort)
//         takeProfitLineShort := line.new(x1=bar_index, y1=takeProfitPriceShort, x2=bar_index + 1, y2=takeProfitPriceShort, color=color.blue, width=1, style=line.style_dashed)
//     else
//         line.set_xy1(takeProfitLineShort, x=bar_index, y=takeProfitPriceShort)
//         line.set_xy2(takeProfitLineShort, x=bar_index + 1, y=takeProfitPriceShort)

// if (not na(stopLossPriceShort))
//     if na(stopLossLineShort)
//         stopLossLineShort := line.new(x1=bar_index, y1=stopLossPriceShort, x2=bar_index + 1, y2=stopLossPriceShort, color=color.red, width=1, style=line.style_dashed)
//     else
//         line.set_xy1(stopLossLineShort, x=bar_index, y=stopLossPriceShort)
//         line.set_xy2(stopLossLineShort, x=bar_index + 1, y=stopLossPriceShort)

// // Shows annotations for take profit and stop loss prices
// if (not na(takeProfitPriceLong))
//     label.new(x=bar_index, y=takeProfitPriceLong, text="TP Long", style=label.style_label_down, color=color.blue, textcolor=color.white)
// if (not na(stopLossPriceLong))
//     label.new(x=bar_index, y=stopLossPriceLong, text="SL Long", style=label.style_label_up, color=color.red, textcolor=color.white)
// if (not na(takeProfitPriceShort))
//     label.new(x=bar_index, y=takeProfitPriceShort, text="TP Short", style=label.style_label_up, color=color.blue, textcolor=color.white)
// if (not na(stopLossPriceShort))
//     label.new(x=bar_index, y=stopLossPriceShort, text="SL Short", style=label.style_label_down, color=color.red, textcolor=color.white)