概述
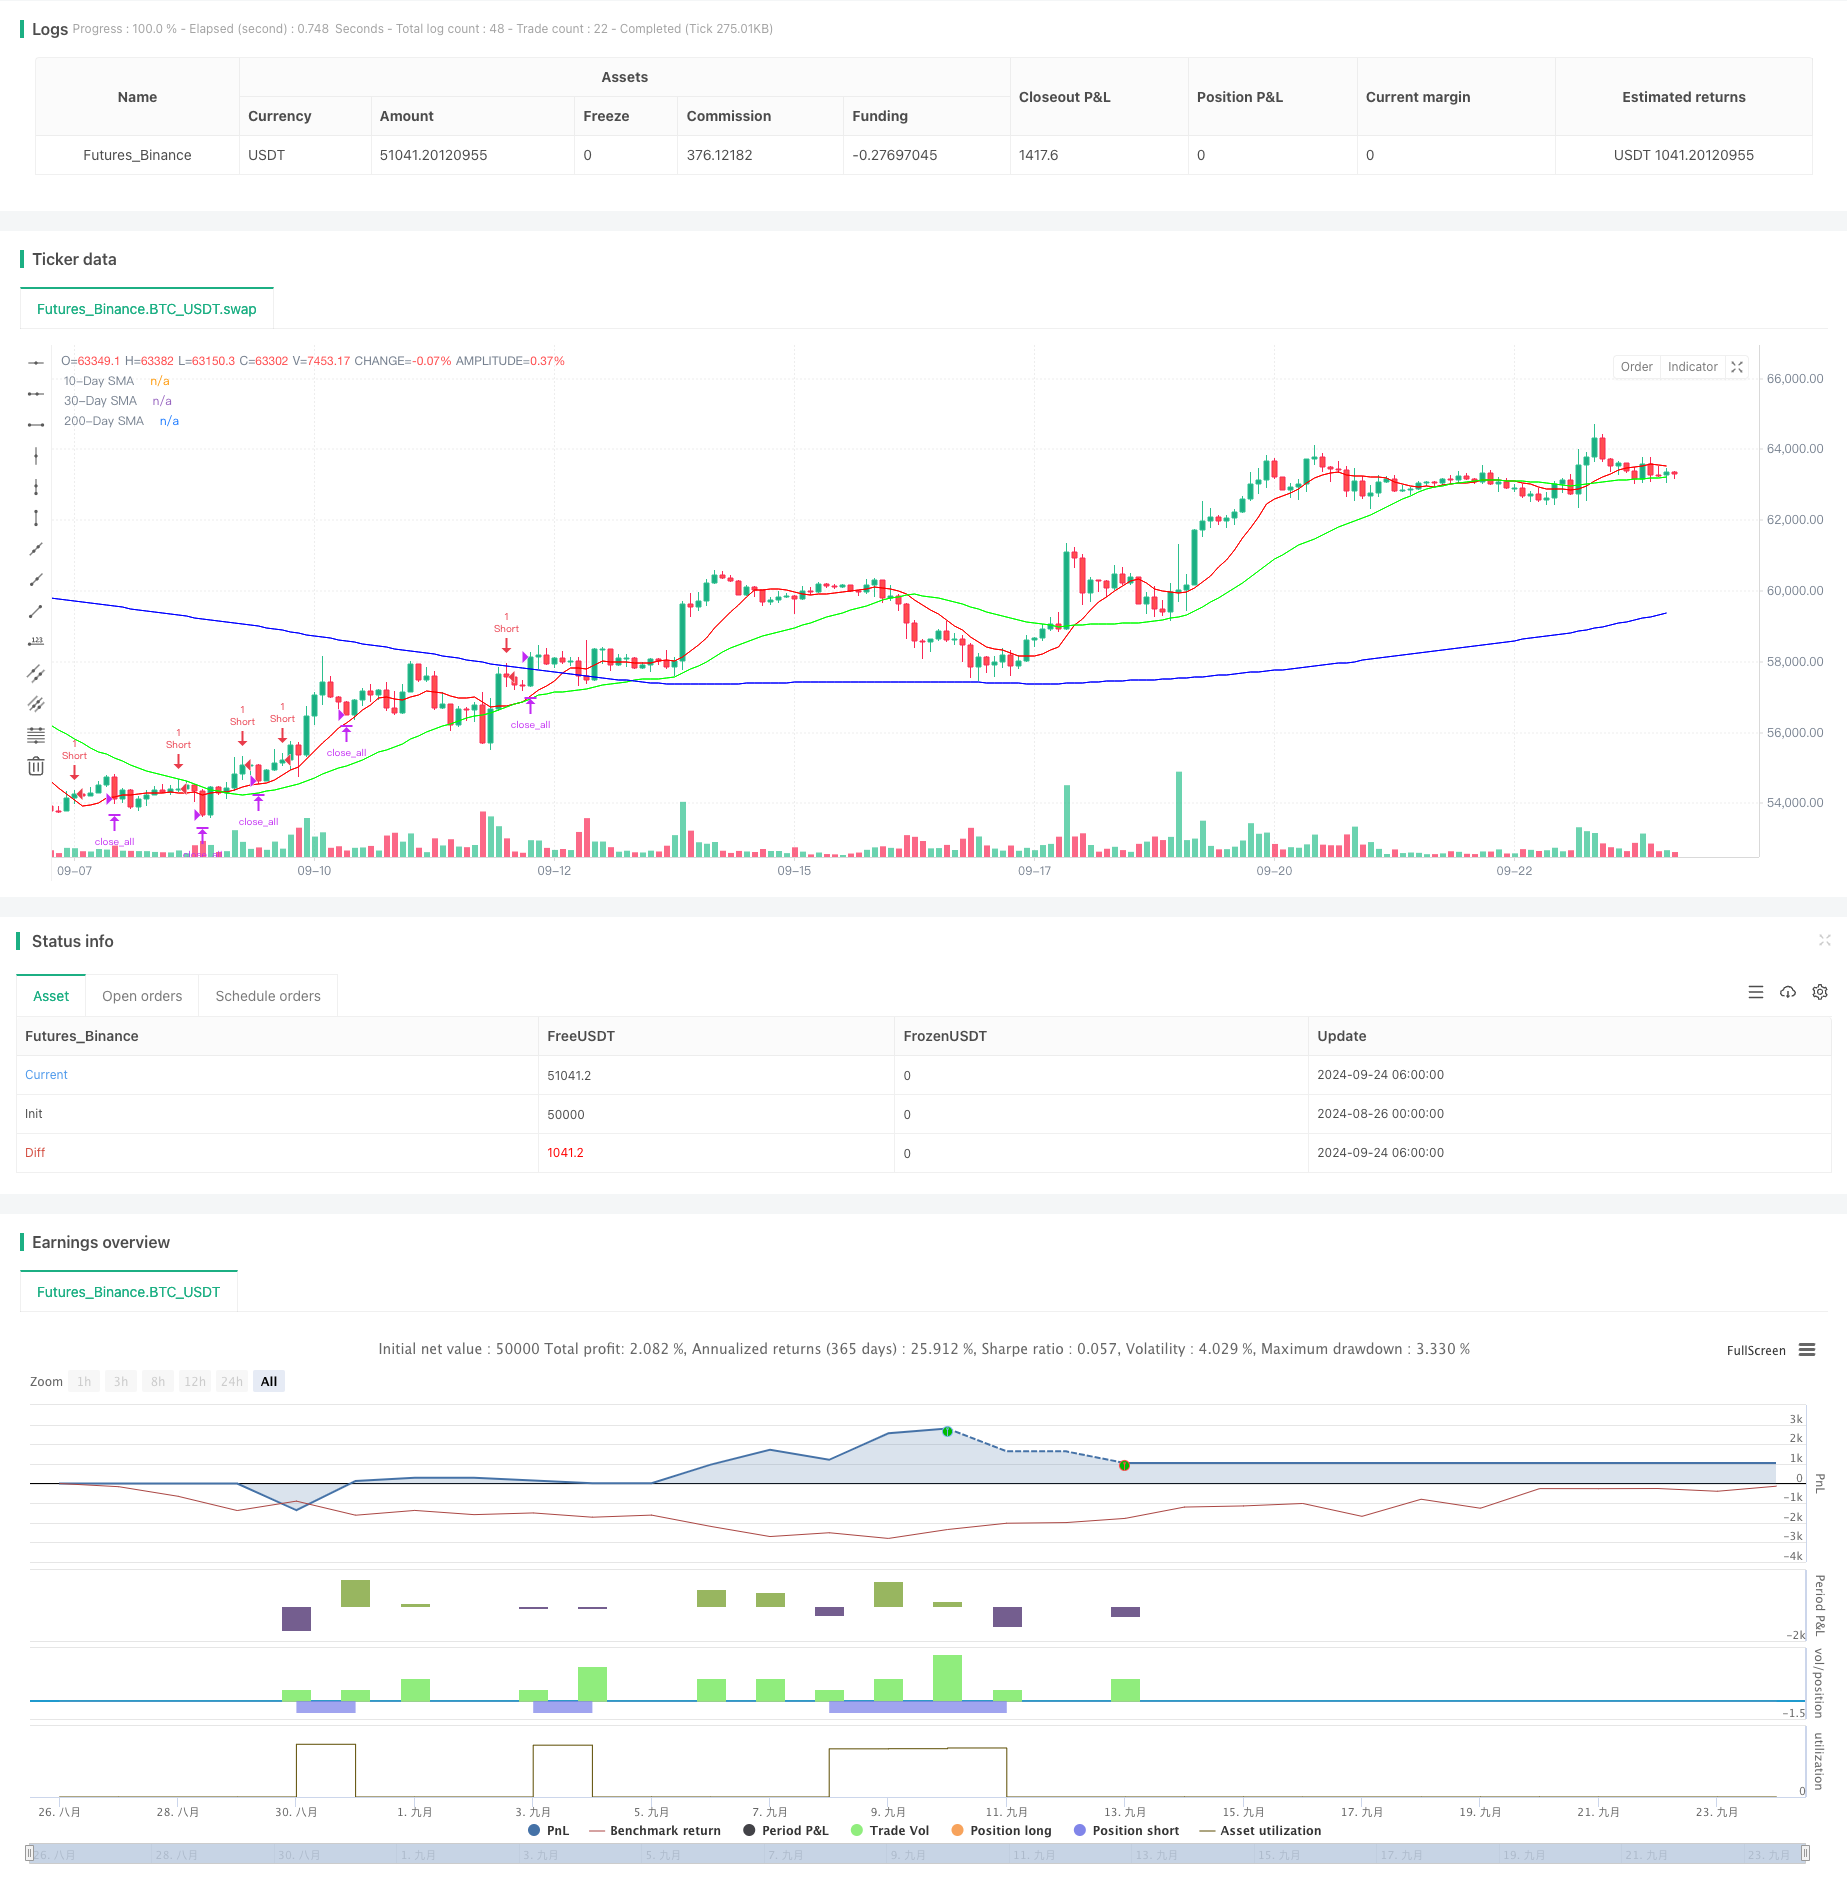
动态仓位管理RSI超买反转策略是一种结合了技术指标和动态仓位管理的短线交易策略。该策略主要利用相对强弱指标(RSI)和简单移动平均线(SMA)来识别潜在的超买状态和反转机会,并通过分批建仓的方式来优化风险收益比。策略的核心思想是在资产价格处于长期下降趋势且出现短期超买时入场做空,并在市场出现超卖或趋势转变信号时平仓。
策略原理
该策略的运作原理包括以下几个关键步骤: 1. 长期趋势判断:使用200日简单移动平均线(SMA)作为长期趋势过滤器。只有当价格低于200日SMA时,策略才会考虑做空机会。 2. 超买状态识别:利用2周期RSI指标连续两天高于75来判断短期超买状态。 3. 分批建仓:初始建仓为10%仓位,随后根据价格走势逐步加仓。当价格高于上一次建仓价时,分别增加20%、30%和40%的仓位。 4. 退出条件:当2周期RSI低于30(表示可能进入超卖状态)或10日SMA上穿30日SMA(表示可能出现趋势反转)时,平掉所有仓位。
策略优势
- 风险控制:通过分批建仓和动态仓位管理,有效控制单笔交易的风险敞口。
- 趋势跟踪:利用长短期移动平均线组合,既能捕捉长期趋势,又能识别短期反转机会。
- 灵活性:策略参数可根据不同市场环境和交易品种进行调整,适应性强。
- 自动化执行:策略逻辑清晰,易于编程实现自动化交易。
策略风险
- 市场风险:在强势上涨行情中,可能面临持续亏损的风险。
- 过度加仓风险:分批加仓机制可能导致在错误信号下过度暴露于市场。
- 流动性风险:在流动性较差的市场中,大额交易可能造成滑点增加。
- 技术指标局限性:RSI和SMA等技术指标可能产生假信号,导致错误交易决策。
策略优化方向
- 引入波动率指标:结合ATR(平均真实波幅)等波动率指标,动态调整建仓和平仓阈值。
- 优化加仓逻辑:可考虑根据市场波动程度动态调整加仓比例,避免在高波动期过度加仓。
- 增加基本面过滤:结合基本面因素,如市场情绪指标或宏观经济数据,提高入场信号的可靠性。
- 回测优化:通过大量历史数据回测,优化各项参数设置,提高策略的稳定性和盈利能力。
总结
动态仓位管理RSI超买反转策略是一种结合了技术分析和风险管理的短线交易策略。通过利用RSI超买信号和SMA趋势判断,该策略旨在捕捉市场潜在的反转机会。其分批建仓和动态退出机制有助于优化风险收益比。然而,投资者在使用该策略时需注意市场风险和技术指标的局限性,并根据实际交易环境不断优化策略参数和逻辑。通过合理的风险控制和持续的策略优化,该策略有潜力成为一种有效的量化交易工具。
策略源码
/*backtest
start: 2024-08-26 00:00:00
end: 2024-09-24 08:00:00
period: 2h
basePeriod: 2h
exchanges: [{"eid":"Futures_Binance","currency":"BTC_USDT"}]
*/

//@version=5
strategy("TPS Short Strategy by Larry Conners", overlay=true)

// Define parameters as inputs
sma_length_200 = input.int(200, title="200-Day SMA Length")
rsi_length_2 = input.int(2, title="2-Period RSI Length")
sma_length_10 = input.int(10, title="10-Day SMA Length")
sma_length_30 = input.int(30, title="30-Day SMA Length")

// Define colors as RGB values
color_sma_200 = input.color(color.rgb(0, 0, 255), title="200-Day SMA Color") // Blue
color_sma_10 = input.color(color.rgb(255, 0, 0), title="10-Day SMA Color") // Red
color_sma_30 = input.color(color.rgb(0, 255, 0), title="30-Day SMA Color") // Green

// Calculate indicators
sma_200 = ta.sma(close, sma_length_200)
rsi_2 = ta.rsi(close, rsi_length_2)
sma_10 = ta.sma(close, sma_length_10)
sma_30 = ta.sma(close, sma_length_30)

// Define conditions
below_sma_200 = close < sma_200
rsi_2_above_75_two_days = rsi_2[1] > 75 and rsi_2 > 75
price_higher_than_entry = na(strategy.opentrades.entry_price(0)) ? false : close > strategy.opentrades.entry_price(0)

// Entry conditions
if (below_sma_200 and rsi_2_above_75_two_days and na(strategy.opentrades.entry_price(0)))
    strategy.entry("Short", strategy.short, qty=1) // Short 10% of the position

// Scaling in conditions
if (price_higher_than_entry)
    strategy.entry("Short2", strategy.short, qty=2) // Short 20% more of the position

if (price_higher_than_entry)
    strategy.entry("Short3", strategy.short, qty=3) // Short 30% more of the position

if (price_higher_than_entry)
    strategy.entry("Short4", strategy.short, qty=4) // Short 40% more of the position

// Exit conditions
exit_condition_rsi_below_30 = rsi_2 < 30
exit_condition_sma_cross = ta.crossover(sma_10, sma_30)

if (exit_condition_rsi_below_30 or exit_condition_sma_cross)
    strategy.close_all() // Close all positions

// Plot indicators
plot(sma_200, color=color_sma_200, title="200-Day SMA")
plot(sma_10, color=color_sma_10, title="10-Day SMA")
plot(sma_30, color=color_sma_30, title="30-Day SMA")
相关推荐