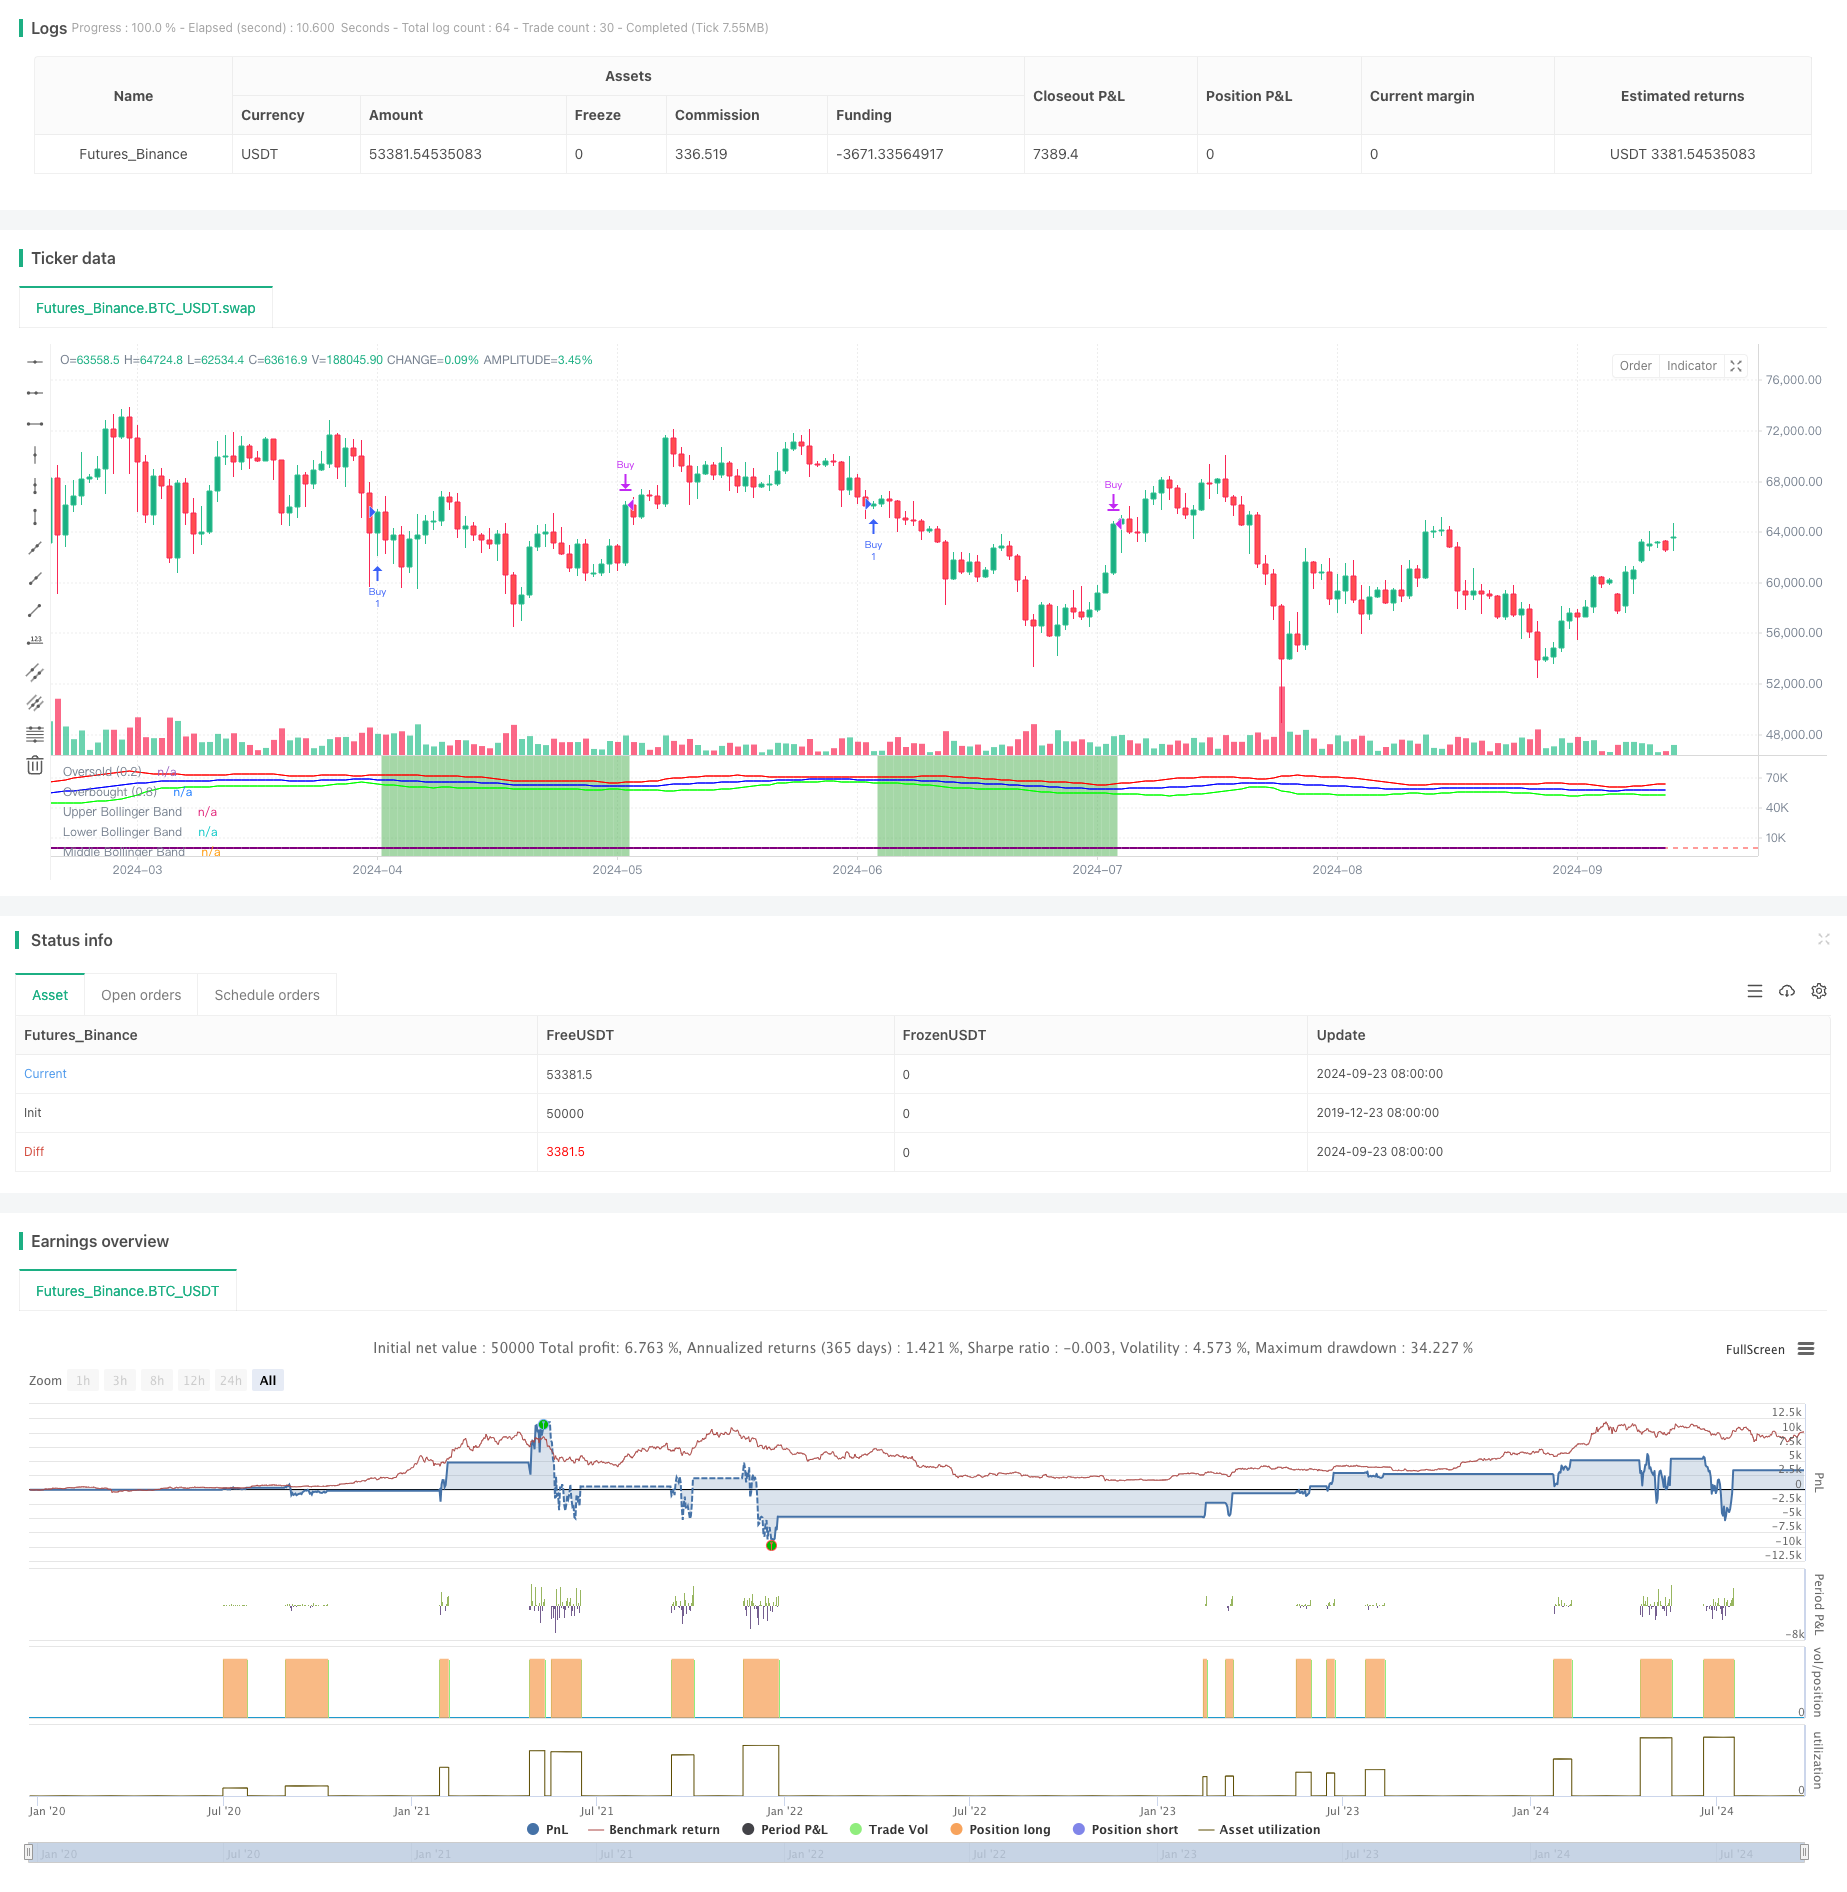
概述
布林带超买超卖策略是一种基于价格波动和均值回归原理的交易方法。该策略利用布林带和%B指标来识别市场中的超买和超卖状态,并在长期上升趋势中寻找潜在的买入机会。策略的核心思想是在价格处于相对低位时进行买入,并在价格达到相对高位时卖出,从而捕捉短期价格反弹带来的收益。
策略原理
该策略的运作原理基于以下几个关键要素:
趋势确认:使用200日简单移动平均线(SMA)作为长期趋势的参考。只有当收盘价高于200日SMA时,策略才会考虑进行交易,以确保与主要市场趋势保持一致。
超卖条件:利用%B指标来判断超卖状态。当%B值连续三天低于0.2时,被认为是达到了超卖条件。%B指标衡量了当前价格相对于布林带的位置,低于0.2表示价格接近下轨,处于潜在的超卖区域。
入场信号:当满足趋势确认和超卖条件时,在当日收盘时建立多头仓位。
出场信号:当%B值收盘高于0.8时,平仓离场。这表明价格已经接近布林带上轨,可能进入了超买区域。
策略优势
趋势跟随与反转结合:通过200日SMA的过滤,策略在捕捉短期反转的同时,也确保了与长期趋势保持一致,降低了逆势交易的风险。
客观的入场和出场条件:使用%B指标提供了明确的入场和出场信号,减少了主观判断带来的偏差。
均值回归原理:策略利用了金融市场中常见的均值回归现象,在价格偏离均值较远时进行交易,提高了盈利概率。
适应性强:布林带会根据市场波动性自动调整,使得策略能够适应不同的市场环境。
策略风险
假信号风险:在剧烈波动或横盘市场中,可能会产生频繁的假信号,导致频繁交易和资金损失。
趋势转折风险:虽然使用了200日SMA作为过滤,但在主要趋势转折点附近,策略可能会产生不准确的信号。
缺乏止损机制:基本策略中没有设置止损,这可能导致在市场持续走低时承受较大损失。
市场崩溃风险:在市场大幅下跌时,策略可能会频繁触发买入信号,造成严重的资金损失。
策略优化方向
引入动态止损:可以考虑使用ATR(平均真实波幅)来设置动态止损,以更好地控制风险。
优化入场条件:可以增加额外的技术指标,如RSI或MACD,来确认超卖状态,减少假信号。
调整%B阈值:可以根据不同的市场环境和交易品种,动态调整%B的入场和出场阈值。
加入成交量分析:结合成交量指标,可以提高信号的可靠性,特别是在判断市场反转时。
实现分批建仓和平仓:可以考虑在满足条件时分批进行交易,而不是一次性建立或平仓全部仓位。
总结
布林带超买超卖策略是一种结合了趋势跟随和均值回归的交易方法。通过利用布林带和%B指标,该策略旨在捕捉市场中的短期价格反弹机会。虽然策略具有客观性和适应性强的优点,但仍面临假信号和缺乏风险控制等挑战。通过引入动态止损、优化入场条件和结合其他技术指标,可以进一步提高策略的稳定性和盈利能力。traders应该在实盘交易前,充分测试和优化策略参数,以适应不同的市场环境和个人风险偏好。
/*backtest
start: 2019-12-23 08:00:00
end: 2024-09-24 08:00:00
period: 1d
basePeriod: 1d
exchanges: [{"eid":"Futures_Binance","currency":"BTC_USDT"}]
*/

// This Pine Script™ code is subject to the terms of the Mozilla Public License 2.0 at https://mozilla.org/MPL/2.0/
// © EdgeTools

//@version=5
strategy("Larry Connors %b Strategy (Bollinger Band)", overlay=false)

// Parameters for moving averages and Bollinger Bands
sma200 = ta.sma(close, 200)
length = 20  // Bollinger Band period
src = close  // Source for Bollinger Bands
mult = 2.0   // Bollinger Band standard deviation multiplier

// Calculate Bollinger Bands and %b
basis = ta.sma(src, length)
dev = ta.stdev(src, length)
upperBand = basis + mult * dev
lowerBand = basis - mult * dev
percentB = (close - lowerBand) / (upperBand - lowerBand)

// Conditions for the strategy
condition1 = close > sma200  // Condition 1: Close is above the 200-day moving average

// %b must be below 0.2 for the last three consecutive days
condition2 = percentB[2] < 0.2 and percentB[1] < 0.2 and percentB < 0.2

// Combined buy condition
buyCondition = condition1 and condition2

// Sell condition: %b closes above 0.8
sellCondition = percentB > 0.8

// Execute buy signal when buy condition is met
if buyCondition
    strategy.entry("Buy", strategy.long)

// Execute sell signal when the sell condition is met
if sellCondition
    strategy.close("Buy")

// Plotting Bollinger Bands
plot(upperBand, color=color.new(color.rgb(255, 0, 0), 50), title="Upper Bollinger Band")  // Red color with 50% transparency
plot(lowerBand, color=color.new(color.rgb(0, 255, 0), 50), title="Lower Bollinger Band")  // Green color with 50% transparency
plot(basis, color=color.rgb(0, 0, 255), title="Middle Bollinger Band")  // Blue color

// Plot %b value for visual confirmation
plot(percentB, color=color.rgb(128, 0, 128), linewidth=2, title="%b Value")  // Purple color

// Additional lines to improve visualization
hline(0.2, "Oversold (0.2)", color=color.rgb(255, 165, 0), linestyle=hline.style_dashed)  // Orange dashed line at 0.2
hline(0.8, "Overbought (0.8)", color=color.rgb(255, 105, 180), linestyle=hline.style_dashed)  // Pink dashed line at 0.8

// Set background color when a position is open
bgcolor(strategy.opentrades > 0 ? color.new(color.green, 50) : na)