概述
布林带均值回归交易策略与动态支撑是一种利用布林带指标来识别潜在买入机会并将中轨作为动态支撑水平进行获利了结的交易策略。该策略旨在当价格显示出向上突破中轨的迹象时进场做多,并在价格回落至中轨或从入场价格大幅下跌时退出头寸。
这种策略的核心理念基于均值回归的概念,即价格倾向于回归到其平均水平。在这种情况下,布林带的中轨代表了这个平均水平。通过等待价格突破中轨并获得确认,策略旨在提高交易的成功率,同时通过动态的出场条件来管理风险。
策略原理
该策略的运作原理如下:
入场条件:
- 当价格突破布林带中轨并在随后的两个交易日保持在中轨之上时,建立多头头寸。
- 这个条件有助于确保上涨趋势是持续的,而不仅仅是暂时的价格波动。
获利了结条件:
- 当价格从上方触及布林带中轨时,平仓多头头寸。
- 中轨在这里起到动态支撑位的作用,用于获利了结。
止损条件:
- 如果价格下跌超过入场价格的2%,平仓多头头寸。
- 这个止损条件有助于在价格大幅下跌时保护资金。
同日交易限制:
- 策略确保不会在同一天内既买入又卖出,除非触发止损条件。
- 这有助于避免不必要的交易和潜在的价格震荡。
策略使用20期简单移动平均线(SMA)作为布林带的中轨,上下轨分别为中轨加减2倍标准差。这些参数可以根据交易者的偏好和市场条件进行调整。
策略优势
动态适应市场:
- 布林带会根据市场波动性自动调整,使策略能够适应不同的市场环境。
清晰的入场和出场信号:
- 策略提供了明确的入场和出场规则,减少了主观判断的需要。
风险管理:
- 通过使用固定百分比止损,策略能够有效控制每笔交易的风险。
均值回归原理:
- 策略利用了金融市场中常见的均值回归现象,增加了盈利的可能性。
避免频繁交易:
- 通过要求价格保持在中轨之上两个交易日才入场,策略减少了虚假突破带来的不必要交易。
灵活性:
- 策略的参数(如布林带长度、标准差倍数、止损百分比)可以根据不同的市场和个人偏好进行调整。
策略风险
趋势市场表现不佳:
- 在强烈的趋势市场中,价格可能长期偏离均值,导致策略错过大的趋势行情。
过度交易风险:
- 在波动较大的市场中,价格可能频繁穿越中轨,导致过多的交易和较高的交易成本。
固定止损的局限性:
- 2%的固定止损可能在某些情况下过大或过小,不能很好地适应所有市场情况。
滑点和流动性风险:
- 在流动性较差的市场中,可能难以在精确的价格水平执行交易,影响策略表现。
参数敏感性:
- 策略的表现可能对布林带的参数设置较为敏感,需要仔细优化和回测。
假突破风险:
- 尽管有两日确认机制,仍可能出现假突破情况,导致不必要的交易。
策略优化方向
动态止损:
- 考虑使用基于市场波动性的动态止损,如ATR(平均真实波幅)倍数,以更好地适应不同的市场条件。
多时间框架分析:
- 引入更长期的时间框架分析,以确保交易方向与更大的市场趋势一致。
量化确认指标:
- 添加其他技术指标(如RSI或MACD)作为过滤器,以提高入场信号的质量。
动态参数优化:
- 实现布林带参数的动态调整,以适应不同的市场周期和波动性。
部分仓位管理:
- 引入分批建仓和平仓机制,以更好地管理风险和捕捉价格波动。
市场环境过滤:
- 加入市场环境识别机制,在不适合均值回归交易的市场环境中暂停交易。
止盈优化:
- 考虑在上轨附近设置额外的止盈条件,以捕捉更大的价格波动。
交易成本考虑:
- 在策略逻辑中加入交易成本的考虑,以避免过于频繁的小额交易。
总结
布林带均值回归交易策略与动态支撑是一种结合了技术分析和统计学原理的量化交易方法。通过利用布林带指标,该策略试图在价格偏离均值后捕捉其回归的机会,同时通过动态支撑和止损机制来管理风险。
这种策略的主要优势在于其清晰的交易规则和对市场波动性的动态适应能力。然而,它也面临着在强趋势市场中表现不佳以及可能过度交易的风险。
为了进一步提高策略的稳健性和适应性,可以考虑引入动态止损、多时间框架分析、额外的确认指标以及更复杂的仓位管理技术。同时,对策略参数进行持续的优化和回测也是至关重要的。
总的来说,这种策略为交易者提供了一个系统化的方法来捕捉价格波动并管理风险。然而,像所有交易策略一样,它并不是万能的,需要根据具体的市场条件和个人风险偏好进行调整和优化。在实际应用中,建议交易者在实盘交易之前进行充分的回测和模拟交易,以充分了解策略的特性和潜在风险。
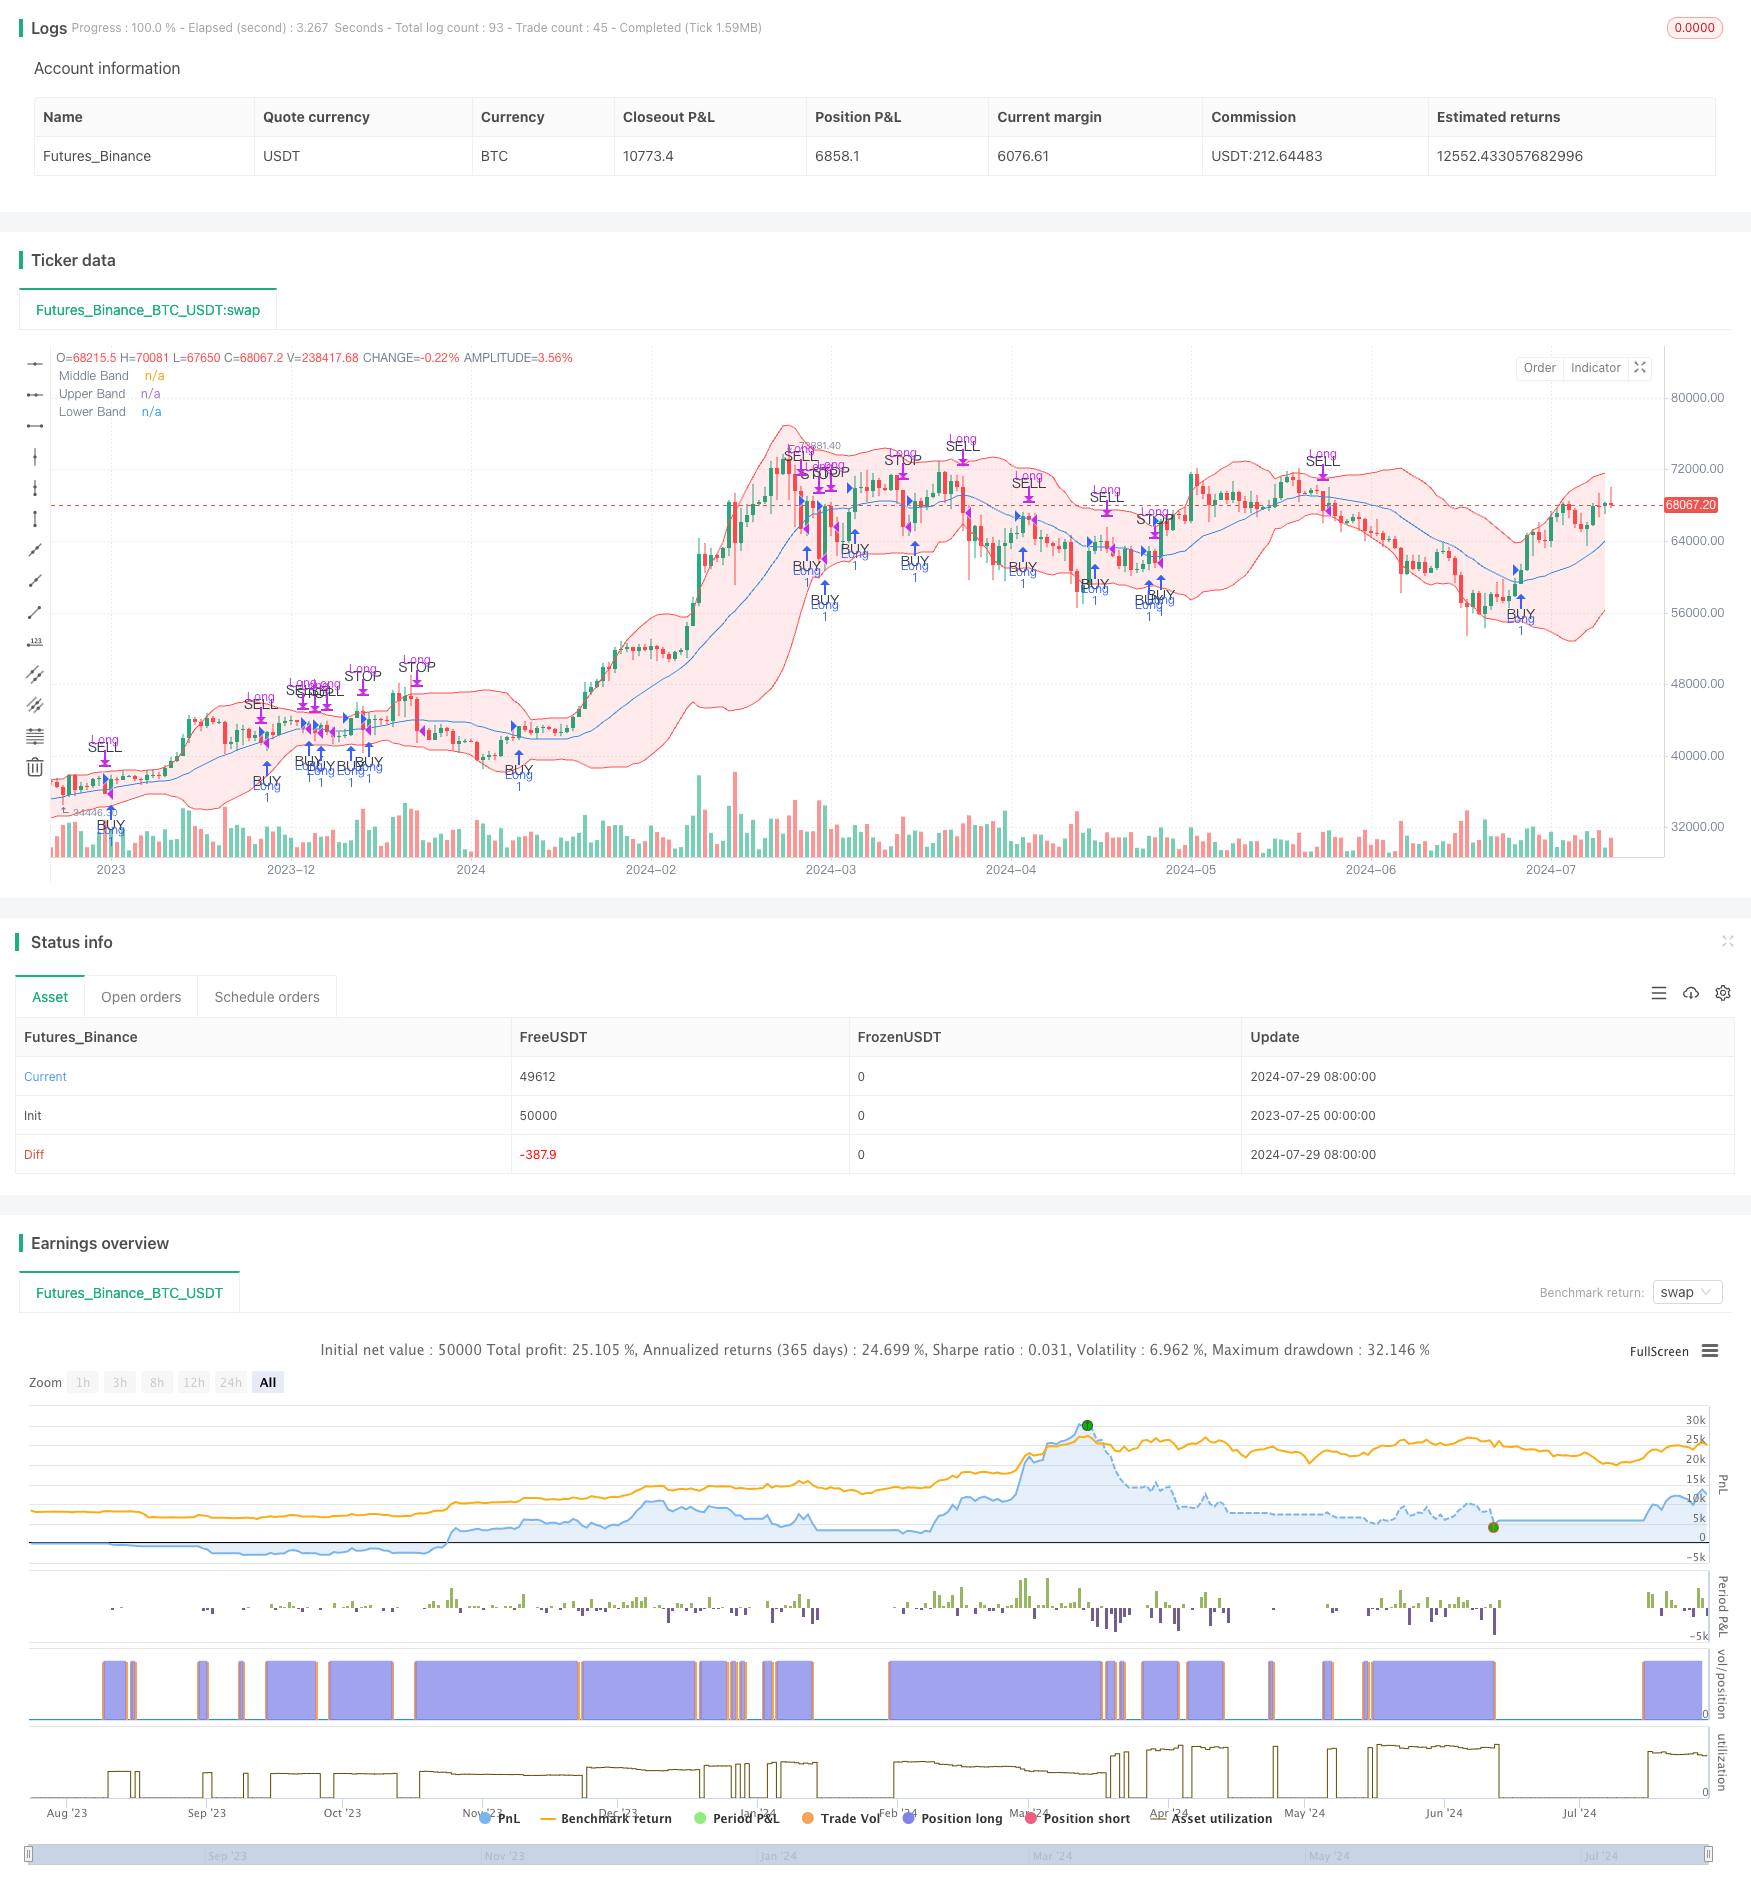
/*backtest
start: 2023-07-25 00:00:00
end: 2024-07-30 00:00:00
period: 1d
basePeriod: 1h
exchanges: [{"eid":"Futures_Binance","currency":"BTC_USDT"}]
*/

//@version=5
strategy("Mean Reversion Strategy with Bollinger Bands", overlay=true)

// Bollinger Bands settings
length = input.int(20, minval=1, title="Bollinger Bands Length")
src = input(close, title="Source")
mult = input.float(2.0, minval=0.1, title="Bollinger Bands Multiplier")

// Calculate Bollinger Bands
basis = ta.sma(src, length)
dev = mult * ta.stdev(src, length)
upper = basis + dev
lower = basis - dev

// Plot Bollinger Bands
plot(basis, title="Middle Band", color=color.blue)
p1 = plot(upper, title="Upper Band", color=color.red)
p2 = plot(lower, title="Lower Band", color=color.red)
fill(p1, p2, color=color.rgb(255, 0, 0, 90))

// Buy condition: Price crosses above the middle band
longCondition = ta.crossover(close, basis)

// Close condition: Price touches the middle band
closeCondition = ta.crossunder(close, basis)

// Emergency stop condition: Price drops below 2% of entry price
dropCondition = strategy.position_size > 0 and close < strategy.position_avg_price * 0.98

// Plot Buy/Sell Signals only on initial cross
plotshape(series=longCondition, location=location.belowbar, color=color.green, style=shape.triangleup, textcolor=color.black, text="BUY", size=size.small)
plotshape(series=closeCondition and not dropCondition, location=location.abovebar, color=color.red, style=shape.triangledown, textcolor=color.black, text="SELL", size=size.small)
plotshape(series=dropCondition, location=location.abovebar, color=color.red, style=shape.triangledown, textcolor=color.black, text="STOP", size=size.small)

// Track entry date to ensure no same-day buy/sell
var float entryPrice = na
var int entryYear = na
var int entryMonth = na
var int entryDay = na

// Strategy Logic
if (longCondition and (na(entryDay) or (year != entryYear or month != entryMonth or dayofmonth != entryDay)))
    strategy.entry("Long", strategy.long)
    entryPrice := close
    entryYear := year
    entryMonth := month
    entryDay := dayofmonth

if ((closeCondition or dropCondition) and strategy.position_size > 0 and (na(entryDay) or (year != entryYear or month != entryMonth or dayofmonth != entryDay or dropCondition)))
    strategy.close("Long")
    entryDay := na