概述
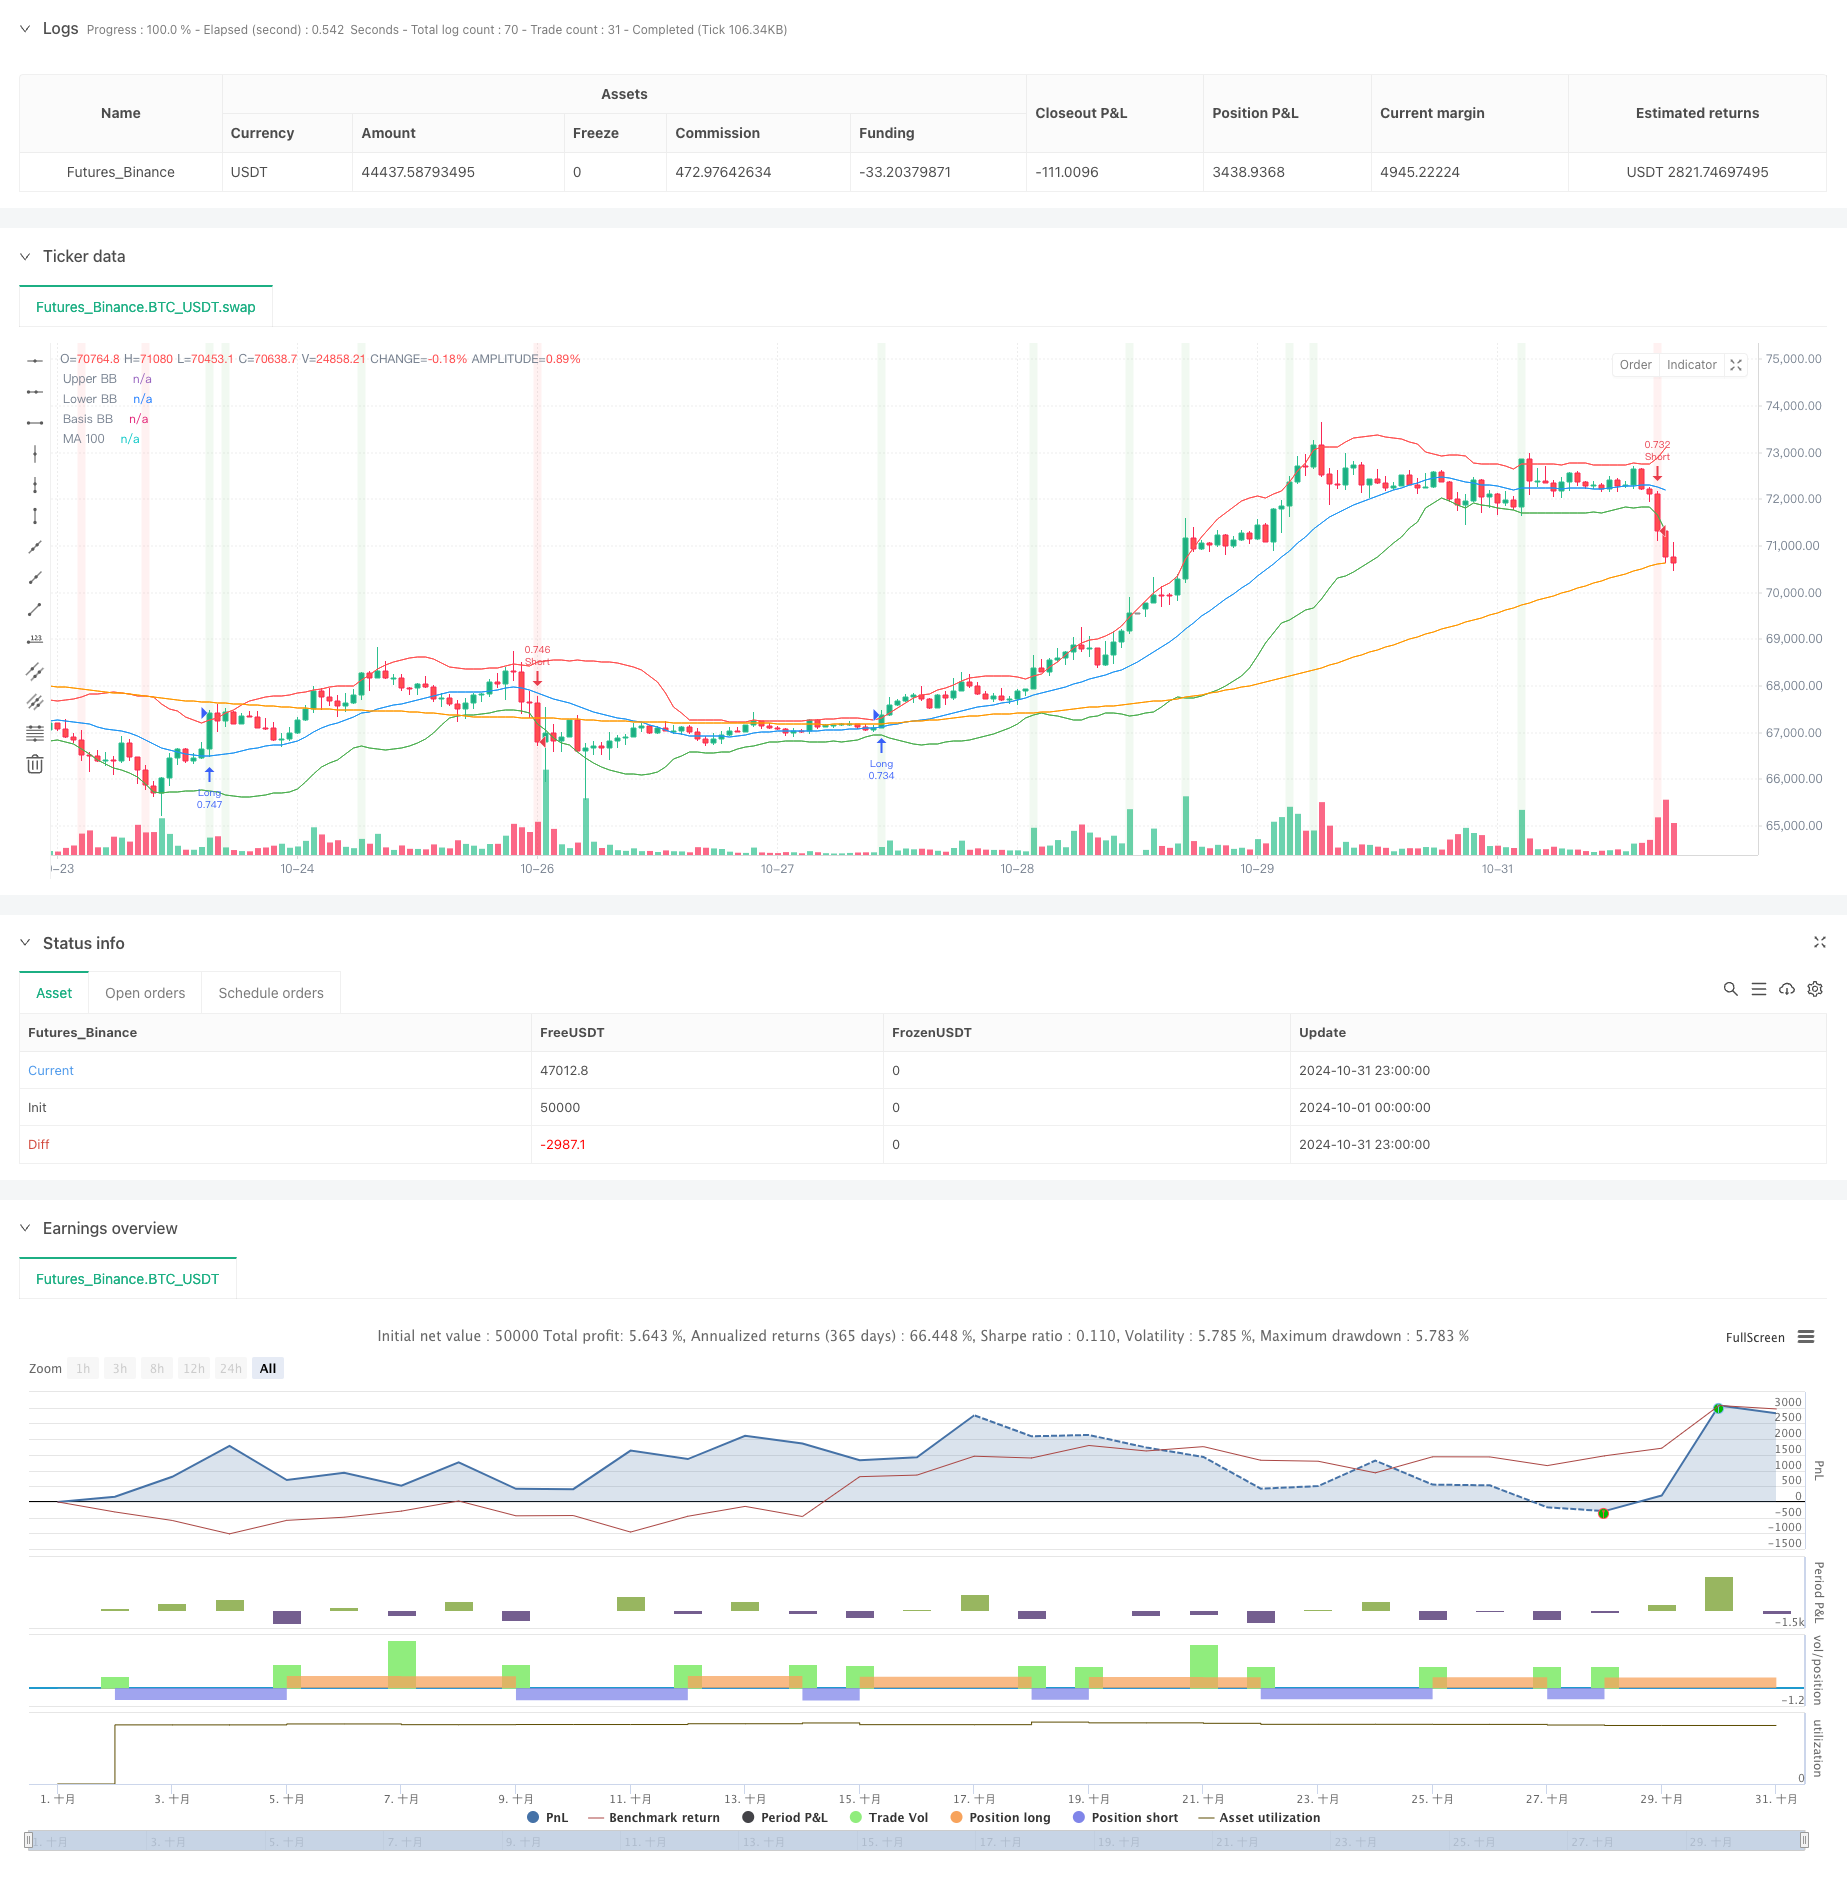
本策略是一个结合布林带突破和均线趋势的量化交易系统。策略通过监测价格与布林带上下轨的关系,结合100日均线作为趋势确认,实现市场机会的自动捕捉。系统采用动态持仓规模管理,根据账户权益自动调整交易数量,以实现风险的动态控制。
策略原理
策略的核心逻辑基于以下几个关键要素: 1. 使用20周期的布林带作为波动率通道,标准差倍数为2 2. 通过100日均线作为中长期趋势的确认指标 3. 当价格突破布林带上轨且前一周期未突破时,触发做多信号 4. 当价格跌破布林带下轨且前一周期未跌破时,触发做空信号 5. 持仓量根据当前账户权益动态计算,实现仓位的自适应调整 6. 在出现相反信号时自动平仓,确保及时止损
策略优势
- 自适应性强 - 布林带能够根据市场波动率自动调整通道宽度
- 风险可控 - 通过动态持仓量管理,确保风险与账户规模相匹配
- 趋势确认 - 结合均线走势,提高交易信号的可靠性
- 及时止损 - 设置了明确的平仓条件,避免过度亏损
- 双向交易 - 可以捕捉上涨和下跌行情,提高资金利用效率
- 代码简洁 - 策略逻辑清晰,便于维护和优化
策略风险
- 震荡市场可能产生频繁假突破,导致连续止损
- 布林带参数固定,可能不适应所有市场环境
- 未设置追踪止损,可能无法有效锁定盈利
- 均线周期较长,可能导致信号滞后
- 未考虑交易成本,实盘效果可能低于回测结果
策略优化方向
- 添加波动率过滤器,在低波动率环境下降低交易频率
- 引入动态止损机制,根据市场波动性调整止损位置
- 优化布林带参数,可考虑使用自适应周期
- 增加交易量和持仓时间等过滤条件
- 加入更多技术指标作为辅助确认
- 考虑设置最大回撤限制,增强风险控制
总结
该策略通过结合布林带和均线,构建了一个完整的量化交易系统。系统在保持逻辑简洁的同时,实现了信号生成、持仓管理和风险控制等核心功能。虽然存在一些需要优化的地方,但整体设计合理,具有实际应用价值。建议在实盘使用前进行充分的参数优化和回测验证,并根据具体市场特点进行针对性调整。
策略源码
/*backtest
start: 2024-10-01 00:00:00
end: 2024-10-31 23:59:59
period: 1h
basePeriod: 1h
exchanges: [{"eid":"Futures_Binance","currency":"BTC_USDT"}]
*/

//@version=5
strategy("BB Breakout with MA 100 Strategy", overlay=true)

// Parameter Bollinger Bands
length = input(20, title="BB Length")
stdDev = input(2.0, title="BB Standard Deviation")

// Hitung Bollinger Bands
basis = ta.sma(close, length)
dev = stdDev * ta.stdev(close, length)
upperBB = basis + dev
lowerBB = basis - dev

// Hitung Moving Average 100
ma100 = ta.sma(close, 100)

// Logika untuk sinyal beli dan jual
longCondition = close > upperBB and close[1] <= upperBB[1]
shortCondition = close < lowerBB and close[1] >= lowerBB[1]

// Menentukan ukuran posisi (jumlah lot)
size = strategy.equity / close // Menentukan ukuran posisi berdasarkan ekuitas saat ini

// Eksekusi order
if (longCondition)
    strategy.entry("Long", strategy.long, qty=size)

if (shortCondition)
    strategy.entry("Short", strategy.short, qty=size)

// Menutup posisi ketika kondisi terbalik
if (longCondition and strategy.position_size < 0)
    strategy.close("Short")

if (shortCondition and strategy.position_size > 0)
    strategy.close("Long")

// Plotting
plot(upperBB, color=color.red, title="Upper BB")
plot(lowerBB, color=color.green, title="Lower BB")
plot(basis, color=color.blue, title="Basis BB")
plot(ma100, color=color.orange, title="MA 100")

// Menambahkan informasi ke grafik
bgcolor(longCondition ? color.new(color.green, 90) : na, title="Buy Signal Background")
bgcolor(shortCondition ? color.new(color.red, 90) : na, title="Sell Signal Background")
相关推荐