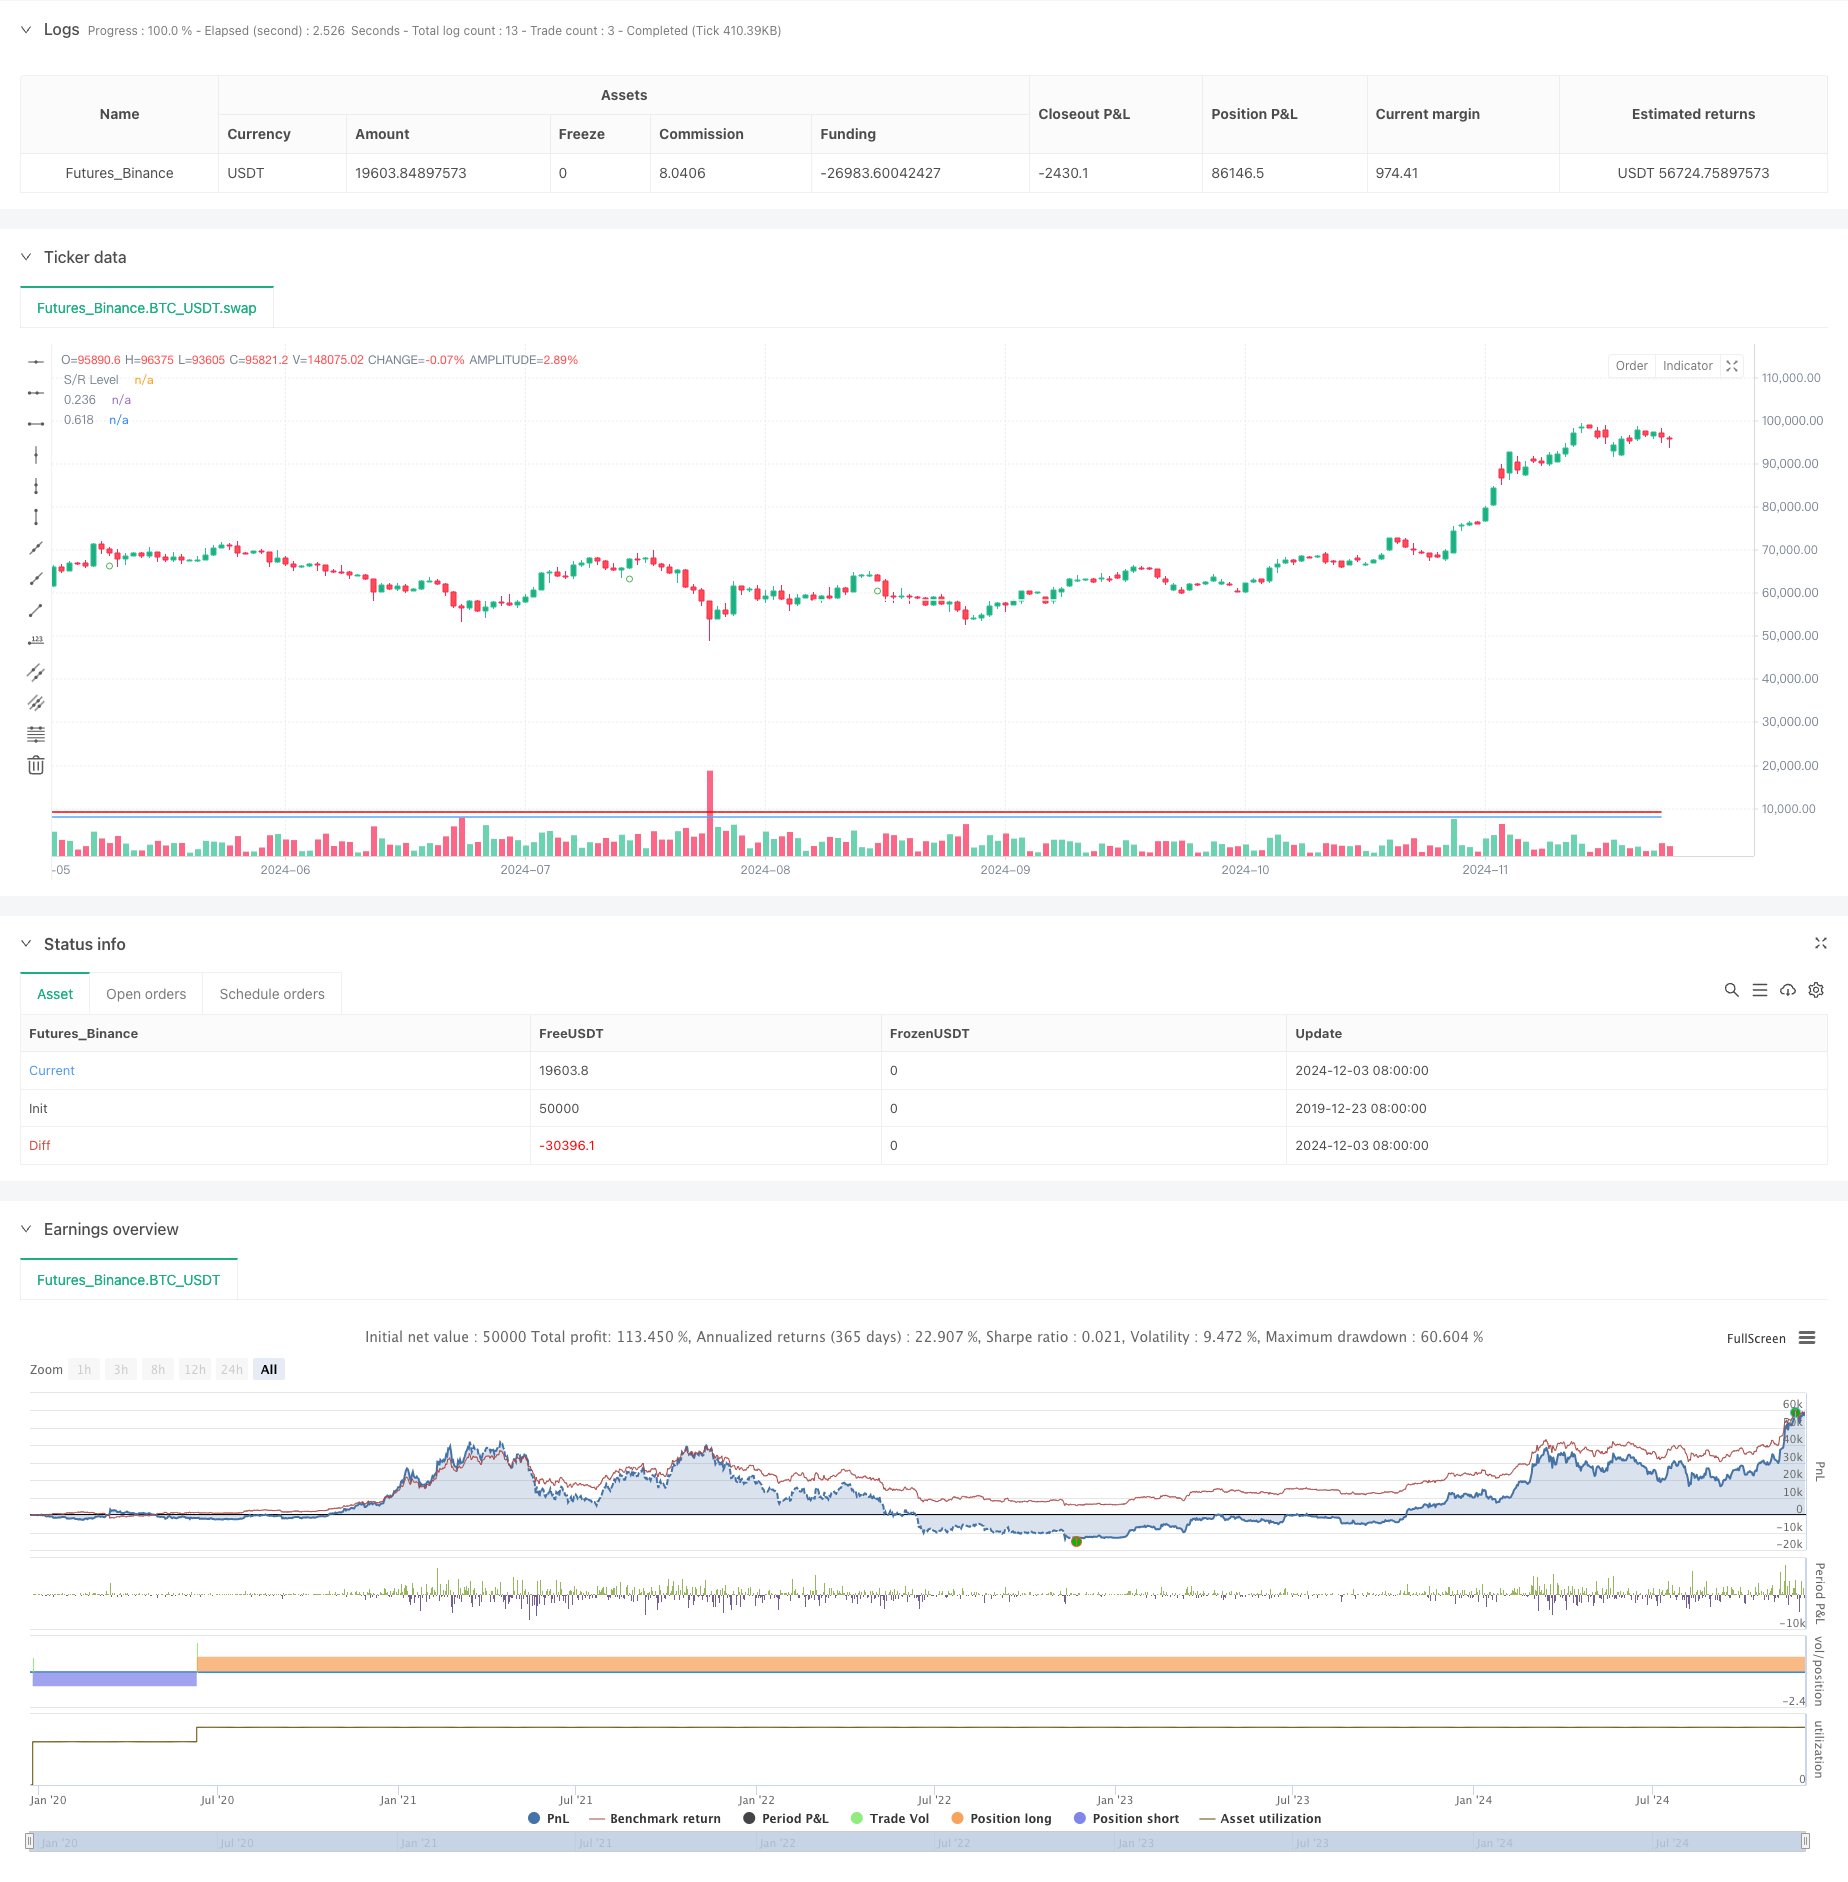
概述
这是一个结合了多重技术分析形态识别和支撑阻力水平的策略系统。该策略主要通过识别双底形态(亚当与夏娃底部形态)、结合斐波那契回调水平以及支撑阻力线来进行交易决策。策略的核心在于通过多维度的技术指标验证,提高交易信号的可靠性,同时利用支撑阻力水平作为风险控制的重要参考。
策略原理
策略采用三重验证机制进行交易决策:首先通过特定的算法识别双底形态,包括较为尖锐的”亚当底”和较为圆润的”夏娃底”;其次,利用斐波那契回调水平(0.618和1.618)来确定目标区域;最后,通过支撑阻力水平的验证来确认交易信号。交易信号的生成需要同时满足形态识别、斐波那契水平和支撑阻力水平的条件。具体而言,当支撑阻力水平高于1.618斐波那契延伸位时触发做多信号,当支撑阻力水平低于0.618斐波那契回调位时触发做空信号。
策略优势
- 多重验证机制大大提高了交易信号的可靠性
- 通过形态识别算法准确捕捉市场转折点
- 结合斐波那契水平提供了精确的目标区域
- 支撑阻力水平的验证增加了交易的安全性
- 策略参数可调节性强,适应不同市场环境
- 自动化程度高,减少主观判断带来的偏差
策略风险
- 形态识别可能存在滞后性,影响入场时机
- 在高波动市场中可能产生假信号
- 支撑阻力水平的有效性受市场环境影响
- 参数设置不当可能导致过度交易
- 需要较大的观察周期,可能错过一些快速机会
策略优化方向
- 引入波动率指标来过滤市场环境
- 增加趋势过滤器以提高形态识别的准确性
- 优化支撑阻力水平的计算方法
- 加入成交量指标作为辅助确认
- 开发更灵活的止损止盈机制
- 引入机器学习算法提高形态识别的准确率
总结
该策略通过综合运用形态识别、斐波那契水平和支撑阻力线等多重技术分析方法,构建了一个相对完善的交易系统。策略的优势在于其多重验证机制提供了较高的可靠性,而其可调节性也使其能够适应不同的市场环境。虽然存在一些固有风险,但通过持续优化和完善,该策略有望在实际交易中取得稳定的表现。通过加入更多的技术指标和优化算法,策略的性能还有很大的提升空间。
策略源码
/*backtest
start: 2019-12-23 08:00:00
end: 2024-12-04 00:00:00
period: 1d
basePeriod: 1d
exchanges: [{"eid":"Futures_Binance","currency":"BTC_USDT"}]
*/

//@version=5
strategy("Double Bottom with Support/Resistance Strategy - Aynet", overlay=true)

// Inputs
lookbackPeriod = input(21, "Lookback Period")
swingLowThreshold = input(1.5, "Swing Low Threshold")
fibLevel1 = input(0.618, "Fibonacci Level 1")
fibLevel3 = input(1.618, "Fibonacci Level 2")
srPeriod = input(21, "Support/Resistance Period")
srThreshold = input(3, "Support/Resistance Touch Points")

// Support/Resistance Function
get_sr_level(idx) =>
    var level = 0.0
    var count = 0

    if bar_index % srPeriod == 0
        highCount = 0
        lowCount = 0
        for i = 0 to srPeriod - 1
            if math.abs(high[i] - high) < (high * 0.001)
                highCount += 1
            if math.abs(low[i] - low) < (low * 0.001)
                lowCount += 1

        if highCount >= srThreshold
            level := high
            count := highCount
        if lowCount >= srThreshold
            level := low
            count := lowCount

    [level, count]

// Pattern Detection Functions
isSwingLow(src, left, right) =>
    isLow = true
    for i = 0 to left + right
        if src[i] < src[right]
            isLow := false
    isLow

getSpikeSharpness(index) =>
    priceRange = high[index] - low[index]
    bodyRange = math.abs(close[index] - open[index])
    sharpness = priceRange / bodyRange
    sharpness

// Pattern Variables
var float firstBottom = na
var float secondBottom = na
var bool isAdam = false
var bool isEve = false
var float level1Value = na
var float level3Value = na

// Pattern Detection
bottom = isSwingLow(low, lookbackPeriod, lookbackPeriod)
if bottom
    sharpness = getSpikeSharpness(0)
    if na(firstBottom)
        firstBottom := low
        isAdam := sharpness > swingLowThreshold
    else if low <= firstBottom * 1.02 and low >= firstBottom * 0.98
        secondBottom := low
        isEve := sharpness <= swingLowThreshold

// Calculate Fibonacci
if not na(secondBottom)
    highPoint = ta.highest(high, lookbackPeriod)
    fibDistance = highPoint - math.min(firstBottom, secondBottom)
    level1Value := math.min(firstBottom, secondBottom) + fibDistance * fibLevel1
    level3Value := math.min(firstBottom, secondBottom) + fibDistance * fibLevel3

// Get S/R Level
[srLevel, srCount] = get_sr_level(0)

// Trading Logic
longCondition = srLevel > level3Value
shortCondition = srLevel < level1Value

if longCondition
    strategy.entry("Long", strategy.long)

if shortCondition
    strategy.entry("Short", strategy.short)

// Reset Pattern
if high > ta.highest(high[1], lookbackPeriod)
    firstBottom := na
    secondBottom := na
    isAdam := false
    isEve := false
var table logo = table.new(position.top_right, 1, 1)
table.cell(logo, 0, 0, 'Double Bottom with Support/Resistance Strategy - Aynet', text_size=size.large, text_color=color.white)
// Plots
plot(level1Value, "0.236", color=color.rgb(245, 0, 0), style=plot.style_line)
plot(level3Value, "0.618", color=color.rgb(82, 166, 255), style=plot.style_line)
plot(srLevel, "S/R Level", color=color.white)

plotshape(bottom and not na(firstBottom) and na(secondBottom), "Adam Bottom", shape.circle, location.belowbar, color.green)
plotshape(bottom and not na(secondBottom), "Eve Bottom", shape.circle, location.belowbar, color.yellow)
相关推荐