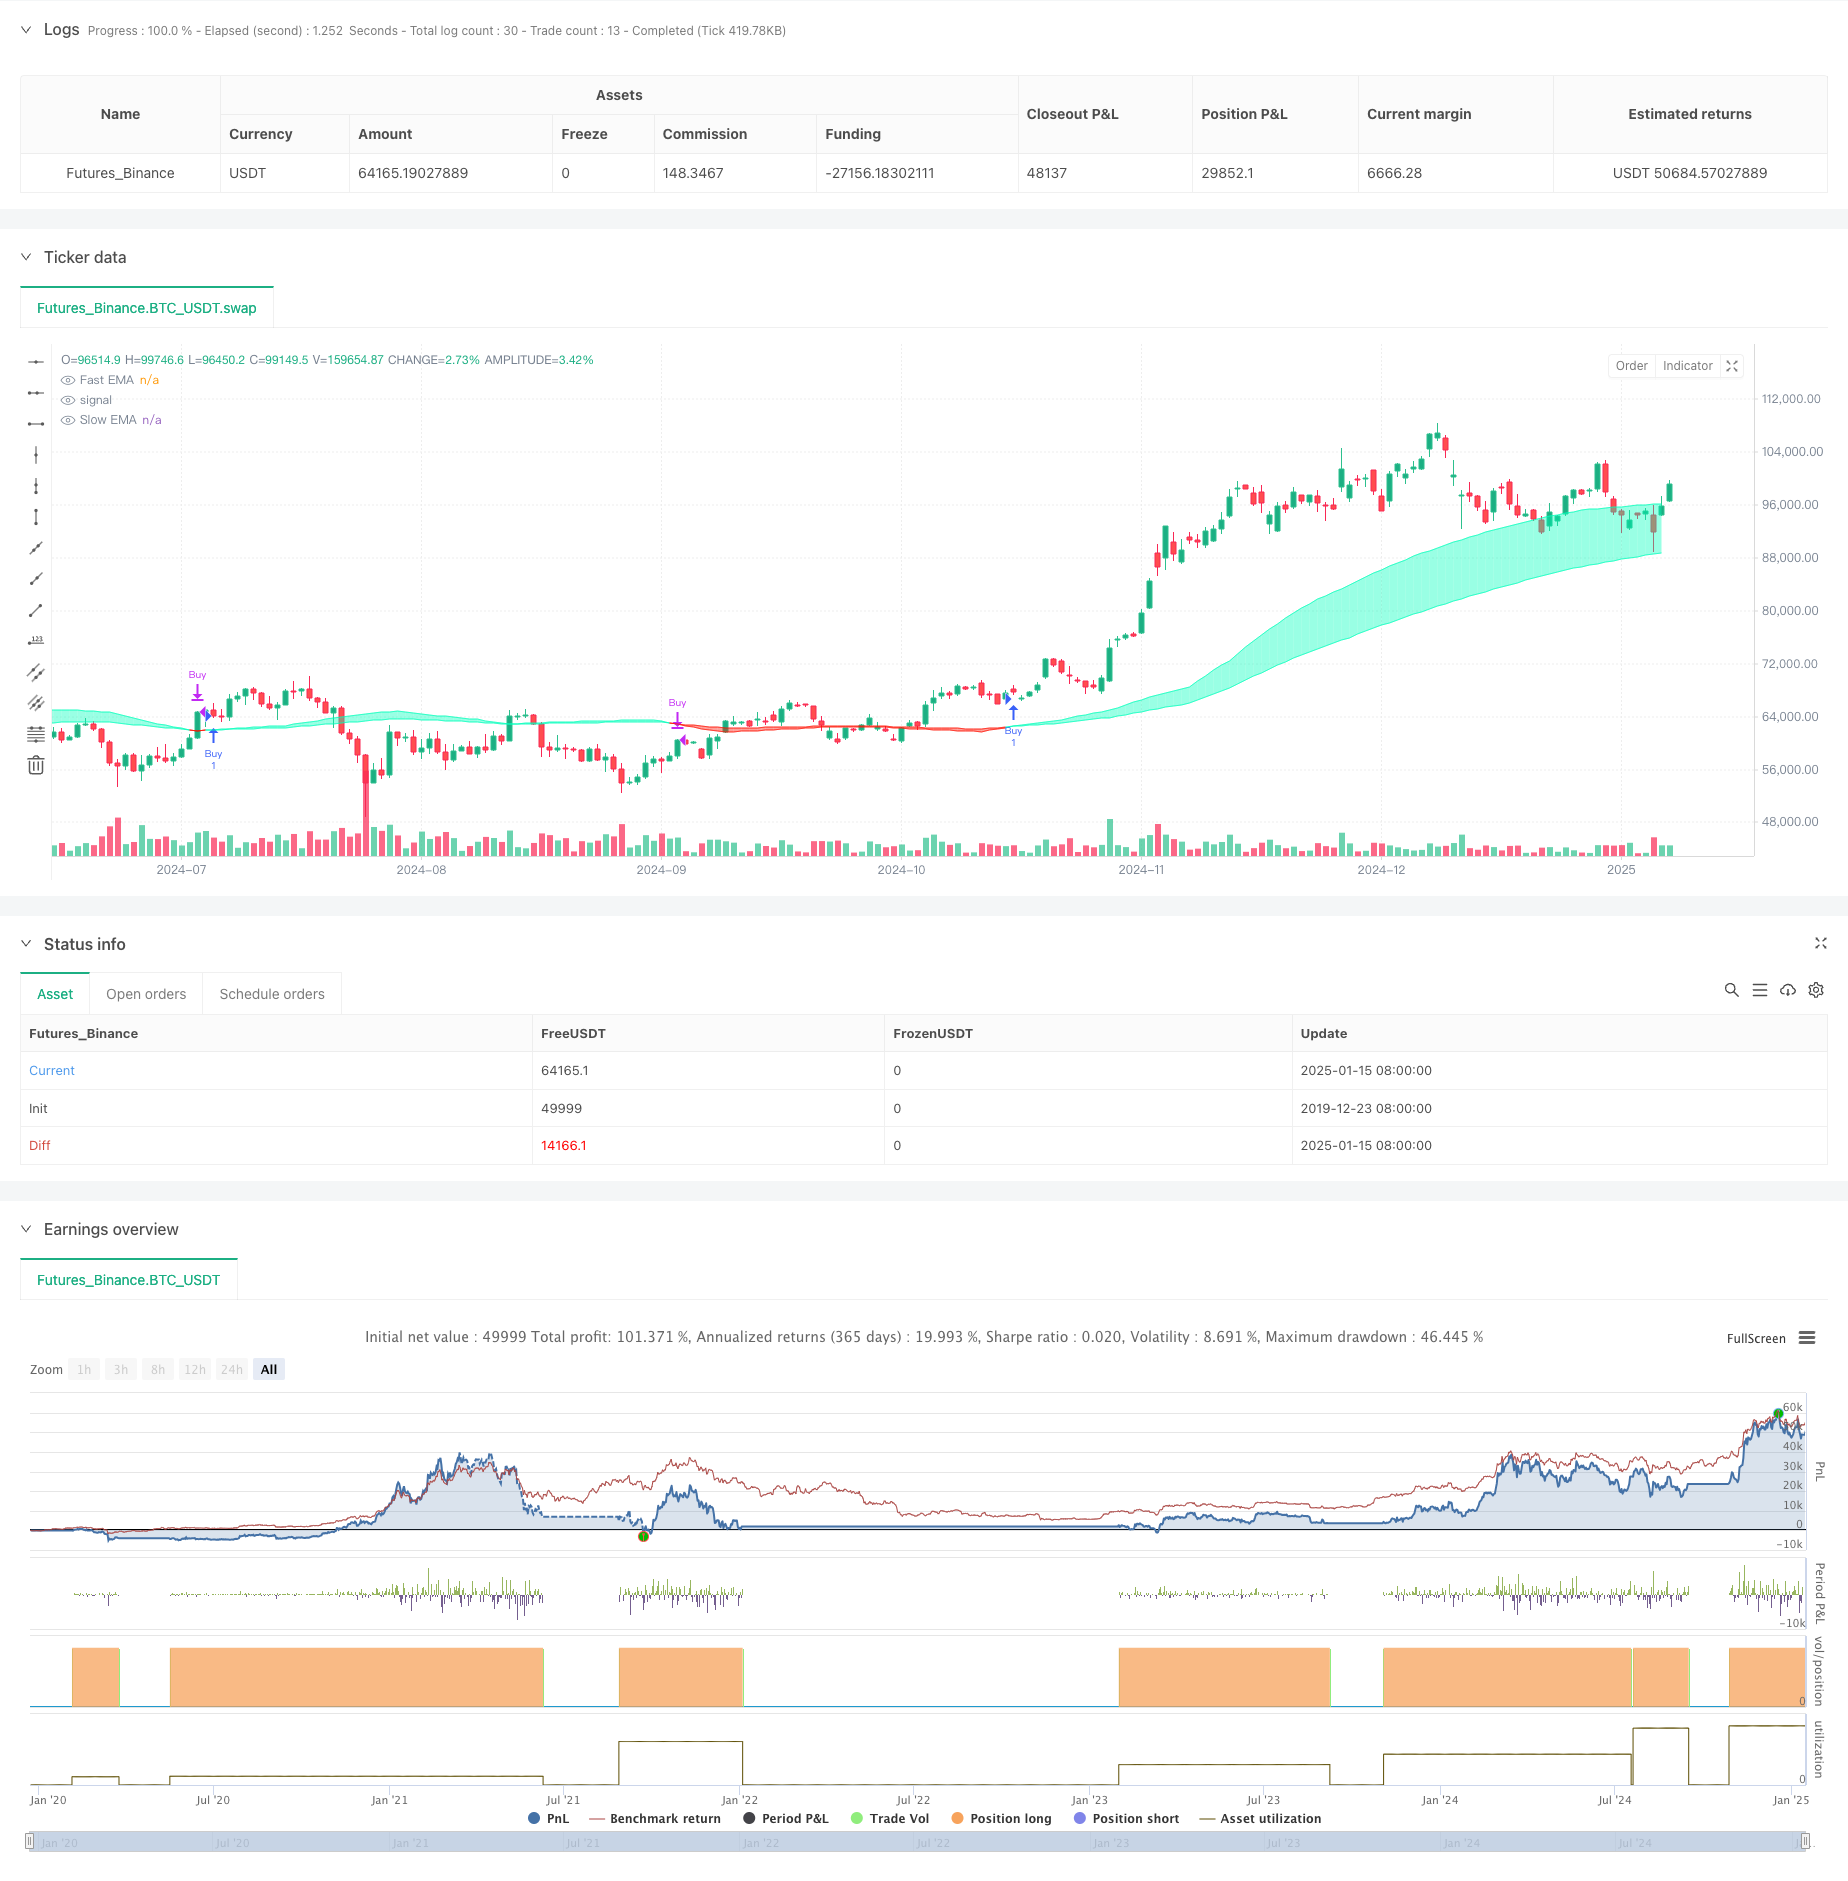
概述
该策略是一个基于流动性加权移动平均线的交易系统,通过监测价格波动与交易量的关系来衡量市场流动性,并在此基础上构建快速和慢速移动平均线。当快线上穿慢线时产生买入信号,下穿时产生卖出信号。策略特别关注异常流动性事件,通过数组记录关键价格点位,从而提供更精确的交易时机。
策略原理
策略的核心在于通过成交量与价格变动的比值来度量市场流动性。具体实现步骤如下: 1. 计算流动性指标:使用成交量除以收盘价与开盘价差的绝对值 2. 设定流动性边界:通过EMA和标准差识别异常流动性 3. 维护价格数组:记录突破流动性边界时的价格 4. 构建移动平均线:基于流动性事件计算快速和慢速EMA 5. 生成交易信号:通过均线交叉确定买卖点
策略优势
- 流动性感知:通过将成交量与价格变动相结合,能更准确地捕捉市场活跃度
- 异常事件跟踪:通过数组记录关键价格点位,避免错过重要市场机会
- 动态适应:EMA的权重递减特性使策略能更好地适应市场变化
- 风险控制:通过均线交叉提供明确的进出场信号
- 可定制性:多个参数可调整,适应不同市场环境
策略风险
- 参数敏感:策略效果强烈依赖于参数设置,需要持续优化
- 滞后性:基于移动平均线的系统具有固有的滞后性
- 市场依赖:在某些时间周期和市场中表现不稳定
- 假突破:可能在高波动时期产生错误信号
- 交易成本:频繁交易可能带来较高成本
策略优化方向
- 引入过滤器:
- 添加趋势确认指标如ADX
- 使用波动率指标过滤假信号
- 改进进场时机:
- 结合支撑阻力位
- 考虑成交量突破确认
- 优化参数选择:
- 实现自适应参数
- 根据市场状态动态调整
- 增强风险管理:
- 添加止损止盈机制
- 实现仓位管理系统
总结
这是一个融合流动性分析与技术指标的创新策略,通过监测市场流动性异常来优化传统的均线交叉系统。虽然在特定市场环境下表现出色,但仍需要进一步优化以提高稳定性和适用性。建议交易者在实盘使用前进行充分测试,并结合其他指标构建更完善的交易系统。
策略源码
/*backtest
start: 2019-12-23 08:00:00
end: 2025-01-16 00:00:00
period: 1d
basePeriod: 1d
exchanges: [{"eid":"Futures_Binance","currency":"BTC_USDT","balance":49999}]
*/

//Liquidity ignoring price location

//@version=6
strategy("Liquidity Weighted Moving Averages [AlgoAlpha]", overlay=true, commission_type=strategy.commission.percent, commission_value=0.1, slippage=3)

// Inputs
outlierThreshold = input.int(10, "Outlier Threshold Length")
fastMovingAverageLength = input.int(50, "Fast MA Length")
slowMovingAverageLength = input.int(100, "Slow MA Length")
start_date = input(timestamp("2018-01-01 00:00"), title="Start Date")
end_date = input(timestamp("2069-12-31 23:59"), title="End Date")

// Define liquidity based on volume and price movement
priceMovementLiquidity = volume / math.abs(close - open)

// Calculate the boundary for liquidity to identify outliers
liquidityBoundary = ta.ema(priceMovementLiquidity, outlierThreshold) + ta.stdev(priceMovementLiquidity, outlierThreshold)

// Initialize an array to store liquidity values when they cross the boundary
var liquidityValues = array.new_float(5)

// Check if the liquidity crosses above the boundary and update the array
if ta.crossover(priceMovementLiquidity, liquidityBoundary)
    array.insert(liquidityValues, 0, close)
    if array.size(liquidityValues) > 5
        array.pop(liquidityValues)

// Calculate the Exponential Moving Averages for the close price at the last liquidity crossover
fastEMA = ta.ema(array.size(liquidityValues) > 0 ? array.get(liquidityValues, 0) : na, fastMovingAverageLength)
slowEMA = ta.ema(array.size(liquidityValues) > 0 ? array.get(liquidityValues, 0) : na, slowMovingAverageLength)

// Trading Logic
in_date_range = true
buy_signal = ta.crossover(fastEMA, slowEMA) and in_date_range
sell_signal = ta.crossunder(fastEMA, slowEMA) and in_date_range

// Strategy Entry and Exit
if (buy_signal)
    strategy.entry("Buy", strategy.long)

if (sell_signal)
    strategy.close("Buy")

// Plotting
fastPlot = plot(fastEMA, color=fastEMA > slowEMA ? color.new(#00ffbb, 50) : color.new(#ff1100, 50), title="Fast EMA")
slowPlot = plot(slowEMA, color=fastEMA > slowEMA ? color.new(#00ffbb, 50) : color.new(#ff1100, 50), title="Slow EMA")

// Create a fill between the fast and slow EMA plots with appropriate color based on crossover
fill(fastPlot, slowPlot, fastEMA > slowEMA ? color.new(#00ffbb, 50) : color.new(#ff1100, 50))
相关推荐