概述
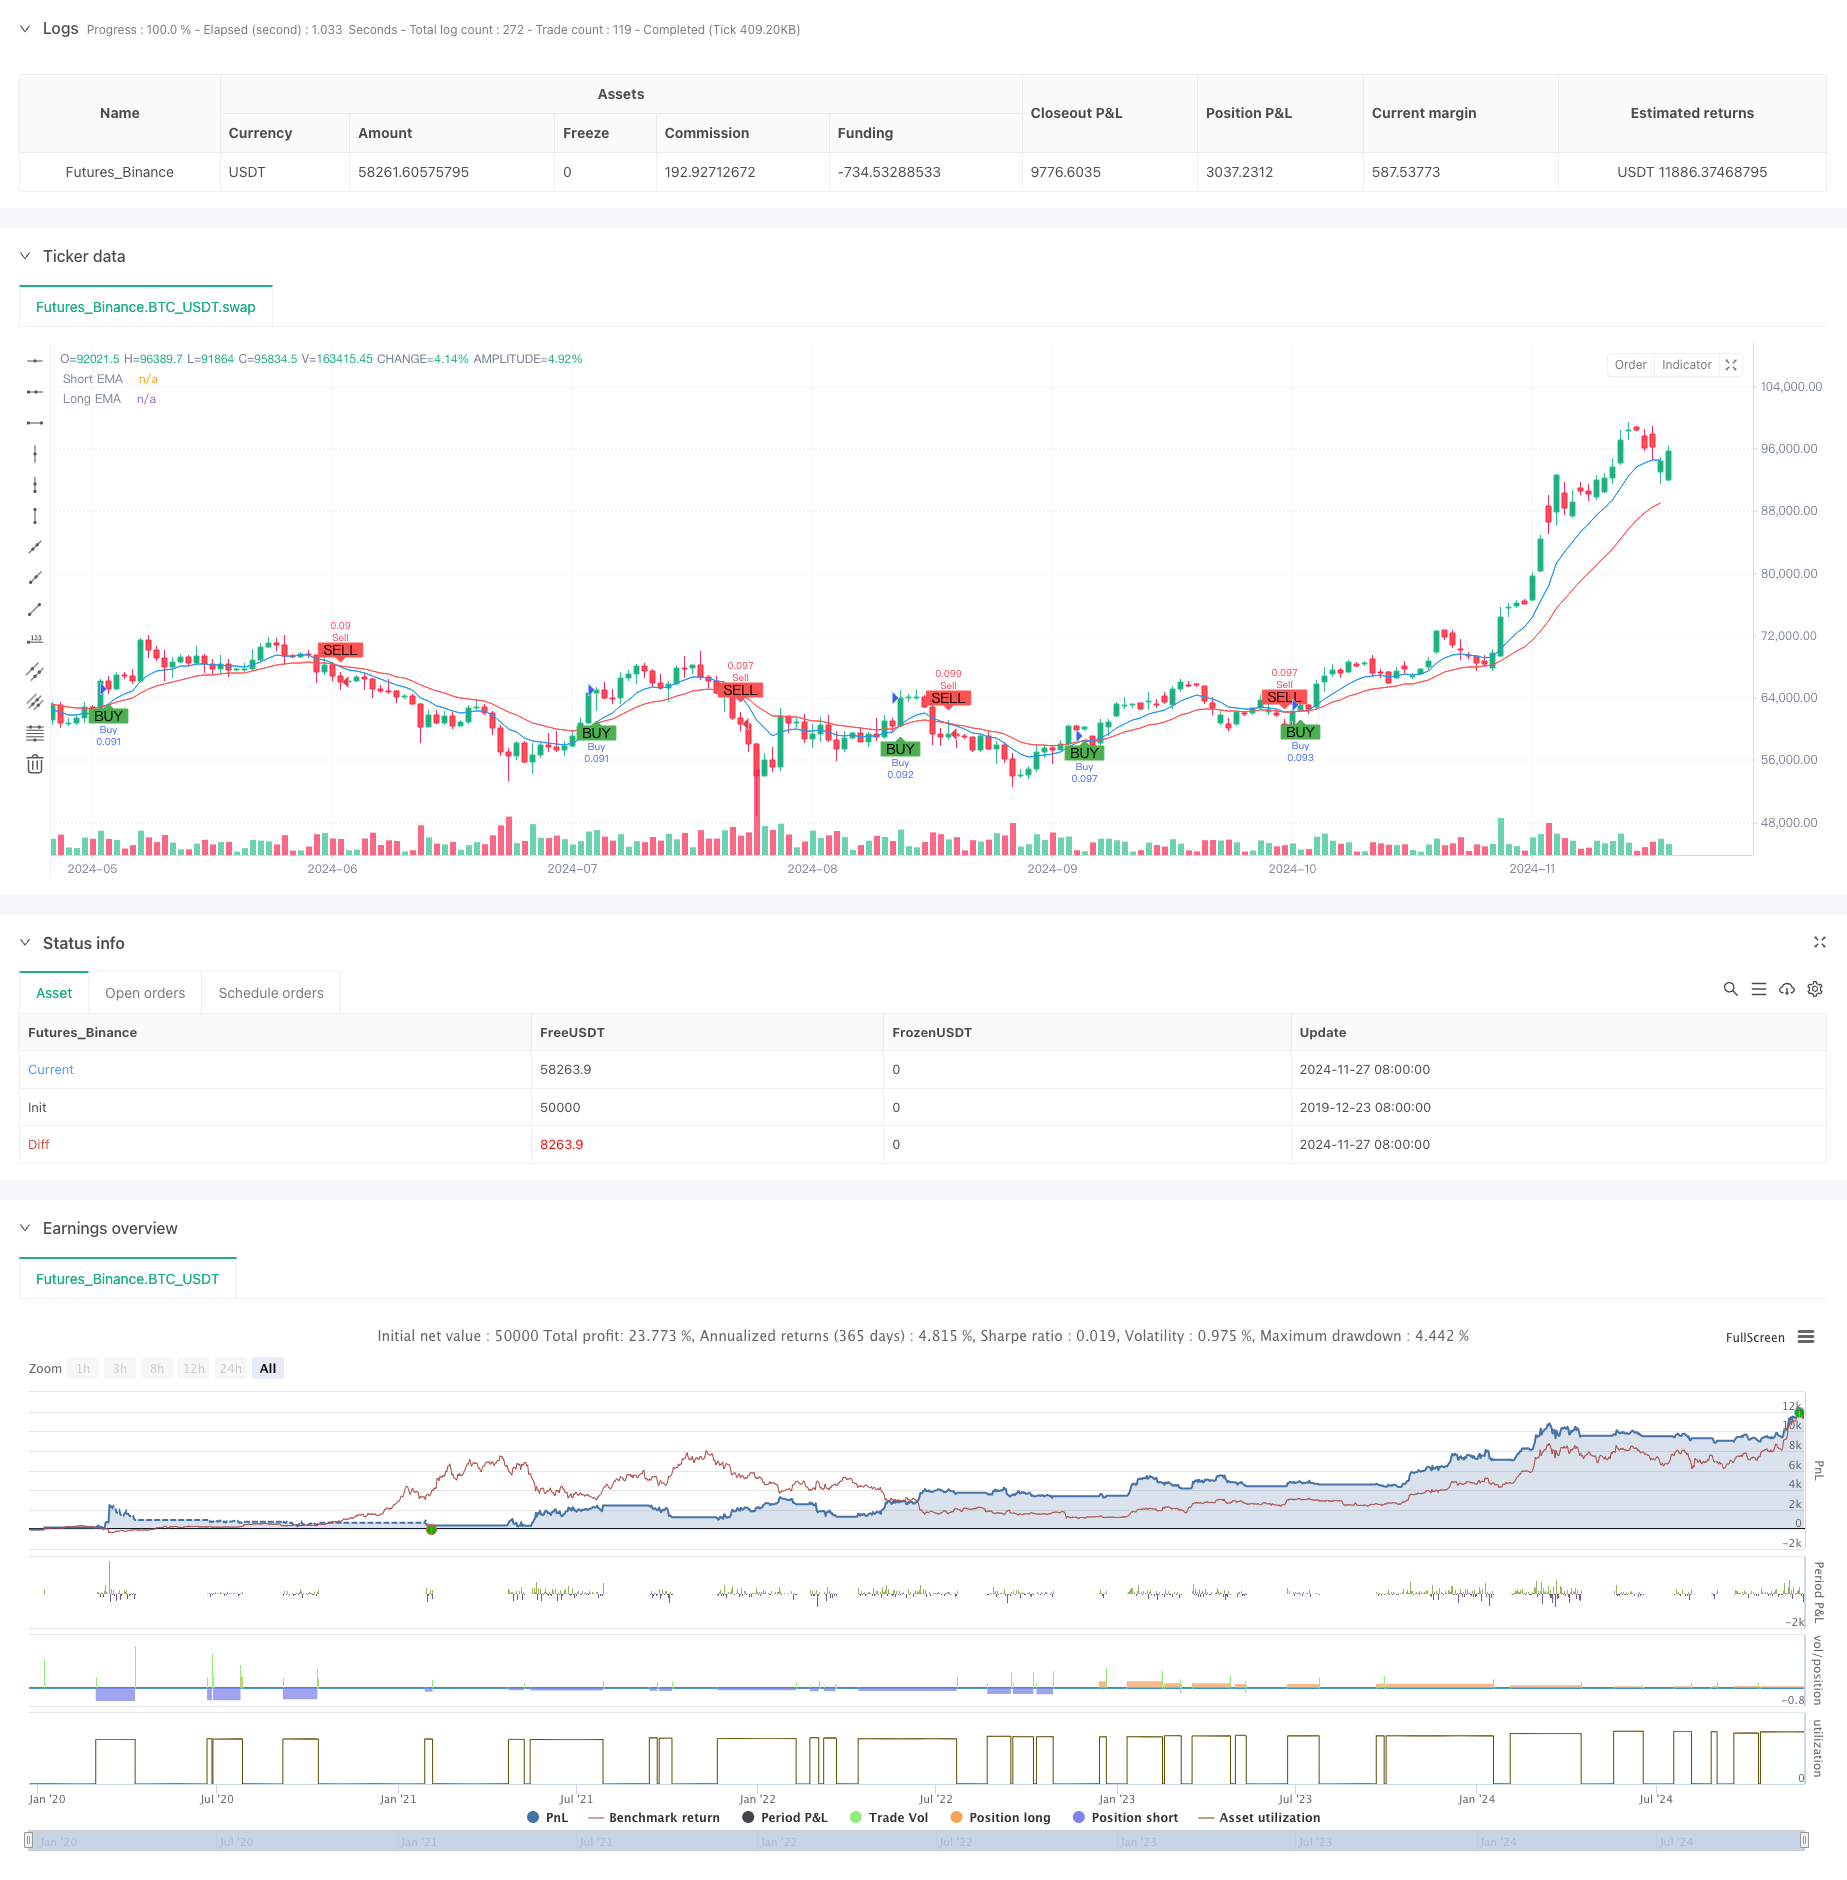
本策略是一个基于双均线交叉和RSI指标相结合的短期交易系统。策略采用9周期和21周期的指数移动平均线(EMA)作为趋势判断依据,同时结合相对强弱指标(RSI)作为动量确认工具,通过设定固定的止损和止盈来实现风险管理。该策略主要应用于5分钟级别的短线交易,特别适合波动性较大的市场环境。
策略原理
策略的核心逻辑基于两个技术指标的协同作用。首先,通过9周期EMA和21周期EMA的交叉来确定市场趋势方向,当短期EMA向上穿越长期EMA时,视为上涨趋势确立;当短期EMA向下穿越长期EMA时,视为下跌趋势确立。其次,使用RSI指标进行动量确认,通过判断RSI是否处于超买超卖区域来过滤交易信号。策略在开仓时设置1%的止损和2%的止盈,以实现风险收益比为1:2的交易管理。
策略优势
- 信号明确: 通过均线交叉和RSI确认的双重过滤机制,能够有效减少虚假信号。
- 风险可控: 采用固定百分比的止损止盈设置,使每笔交易的风险预期清晰可控。
- 自动化程度高: 策略逻辑清晰,参数可调整性强,便于实现自动化交易。
- 适应性强: 策略可以适应不同的市场环境,特别是在趋势明确的市场中表现出色。
- 操作简单: 入场和出场条件明确,便于交易者执行和跟踪。
策略风险
- 震荡市风险: 在横盘震荡市场中可能产生频繁的虚假信号,导致连续止损。
- 滑点风险: 在5分钟周期的短线交易中,可能面临较大的滑点风险。
- 固定止损风险: 采用固定百分比止损可能不适合所有市场环境,在波动性特别大的市场中可能止损过于密集。
- 系统性风险: 当市场出现重大事件时,固定的止损可能无法有效保护资金。
策略优化方向
- 动态止损优化: 可以考虑根据ATR指标动态调整止损距离,使止损更贴合市场波动特征。
- 时间过滤: 增加交易时间段过滤,避开波动剧烈或流动性不足的时段。
- 趋势强度确认: 可以添加ADX指标来确认趋势强度,只在趋势明确时进行交易。
- 仓位管理优化: 可以根据市场波动性和账户净值动态调整仓位大小。
- 市场环境识别: 增加市场环境判断机制,在不同市场条件下采用不同的参数设置。
总结
该策略通过结合均线交叉和RSI指标,构建了一个相对完整的短线交易系统。策略的优势在于信号明确、风险可控,但也存在一些需要优化的空间。通过增加动态止损、时间过滤等机制,可以进一步提高策略的稳定性和盈利能力。总的来说,这是一个基础扎实、逻辑清晰的交易策略,适合作为短线交易的基础框架进行进一步优化和完善。
策略源码
/*backtest
start: 2019-12-23 08:00:00
end: 2024-11-28 08:00:00
period: 1d
basePeriod: 1d
exchanges: [{"eid":"Futures_Binance","currency":"BTC_USDT"}]
*/

//@version=5
strategy("abo 3llash - EMA + RSI Strategy", overlay=true, default_qty_type=strategy.percent_of_equity, default_qty_value=10)

// Parameters
emaShortLength = input.int(9, title="Short EMA Length")
emaLongLength = input.int(21, title="Long EMA Length")
rsiLength = input.int(14, title="RSI Length")
rsiOverbought = input.int(70, title="RSI Overbought Level")
rsiOversold = input.int(30, title="RSI Oversold Level")
stopLossPercent = input.float(1, title="Stop Loss Percentage") / 100
takeProfitPercent = input.float(2, title="Take Profit Percentage") / 100

// Calculating EMAs and RSI
emaShort = ta.ema(close, emaShortLength)
emaLong = ta.ema(close, emaLongLength)
rsi = ta.rsi(close, rsiLength)

// Buy and Sell Conditions
buyCondition = ta.crossover(emaShort, emaLong) and rsi < rsiOverbought
sellCondition = ta.crossunder(emaShort, emaLong) and rsi > rsiOversold

// Plotting the EMAs
plot(emaShort, title="Short EMA", color=color.blue)
plot(emaLong, title="Long EMA", color=color.red)

// Generating buy and sell signals on the chart
plotshape(series=buyCondition, title="Buy Signal", location=location.belowbar, color=color.green, style=shape.labelup, text="BUY")
plotshape(series=sellCondition, title="Sell Signal", location=location.abovebar, color=color.red, style=shape.labeldown, text="SELL")

// Strategy Execution
if (buyCondition)
    strategy.entry("Buy", strategy.long)
    // Set Stop Loss and Take Profit for Buy
    stopLossLevel = close * (1 - stopLossPercent)
    takeProfitLevel = close * (1 + takeProfitPercent)
    strategy.exit("Take Profit/Stop Loss", from_entry="Buy", stop=stopLossLevel, limit=takeProfitLevel)

if (sellCondition)
    strategy.entry("Sell", strategy.short)
    // Set Stop Loss and Take Profit for Sell
    stopLossLevel = close * (1 + stopLossPercent)
    takeProfitLevel = close * (1 - takeProfitPercent)
    strategy.exit("Take Profit/Stop Loss", from_entry="Sell", stop=stopLossLevel, limit=takeProfitLevel)
相关推荐