ডিমার্ক সেটআপ সূচক
লেখক:চাওঝাং, তারিখ: ২০২২-০৫-৩১ ১৯ঃ২৯ঃ৫০ট্যাগঃবাউলিস্টমন্দা
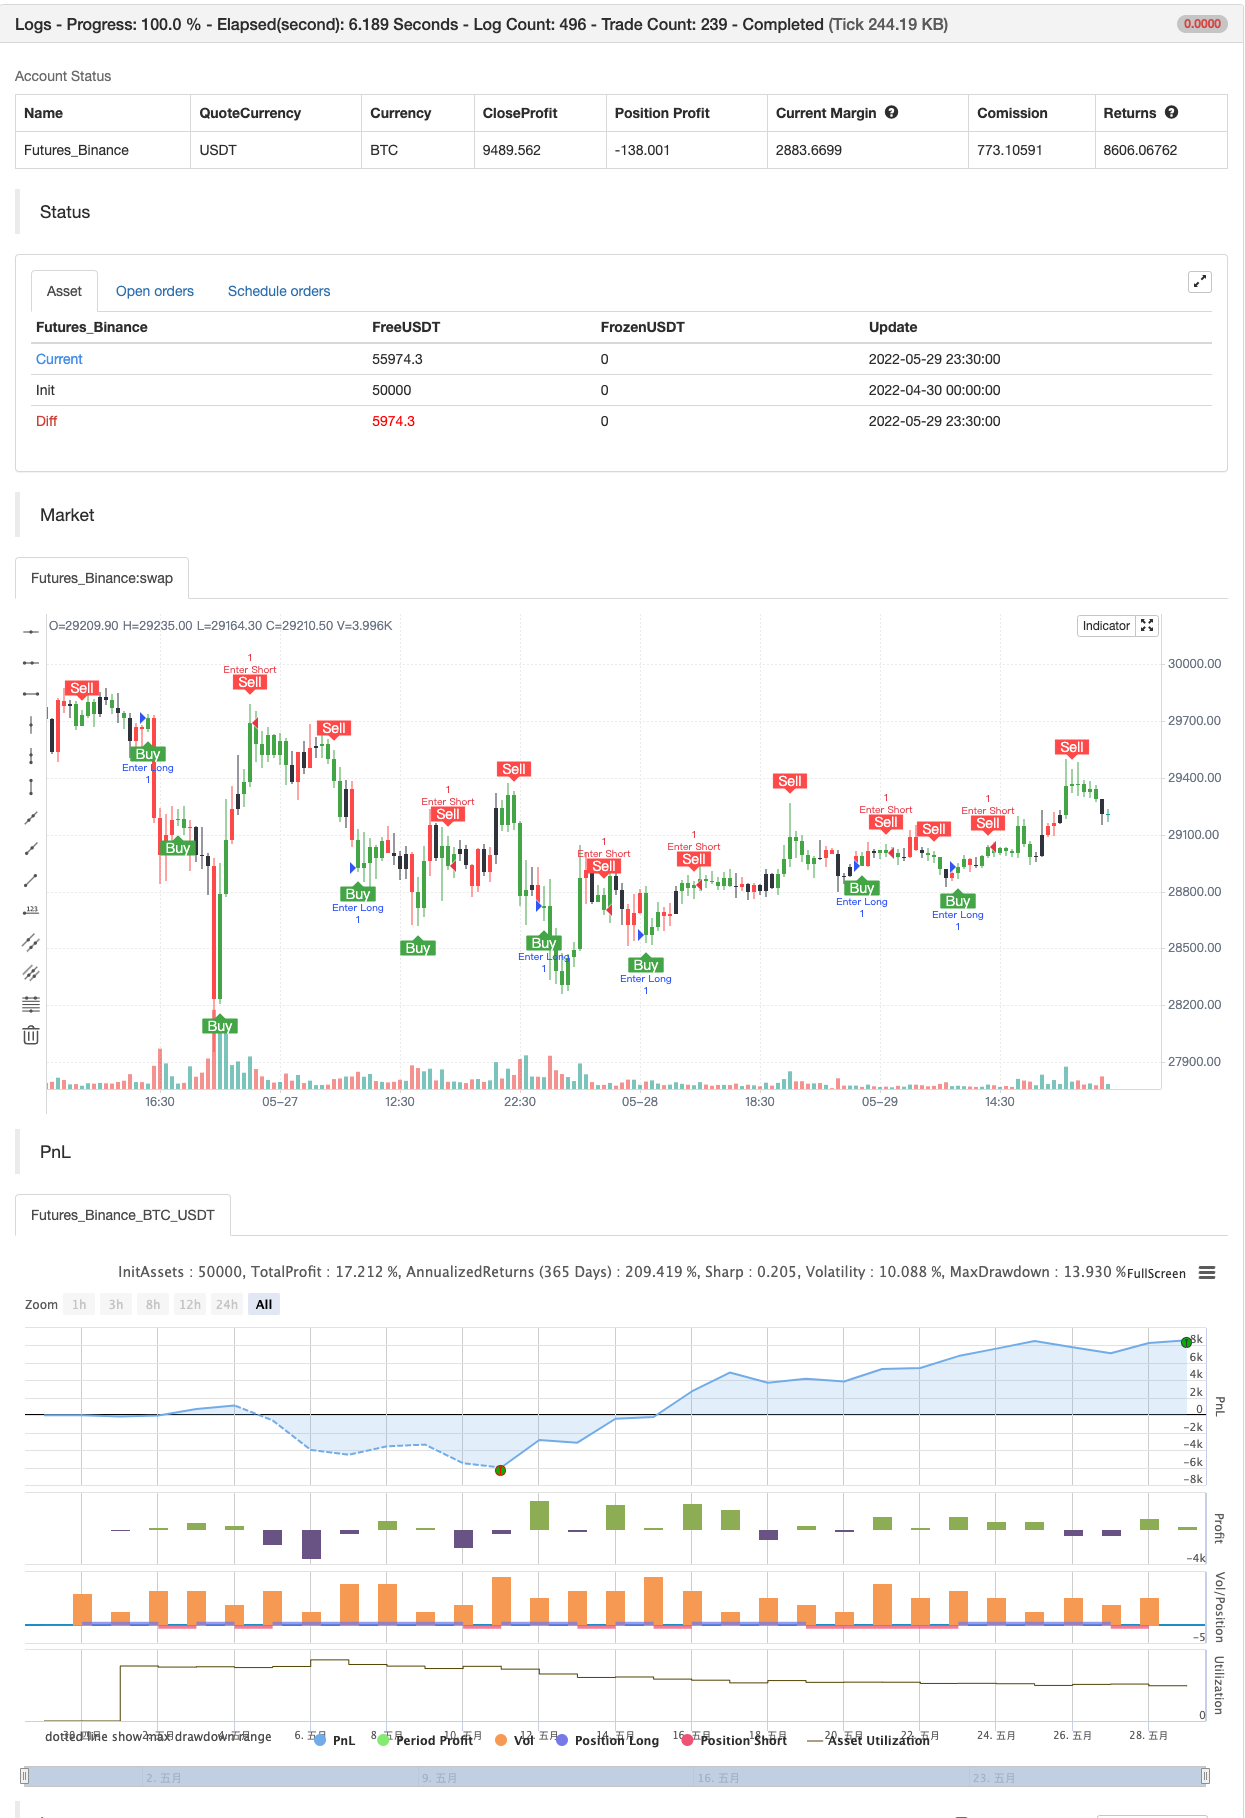
সেটআপ সূচকটি টম ডেমার্ক দ্বারা তৈরি করা হয়েছিল এবং এটি তার ক্রমিক সূচকের অনেকগুলি পদক্ষেপের মধ্যে একটি যা আমি পরে প্রকাশ করব। আপনারা সকলেই আমার ডেমার্ক বিপরীতমুখী পয়েন্ট স্ক্রিপ্টটি পছন্দ করেছেন এবং এই সূচকটি তার সাথে খুব অনুরূপ। এই সূচকটি ছোট প্রবণতা বিপরীতমুখী হওয়ার জন্য ডিজাইন করা হয়েছিল এবং আপনি আমার উদাহরণ চার্টে দেখতে পাচ্ছেন, এটি আরও অনেকগুলি কিনুন এবং বিক্রয় সংকেত দেয়। অবশ্যই সবগুলি নিখুঁত নয় তবে এটি সামগ্রিকভাবে ছোট মূল্য বিপরীতমুখীতা সনাক্ত করতে বেশ ভাল কাজ করে। এই সূচকটি দাম বিপরীতমুখী পয়েন্টগুলি নির্ধারণের জন্য নির্দিষ্ট সময়ের জন্য বিদ্যমান ডাউনট্রেন্ড বা আপট্রেন্ডগুলি সন্ধান করে।
আপনি যদি এটি পছন্দ করেন তবে আমাকে জানান এবং আমি আরও ডিমার্ক সূচক বা কমপক্ষে আমার সংস্করণগুলি প্রকাশ করতে থাকব। আপনি যদি অন্য কোনও সূচক প্রকাশ করতে চান তবে আমাকে জানান!
ব্যাকটেস্ট

/*backtest
start: 2022-04-30 00:00:00
end: 2022-05-29 23:59:00
period: 30m
basePeriod: 15m
exchanges: [{"eid":"Futures_Binance","currency":"BTC_USDT"}]
*/

//@version=4
// Copyright (c) 2019-present, Franklin Moormann (cheatcountry)
// Demark Setup Indicator [CC] script may be freely distributed under the MIT license.
study("Demark Setup Indicator [CC]", overlay=true)

inp = input(title="Source", type=input.source, defval=close)
res = input(title="Resolution", type=input.resolution, defval="")
rep = input(title="Allow Repainting?", type=input.bool, defval=false)
bar = input(title="Allow Bar Color Change?", type=input.bool, defval=true)
src = security(syminfo.tickerid, res, inp[rep ? 0 : barstate.isrealtime ? 1 : 0])[rep ? 0 : barstate.isrealtime ? 0 : 1]
length = input(title="Length", type=input.integer, defval=4, minval=1)

uCount = 0, dCount = 0
for i = 0 to length - 1
    uCount := uCount + (nz(src[i]) > nz(src[i + length]) ? 1 : 0)
    dCount := dCount + (nz(src[i]) < nz(src[i + length]) ? 1 : 0)

dsi = dCount == length ? 1 : uCount == length ? -1 : 0

sig = dsi > 0 or uCount > dCount ? 1 : dsi < 0 or dCount > uCount ? -1 : 0
dsiColor = sig > 0 ? color.green : sig < 0 ? color.red : color.black
alertcondition(crossover(dsi, 0), "Buy Signal", "Bullish Change Detected")
alertcondition(crossunder(dsi, 0), "Sell Signal", "Bearish Change Detected")
barcolor(bar ? dsiColor : na)
plotshape(crossover(dsi, 0), "Buy", shape.labelup, location.belowbar, color.green, text="Buy", textcolor=color.white)
plotshape(crossunder(dsi, 0), "Sell", shape.labeldown, location.abovebar, color=color.red, text="Sell", textcolor=color.white)


if crossover(dsi, 0)
    strategy.entry("Enter Long", strategy.long)
else if crossunder(dsi, 0)
    strategy.entry("Enter Short", strategy.short)
- জিগজ্যাগ পিএ কৌশল V4.1
- ব্রেকড ফ্র্যাক্টাল: কারো ভাঙা স্বপ্ন আপনার লাভ!
- গলিত মোমবাতি
- সুইং হাইস/লস এবং ক্যান্ডেল প্যাটার্নস
- মার্কভ চেইন সম্ভাব্যতা রূপান্তর অবস্থা পরিমাণগত লেনদেন কৌশল
- সাপোর্ট-রেসিস্ট্যান্স ব্রেকআউট
- দ্বিগুণ সময় ফ্রেম প্রবণতা বিপরীত কে লাইন আকৃতির পরিমাণগত লেনদেন কৌশল
- EMA-এর সমান্তরাল এবং স্বল্প-সীমা সংকেত কৌশল
- RSI ডায়নামিক ব্যাংকের বিপরীত পরিমাণগত কৌশল এবং উদ্বায়ী হার অপ্টিমাইজেশান মডেল
- লিনিয়ার রিগ্রেশন সিল্যান্সের উপর ভিত্তি করে গতিশীল বাজার অবস্থা সনাক্তকরণ কৌশল
- ইট সংখ্যা (রেঙ্কো)
- রেঞ্জ ফিল্টার কিনুন এবং বিক্রয় 5 মিনিট [কৌশল]
- ইনভার্টেড হ্যামার - বর্ধিত বিকল্প
- TUE ADX/MACD কনফ্লুয়েন্স V1.0
- টুইন রেঞ্জ ফিল্টার
- এসএআর - উচ্চ এবং নিম্ন
- সঠিক সুইং ট্রেডিং সিস্টেম
- রৈখিক প্রবণতা
- ফিবোনাচি টাইমিং প্যাটার্ন
- ডারভাস বক্স কিনুন বিক্রি করুন
- Bollinger Bands স্টোকাস্টিক RSI Extreme
- AK MACD BB INDICATOR V ১.০০
- প্যারাবোলিক এসএআর
- আরএসআই ডিভার্জেন্স ইন্ডিকেটর
- OBV MACD সূচক
- পিভট ট্রেন্ড
- মূল্য বৈষম্য কৌশল v1.0
- সাপোর্ট-রেসিস্ট্যান্স ব্রেকআউট
- ঢাল অনুকূলনামূলক চলমান গড়
- ডেল্টা-আরএসআই দোলক কৌশল