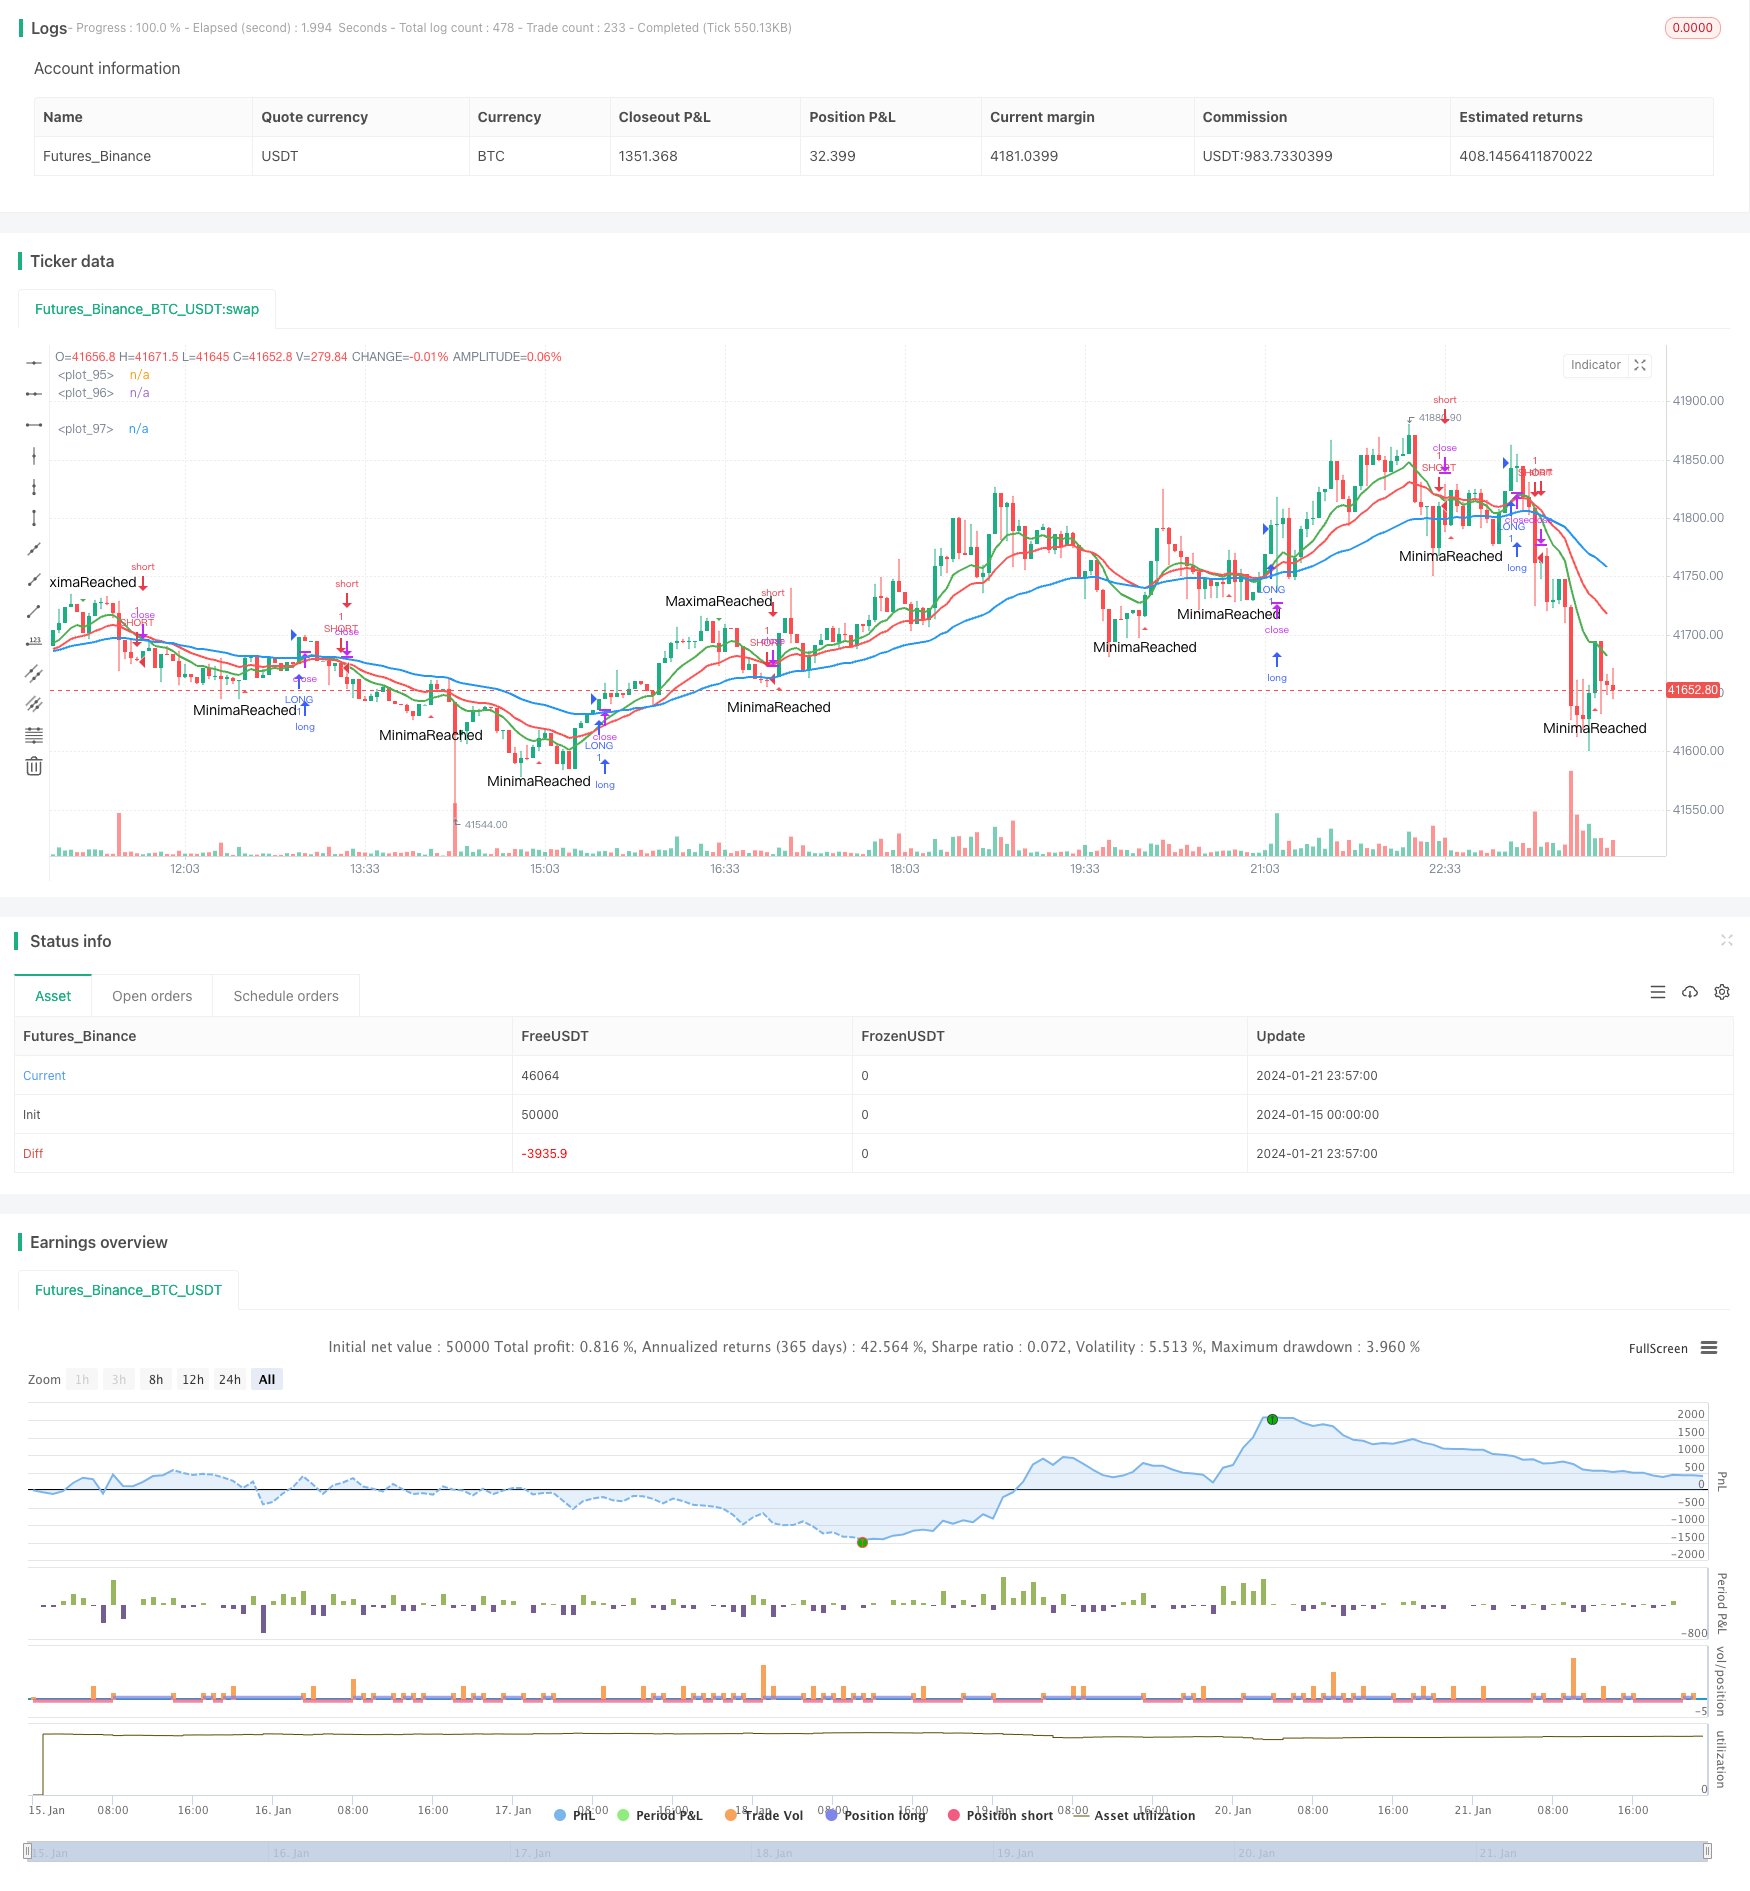
একটি এক্সপোনেন্সিয়াল মুভিং গড় উপর ভিত্তি করে একটি গতি ক্রসওভার কৌশল
লেখক:চাওঝাং, তারিখঃ ২০২৪-০১-২৩ ১৪ঃ১৮ঃ২৬ট্যাগঃ

সারসংক্ষেপ
এই কৌশলটি বিভিন্ন সময়ের সাথে ইএমএ রেখাগুলির ক্রসওভারের ভিত্তিতে প্রবণতার দিক নির্ধারণ করে এবং সেই অনুযায়ী দীর্ঘ এবং সংক্ষিপ্ত সংকেত উত্পন্ন করে। এটি মূলত দুটি চলমান গড় ব্যবহার করে - 10-দিনের ইএমএ এবং 20-দিনের ইএমএ। যখন 10-দিনের ইএমএ 20-দিনের ইএমএর নীচে অতিক্রম করে, তখন একটি সংক্ষিপ্ত সংকেত সক্রিয় হয়। যখন 10-দিনের ইএমএ 20-দিনের ইএমএর উপরে অতিক্রম করে, তখন একটি দীর্ঘ সংকেত সক্রিয় হয়। এই কৌশলটি মাঝারি মেয়াদী ট্রেডিং কৌশলগুলির অন্তর্গত।
কৌশলগত নীতি
কৌশলটি 10 দিনের ইএমএ এবং 20 দিনের ইএমএ সহ দুটি ইএমএ লাইন ব্যবহার করে। ইএমএ লাইনগুলি কার্যকরভাবে দামের প্রবণতা প্রতিফলিত করতে পারে। যখন স্বল্পমেয়াদী ইএমএ লাইন দীর্ঘমেয়াদী ইএমএ লাইনের উপরে অতিক্রম করে, এটি নির্দেশ করে যে দামের প্রবণতা হ্রাস থেকে উত্থান দিকে ঘুরছে, যা একটি দীর্ঘ সংকেত। যখন স্বল্পমেয়াদী ইএমএ লাইন দীর্ঘমেয়াদী ইএমএ লাইনের নীচে অতিক্রম করে, এটি নির্দেশ করে যে দামের প্রবণতা উত্থান থেকে পতন দিকে ঘুরছে, যা একটি সংক্ষিপ্ত সংকেত।
কৌশলটি কিছু ট্রেডিং সংকেত ফিল্টার করার জন্য মূল্যের ওঠানামা সর্বাধিক এবং সর্বনিম্ন মানগুলিও একত্রিত করে। মূল্যের ওঠানামা একটি নির্দিষ্ট ডিগ্রীতে পৌঁছানোর পরেই ট্রেডিং সংকেতগুলি ট্রিগার হয়। এটি কিছু মিথ্যা সংকেতকে কিছু ডিগ্রীতে ফিল্টার করতে পারে।
বিশেষত, যখন সর্বোচ্চ এবং সর্বনিম্ন মানগুলি পৌঁছে যায় তখন সময়টি ট্র্যাক করে, কৌশলটি মূল্যের প্রবণতা তৈরি হয়েছে কিনা তা বিচার করে। প্রকৃত ট্রেডিং সংকেতগুলি কেবলমাত্র সর্বোচ্চ বা সর্বনিম্ন মানগুলি কিছু সময়ের জন্য স্থায়ী হওয়ার পরে সক্রিয় হয়।
সুবিধা বিশ্লেষণ
এই কৌশলটির নিম্নলিখিত সুবিধা রয়েছে:
- ট্রেন্ডের দিকনির্দেশনা নির্ধারণের জন্য ইএমএ লাইন ব্যবহার করে বাজারের গতিবিধি কার্যকরভাবে ট্র্যাক করতে পারে
- বিভিন্ন সময়কালের EMA লাইন একত্রিত করা মধ্যমেয়াদী ব্যবসায়ের সুযোগগুলি ক্যাপচার করতে পারে
- চরম মান দ্বারা সংকেত ফিল্টার কিছু গোলমাল অপসারণ এবং হারানো ট্রেডিং সুযোগ এড়াতে পারেন
- যুক্তি সহজ এবং পরিষ্কার, সহজেই বোঝা যায় এবং সংশোধন করা যায়
- পরামিতিগুলি বিভিন্ন পণ্য এবং বাণিজ্যিক অগ্রাধিকারের জন্য সামঞ্জস্য করা যেতে পারে, যা শক্তিশালী অভিযোজনযোগ্যতা দেখায়
ঝুঁকি বিশ্লেষণ
এই কৌশলটির সাথে কিছু ঝুঁকিও রয়েছেঃ
- ইএমএ লাইনগুলি নিজেই বিলম্বিত প্রভাব ফেলে, স্বল্পমেয়াদী প্রবণতা বিপরীত হতে পারে
- গোলমাল ফিল্টারিং অসম্পূর্ণ, কিছু ভুল ব্যবসা ঘটতে পারে
- বিভিন্ন বাজারের পরিবেশের সাথে সামঞ্জস্য রেখে পরামিতিগুলি যথাযথভাবে সামঞ্জস্য করতে হবে
ঝুঁকিগুলি নিম্নলিখিত উপায়ে হ্রাস করা যেতে পারেঃ
- ইএমএ লাইন বিলম্ব সমস্যা এড়াতে সংকেত নিশ্চিতকরণের জন্য অন্যান্য সূচক যোগ করা
- সিগন্যালের নির্ভরযোগ্যতা উন্নত করার জন্য চরম মান ফিল্টারিং শর্ত অপ্টিমাইজ করা
- কৌশল অপ্টিমাইজ করার জন্য ব্যাকটেস্টের ফলাফলের উপর ভিত্তি করে পরামিতিগুলি সামঞ্জস্য করা
উন্নতির জন্য নির্দেশাবলী
কৌশলটি নিম্নলিখিত দিকগুলিতে আরও অনুকূলিত করা যেতে পারেঃ
- সিগন্যালের নির্ভুলতা উন্নত করতে MACD এবং KD এর মতো অন্যান্য প্রযুক্তিগত সূচক অন্তর্ভুক্ত করুন
- নির্দিষ্ট পণ্যগুলির জন্য EMA লাইন পরামিতিগুলিকে আরও ভালভাবে উপযুক্ত করুন
- দামের ওঠানামা আরও ভালভাবে বিচার করার জন্য চরম মানের পরামিতিগুলি পরিমার্জন করুন
- ট্রেড প্রতি সর্বোচ্চ ক্ষতি নিয়ন্ত্রণের জন্য স্টপ লস মেকানিজম যোগ করুন
- অভিযোজনযোগ্যতা মূল্যায়নের জন্য বিভিন্ন পণ্যগুলিতে কৌশলটি পরীক্ষা করুন
সংক্ষিপ্তসার
সংক্ষেপে, এই ইএমএ ক্রসওভার কৌশলটি একটি সহজ এবং ব্যবহারিক প্রবণতা অনুসরণকারী কৌশল। এটি মূল প্রবণতা দিক নির্ধারণের জন্য ইএমএ লাইন ব্যবহার করে, ট্রেডিং সিদ্ধান্ত গ্রহণের জন্য মূল্যের ওঠানামা ফিল্টারিংয়ের সাথে মিলিত। এটি বুঝতে এবং পরামিতিগুলি সামঞ্জস্য করা সহজ, মাঝারি মেয়াদী ট্রেডিংয়ের সাথে খাপ খাইয়ে নেওয়া যায়। আরও অপ্টিমাইজেশনের সাথে, এটি দীর্ঘমেয়াদে ধরে রাখার জন্য একটি মূল্যবান পরিমাণগত কৌশল হয়ে উঠতে পারে।
/*backtest
start: 2024-01-15 00:00:00
end: 2024-01-22 00:00:00
period: 3m
basePeriod: 1m
exchanges: [{"eid":"Futures_Binance","currency":"BTC_USDT"}]
*/

//@version=2
strategy("PierceMAStrat", overlay=true)

lenMA0 = input(title="Length 0",defval=2)
lenMA1=input(title="Length 1",defval=10)
lenMA2=input(title="Length 2", defval=20)
lenMA3 = input(title = "Length3", defval =50)


emaLen0 = ema(close, lenMA0)
emaLen1 = ema(close, lenMA1)
emaLen2 = ema(close, lenMA2)
emaLen3 = ema(close, lenMA3)


ascent = if emaLen1[1] < emaLen1[0]
    true
else
    false

descent = if emaLen1[1] > emaLen1[0]
    true
else
    false

TimeSinceAscensionStart = if ascent == true
    barssince(descent == true)
else
    0


StartUp = if TimeSinceAscensionStart < 1
    true
else
    false

StartDown = if TimeSinceAscensionStart < 1
    false
else
    true


AscentBarCounter = barssince(StartUp == true)

DescentBarCounter = barssince(StartDown == true)

MaxAscent = if AscentBarCounter[1] > AscentBarCounter[0] and AscentBarCounter[1] > 10
    true
else
    false

MaxDescent = if DescentBarCounter[1] > DescentBarCounter[0] and DescentBarCounter[1] > 5
    true
else
    false

longCond = if crossover(emaLen1, emaLen2) and barssince(MaxDescent == true) > 3
    true
else
    false
shortCond = if crossunder(emaLen1, emaLen2) and barssince(MaxAscent == true) > 3
    true
else
    false


//longCond = (crossover(emaLen1, emaLen2) and (emaLen2 > emaLen3))
//shortCond = crossunder(emaLen1, emaLen2) and (emaLen2 < emaLen3)


if longCond == true
    strategy.entry("LONG", strategy.long)

if shortCond == true
    strategy.entry("SHORT", strategy.short)


plotshape(series=MaxAscent, title="MaximaReached", style=shape.triangledown, location=location.abovebar, color=green, text="MaximaReached", size=size.small)
plotshape(series=MaxDescent, title="MinimaReached", style=shape.triangleup, location=location.belowbar, color=red, text="MinimaReached", size=size.small)
//plotshape(series=StartUp, title="StartUp", style=shape.triangleup, location=location.belowbar, color=red, text="StartUp", size=size.tiny)
//plotshape(series=StartDown, title="StartDown", style=shape.triangleup, location=location.belowbar, color=green, text="StartDown", size=size.tiny)

//plotshape(series=(crossover(emaLen1, emaLen3)), title="GBXOVER", style=shape.triangleup, location=location.belowbar, color=green, text="GBXO", size=size.small)
//plotshape(series=(crossover(emaLen2, emaLen3)), title="RBXOVER", style=shape.triangledown, location=location.abovebar, color=orange, text="RBXO", size=size.small)
//plotshape(series=(crossover(emaLen1, emaLen2)), title="GRXOVER", style=shape.triangledown, location=location.abovebar, color=teal, text="GRXO", size=size.small)
//plotshape(series=(crossunder(emaLen1, emaLen2)), title="GRXUNDER", style=shape.triangledown, location=location.abovebar, color=purple, text="GRXU", size=size.small)
//plotshape(series=(crossunder(emaLen1, emaLen3)), title="GBXOVER", style=shape.triangleup, location=location.belowbar, color=yellow, text="GBXU", size=size.small)
//plotshape(series=(crossunder(emaLen2, emaLen3)), title="RBXOVER", style=shape.triangledown, location=location.abovebar, color=yellow, text="RBXU", size=size.small)

//plotshape(convergence, color=lime, style=shape.arrowup, text="CROSS")
plot(emaLen1, color=green, transp=0, linewidth=2)
plot(emaLen2, color=red, transp=30, linewidth=2)
plot(emaLen3, color=blue, transp=30, linewidth=2)
- চলমান গড়ের সাথে চক্রের বিচারের উপর ভিত্তি করে গতির ব্রেকআউট কৌশল
- অর্থ প্রবাহ সূচক সময় ও স্থান জুড়ে 5 মিনিটের কৌশল
- ডাবল ইএমএ ক্রস ট্রেন্ড ট্রেডিং কৌশল
- গতিশীল এমএসিডি অপ্টিমাইজেশন ট্রেডিং কৌশল
- ভিডব্লিউএপি এবং আরএসআই সংমিশ্রণ কৌশল
- গডস বোলিংজার ব্যান্ডস আরএসআই ট্রেডিং কৌশল
- EMA চ্যানেল এবং MACD ভিত্তিক স্বল্পমেয়াদী ট্রেডিং কৌশল
- গতি এবং ভয় সূচক ক্রসওভার কৌশল
- দৈনিক পিভট পয়েন্টের উপর ভিত্তি করে স্বয়ংক্রিয় লং/শর্ট ট্রেডিং কৌশল
- ট্রিপল মুভিং মিডিয়ার পরিমাণগত ট্রেডিং কৌশল
- অ্যাডাপ্টিভ মুভিং এভারেজ এবং ওয়েটেড মুভিং এভারেজ ক্রসওভার ট্রেডিং স্ট্র্যাটেজি
- সমষ্টিগত মাল্টি-টাইমফ্রেম MACD RSI CCI StochRSI MA লিনিয়ার ট্রেডিং কৌশল
- মাল্টি-টাইমফ্রেম এমএসিডি ট্রেন্ড অনুসরণকারী কৌশল
- এমএসিডি এবং আরএসআই ভিত্তিক ট্রেডিং কৌশল অনুসরণ করে প্রবণতা
- একটি এটিআর চ্যানেল ব্রেকআউট পরিমাণগত ট্রেডিং কৌশল
- অনুকূলিত ATR এবং RSI ট্রেন্ড ট্রেজিং স্টপ লস সহ কৌশল অনুসরণ করে
- টিএসআই এবং এইচএমএসিসিআই সূচকগুলির উপর ভিত্তি করে ট্রেন্ড সার্ফিং হেজিং কৌশল
- দ্বৈত চলমান গড় গোল্ডেন ক্রস অ্যালগরিদম