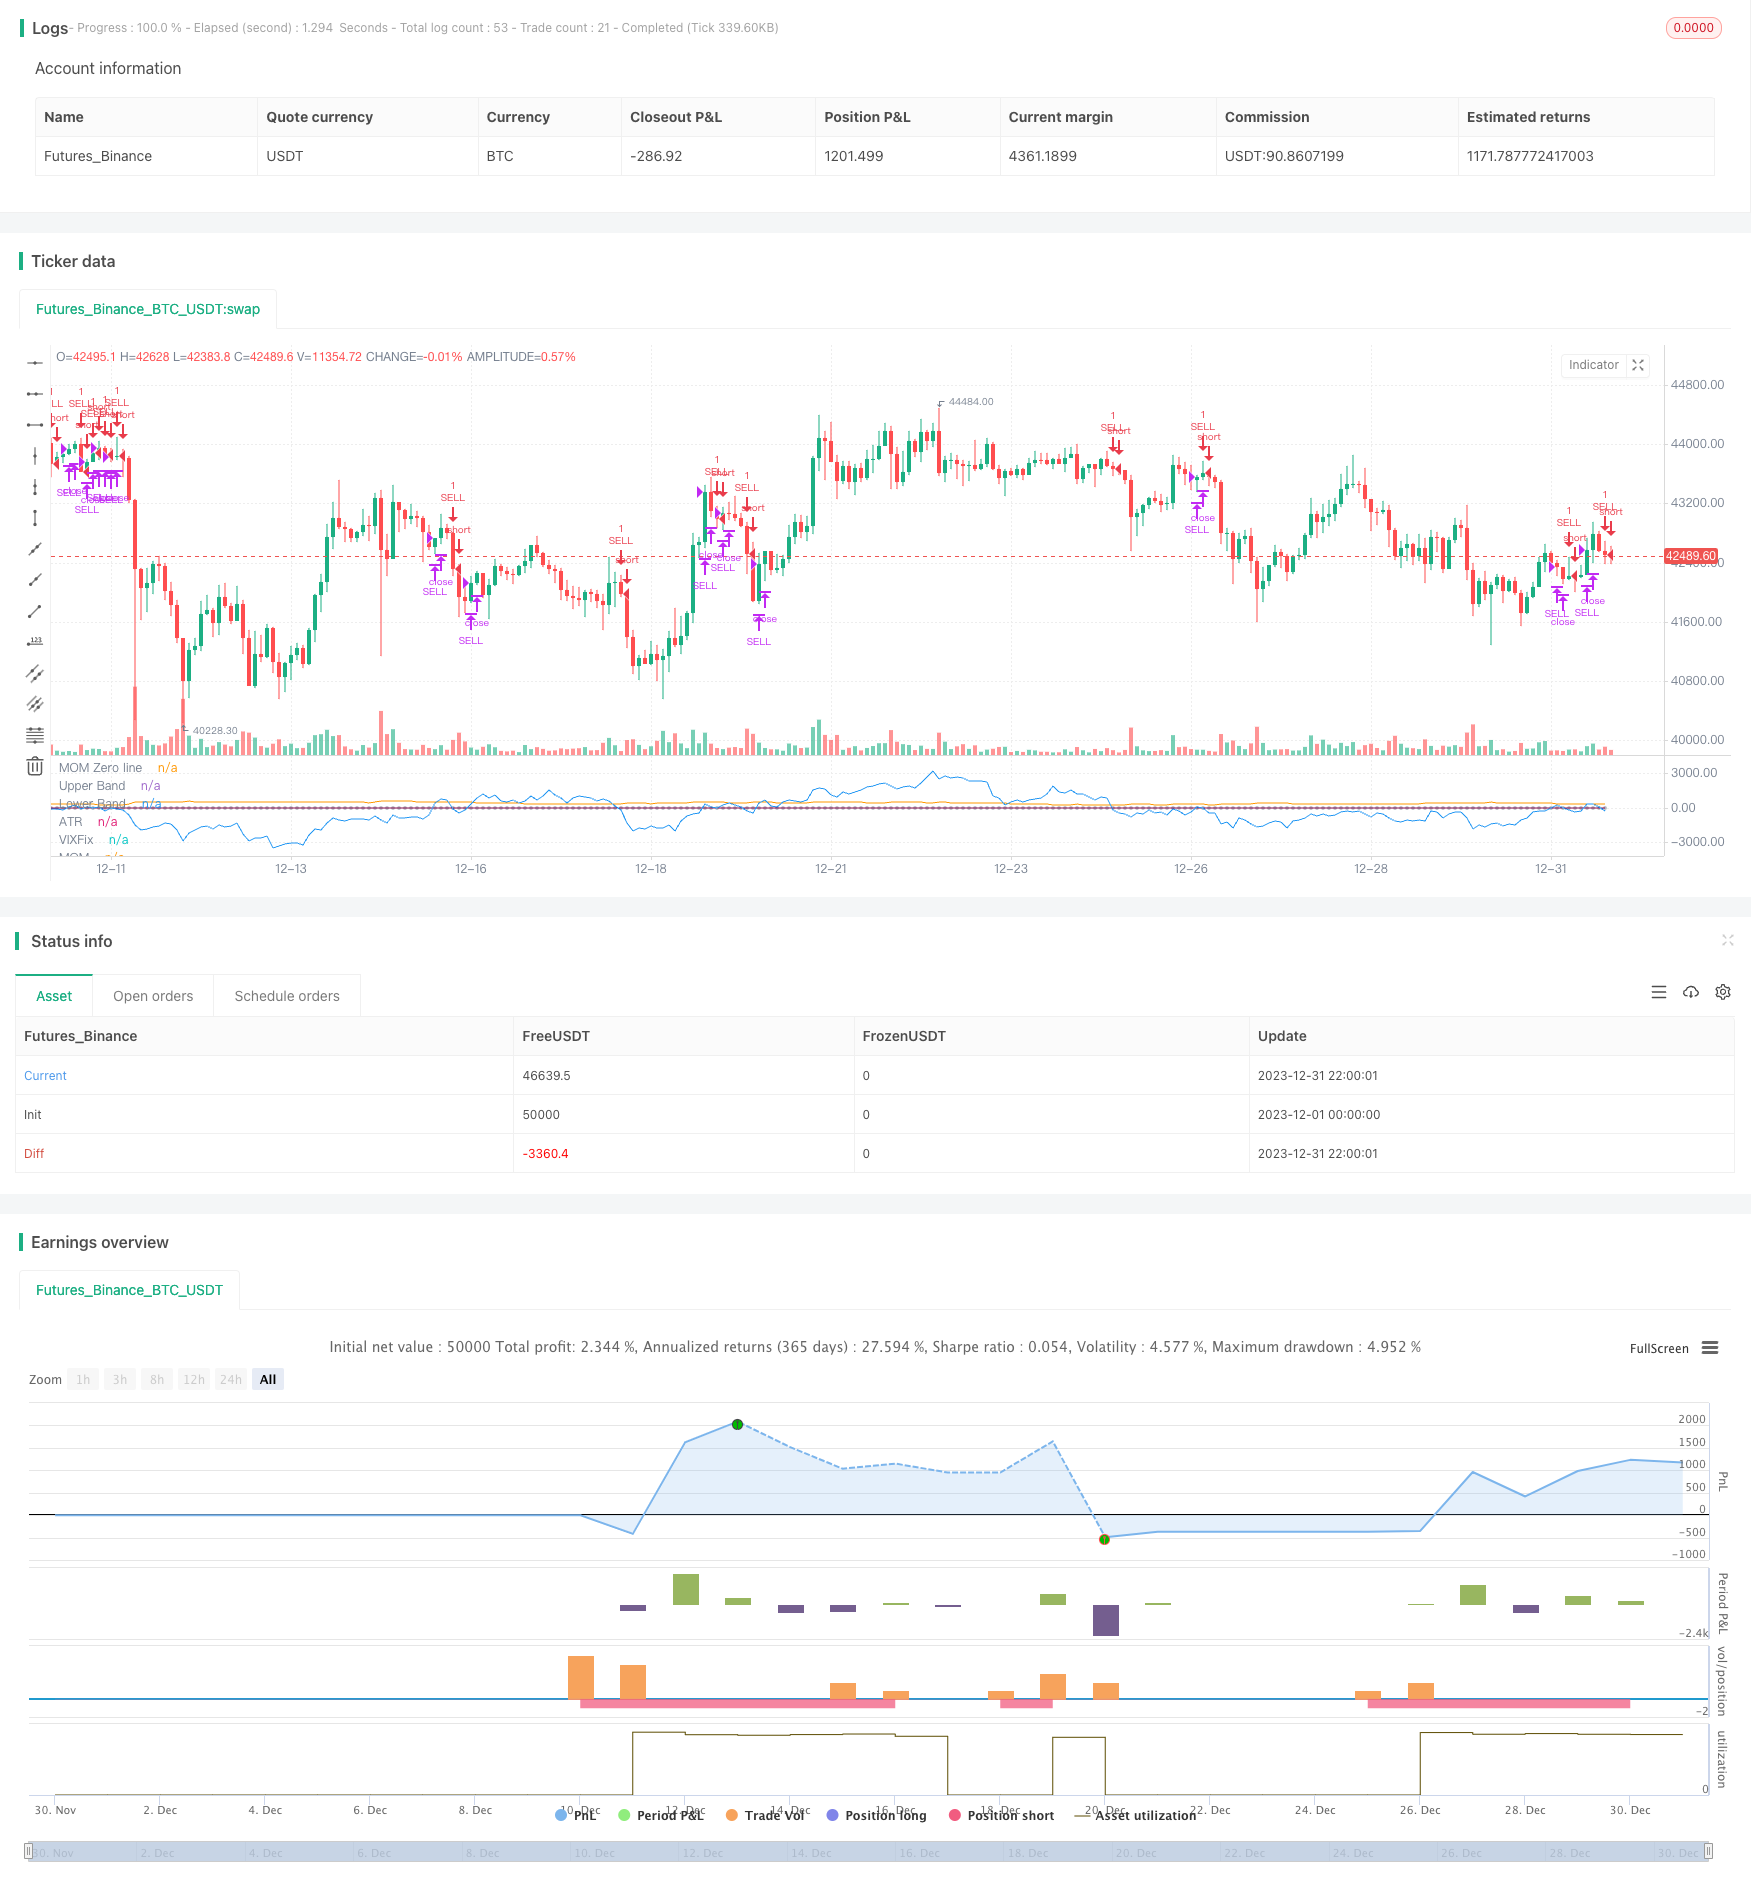
গতি এবং ভয় সূচক ক্রসওভার কৌশল
লেখক:চাওঝাং, তারিখঃ ২০২৪-০১-২৩ ১৪ঃ২৭ঃ২৩ট্যাগঃ

সারসংক্ষেপ
এই কৌশলটি একটি গতির সূচক এবং একটি ভয় সূচকের মধ্যে ক্রসওভার গণনা করে বাজারের প্রবণতা বিচার করে এবং দুটি সূচক যখন তীব্র হ্রাসগুলি ধরতে নির্দিষ্ট ক্রস করে তখন বিক্রয় সংকেত দেয়।
কৌশল নীতি
-
৫০ পেরিওড ইম্পুটম ইন্ডিকেটর গণনা করুন। এটি ৫০ পেরিওড আগের তুলনায় মূল্য পরিবর্তনের প্রতিনিধিত্ব করে।
-
২২ পেরিওডের সংশোধিত ভয় সূচক গণনা করুন। এটি সর্বোচ্চ এবং সর্বনিম্ন মূল্যের অনুপাতের মাধ্যমে বাজারের আতঙ্ককে উপস্থাপন করে।
-
যখন গতির সূচক ভয় সূচকের নিচে অতিক্রম করে, তখন এটি বাজারে নেতিবাচক চাপের ইঙ্গিত দেয়।
-
যদি ইম্পোমেন্টটি বিপজ্জনক অঞ্চলে (-5 এবং 5 এর মধ্যে) পড়া চালিয়ে যায়, তবে একটি শক্তিশালী বিক্রয় সংকেত জারি করা হয়।
সুবিধা বিশ্লেষণ
-
মার্কেট সেন্টিমেন্টের একটি সূচক ভয় সূচক ব্যবহার করে কার্যকরভাবে মার্কেটে কাঠামোগত পরিবর্তন নির্ধারণ করা যায়।
-
গতির সূচকটি মূল্য পরিবর্তনের গতি এবং মাত্রা বিচার করতে পারে এবং প্রবণতা পরিবর্তনের নির্ধারণে সহায়তা করতে পারে।
-
দুটি ভিন্ন ধরনের সূচককে একত্রিত করা হঠাৎ ঘটনা চিহ্নিত করার নির্ভুলতা বাড়িয়ে তুলতে পারে।
-
পরামিতিগুলি সামঞ্জস্য করা বিভিন্ন বাজারের পরিবেশে নমনীয় অভিযোজনকে অনুমতি দেয়।
ঝুঁকি বিশ্লেষণ
-
ভয়ের সূচক এবং গতির ক্রসওভারগুলি প্রতিটি বড় হ্রাসের নিশ্চয়তা দেয় না। চূড়ান্ত সিদ্ধান্ত নেওয়ার জন্য অন্যান্য সূচকগুলি বিবেচনা করা দরকার।
-
বিক্রির পর স্টপ লস না থাকলে ক্ষতি কার্যকরভাবে নিয়ন্ত্রণ করা যায় না।
-
এই কৌশলটি শুধুমাত্র হঠাৎ দুর্ঘটনা ধরার জন্য উপযুক্ত।
অপ্টিমাইজেশান নির্দেশাবলী
-
ক্ষতি নিয়ন্ত্রণের জন্য বিক্রির পর স্টপ লস সেট করুন।
-
সিগন্যালের নির্ভরযোগ্যতা মূল্যায়ন এবং উন্নত করার জন্য অন্যান্য সূচক যোগ করুন, যেমন ভলিউম, বোলিংজার ব্যান্ড।
-
কৌশলটি দীর্ঘমেয়াদী চক্র চালানোর জন্য পুনরায় প্রবেশের সংকেত যুক্ত করুন।
-
সর্বোত্তম প্যারামিটার সমন্বয় খুঁজে পেতে প্যারামিটার অপ্টিমাইজ করুন।
সংক্ষিপ্তসার
কৌশলটি গতির সূচক এবং ভয় সূচকের ক্রসওভারের মাধ্যমে বাজার হ্রাস সতর্কতা জারি করে। এটি হঠাৎ বাজার ক্র্যাশকে কার্যকরভাবে ক্যাপচার করতে পারে। তবে কৌশলটি কেবলমাত্র প্রস্থান প্রক্রিয়া এবং ঝুঁকি নিয়ন্ত্রণ ছাড়াই স্বল্পমেয়াদী ব্যবহারের জন্য উপযুক্ত। এটিকে টেকসই দীর্ঘমেয়াদী কৌশল তৈরি করতে আরও উন্নতি প্রয়োজন।
/*backtest
start: 2023-12-01 00:00:00
end: 2023-12-31 23:59:59
period: 2h
basePeriod: 15m
exchanges: [{"eid":"Futures_Binance","currency":"BTC_USDT"}]
*/

// This source code is subject to the terms of the Mozilla Public License 2.0 at https://mozilla.org/MPL/2.0/
// © gary_trades

//THIS SCRIPT HAS BEEN BUIL TO BE USED AS A S&P500 SPY CRASH INDICATOR (should not be used as a strategy).
//THIS SCRIPT HAS BEEN BUILT AS A STRATEGY FOR VISUALIZATION PURPOSES ONLY AND HAS NOT BEEN OPTIMISED FOR PROFIT.
//The script has been built to show as a lower indicator and also gives visual SELL signal on top when conditions are met. BARE IN MIND NO STOP LOSS, NOR ADVANCED EXIT STRATEGY HAS BEEN BUILT.
//As well as the chart SELL signal an alert has also been built into this script.
//The script utilizes a VIX indicator (marron line) and 50 period Momentum (blue line) and Danger/No trade zone(pink shading).
//When the Momentum line crosses down across the VIX this is a sell off but in order to only signal major sell offs the SELL signal only triggers if the momentum continues down through the danger zone.
//To use this indicator to identify ideal buying then you should only buy when Momentum line is crossed above the VIX and the Momentum line is above the Danger Zone.
//This is best used as a daily time frame indicator

//@version=4
strategy(title="S&P Bear Warning", shorttitle="Bear Warning" )

//Momentum
len = input(50, minval=1, title="Length")
src = input(close, title="Source")
bandUpper = input( 5)
bandLower = input(-5)
// ————— Control plotting of each signal. You could use the same technique to be able to turn acc/dist on/off.
showVixFix = input(true)
showMomentum = input(true)

mom = src - src[len]
myAtr = atr(14)
plot(showMomentum ? mom : na, color=color.blue, title="MOM")
plot(showMomentum ? 0 : na, color=color.silver, title="MOM Zero line", style=plot.style_circles, transp=100)
plot(showMomentum ? myAtr : na, color=color.orange, title="ATR", transp=90)

//VIX
VIXFixLength = input(22,title="VIX Fix Length")
VIXFix = (highest(close,VIXFixLength)-low)/(highest(close,VIXFixLength))*100
plot(showVixFix ? VIXFix : na, "VIXFix", color=color.maroon)

band1 = plot(showVixFix ? bandUpper : na, "Upper Band", color.red, 1, plot.style_line, transp=90)
band0 = plot(showVixFix ? bandLower : na, "Lower Band", color.red, 1, plot.style_line, transp=90)
fill(band1, band0, color=color.red, transp=85, title="Background")

//Identify Triggers
//Back Test Range
start = timestamp("America/New_York", 2000, 1, 1, 9,30)
end   = timestamp("America/New_York", 2020, 7, 1, 0, 0)

//Momentum
Long1 = mom > bandUpper
Short1 = mom < bandLower

//VIX
Long2  = crossover(mom, VIXFix)
Short2 = crossunder(mom, VIXFix)

//Warning Alert
SellAlert = Short1
alertcondition(SellAlert, title="Sell SPY", message="Warning Selling off {{ticker}}, price= {{close}}")

//Entry and Exit
if true
    strategy.entry("SELL", false, when = Short1)

strategy.close("SELL", when = Long2)
- মুভিং মিডিয়ার উপর ভিত্তি করে দোলনের অগ্রগতি কৌশল
- জিগজ্যাগ প্যাটার্ন স্বীকৃতি স্বল্পমেয়াদী ট্রেডিং কৌশল
- উইলিয়ামস ভিআইএক্স এবং ডেমার উপর ভিত্তি করে বিভিন্ন সময়সীমার মধ্যে অস্থিরতা এবং প্রবণতা ট্র্যাকিং কৌশল
- চলমান গড়ের সাথে চক্রের বিচারের উপর ভিত্তি করে গতির ব্রেকআউট কৌশল
- অর্থ প্রবাহ সূচক সময় ও স্থান জুড়ে 5 মিনিটের কৌশল
- ডাবল ইএমএ ক্রস ট্রেন্ড ট্রেডিং কৌশল
- গতিশীল এমএসিডি অপ্টিমাইজেশন ট্রেডিং কৌশল
- ভিডব্লিউএপি এবং আরএসআই সংমিশ্রণ কৌশল
- গডস বোলিংজার ব্যান্ডস আরএসআই ট্রেডিং কৌশল
- EMA চ্যানেল এবং MACD ভিত্তিক স্বল্পমেয়াদী ট্রেডিং কৌশল
- দৈনিক পিভট পয়েন্টের উপর ভিত্তি করে স্বয়ংক্রিয় লং/শর্ট ট্রেডিং কৌশল
- ট্রিপল মুভিং মিডিয়ার পরিমাণগত ট্রেডিং কৌশল
- একটি এক্সপোনেন্সিয়াল মুভিং গড় উপর ভিত্তি করে একটি গতি ক্রসওভার কৌশল
- অ্যাডাপ্টিভ মুভিং এভারেজ এবং ওয়েটেড মুভিং এভারেজ ক্রসওভার ট্রেডিং স্ট্র্যাটেজি
- সমষ্টিগত মাল্টি-টাইমফ্রেম MACD RSI CCI StochRSI MA লিনিয়ার ট্রেডিং কৌশল
- মাল্টি-টাইমফ্রেম এমএসিডি ট্রেন্ড অনুসরণকারী কৌশল
- এমএসিডি এবং আরএসআই ভিত্তিক ট্রেডিং কৌশল অনুসরণ করে প্রবণতা
- একটি এটিআর চ্যানেল ব্রেকআউট পরিমাণগত ট্রেডিং কৌশল
- অনুকূলিত ATR এবং RSI ট্রেন্ড ট্রেজিং স্টপ লস সহ কৌশল অনুসরণ করে
- টিএসআই এবং এইচএমএসিসিআই সূচকগুলির উপর ভিত্তি করে ট্রেন্ড সার্ফিং হেজিং কৌশল