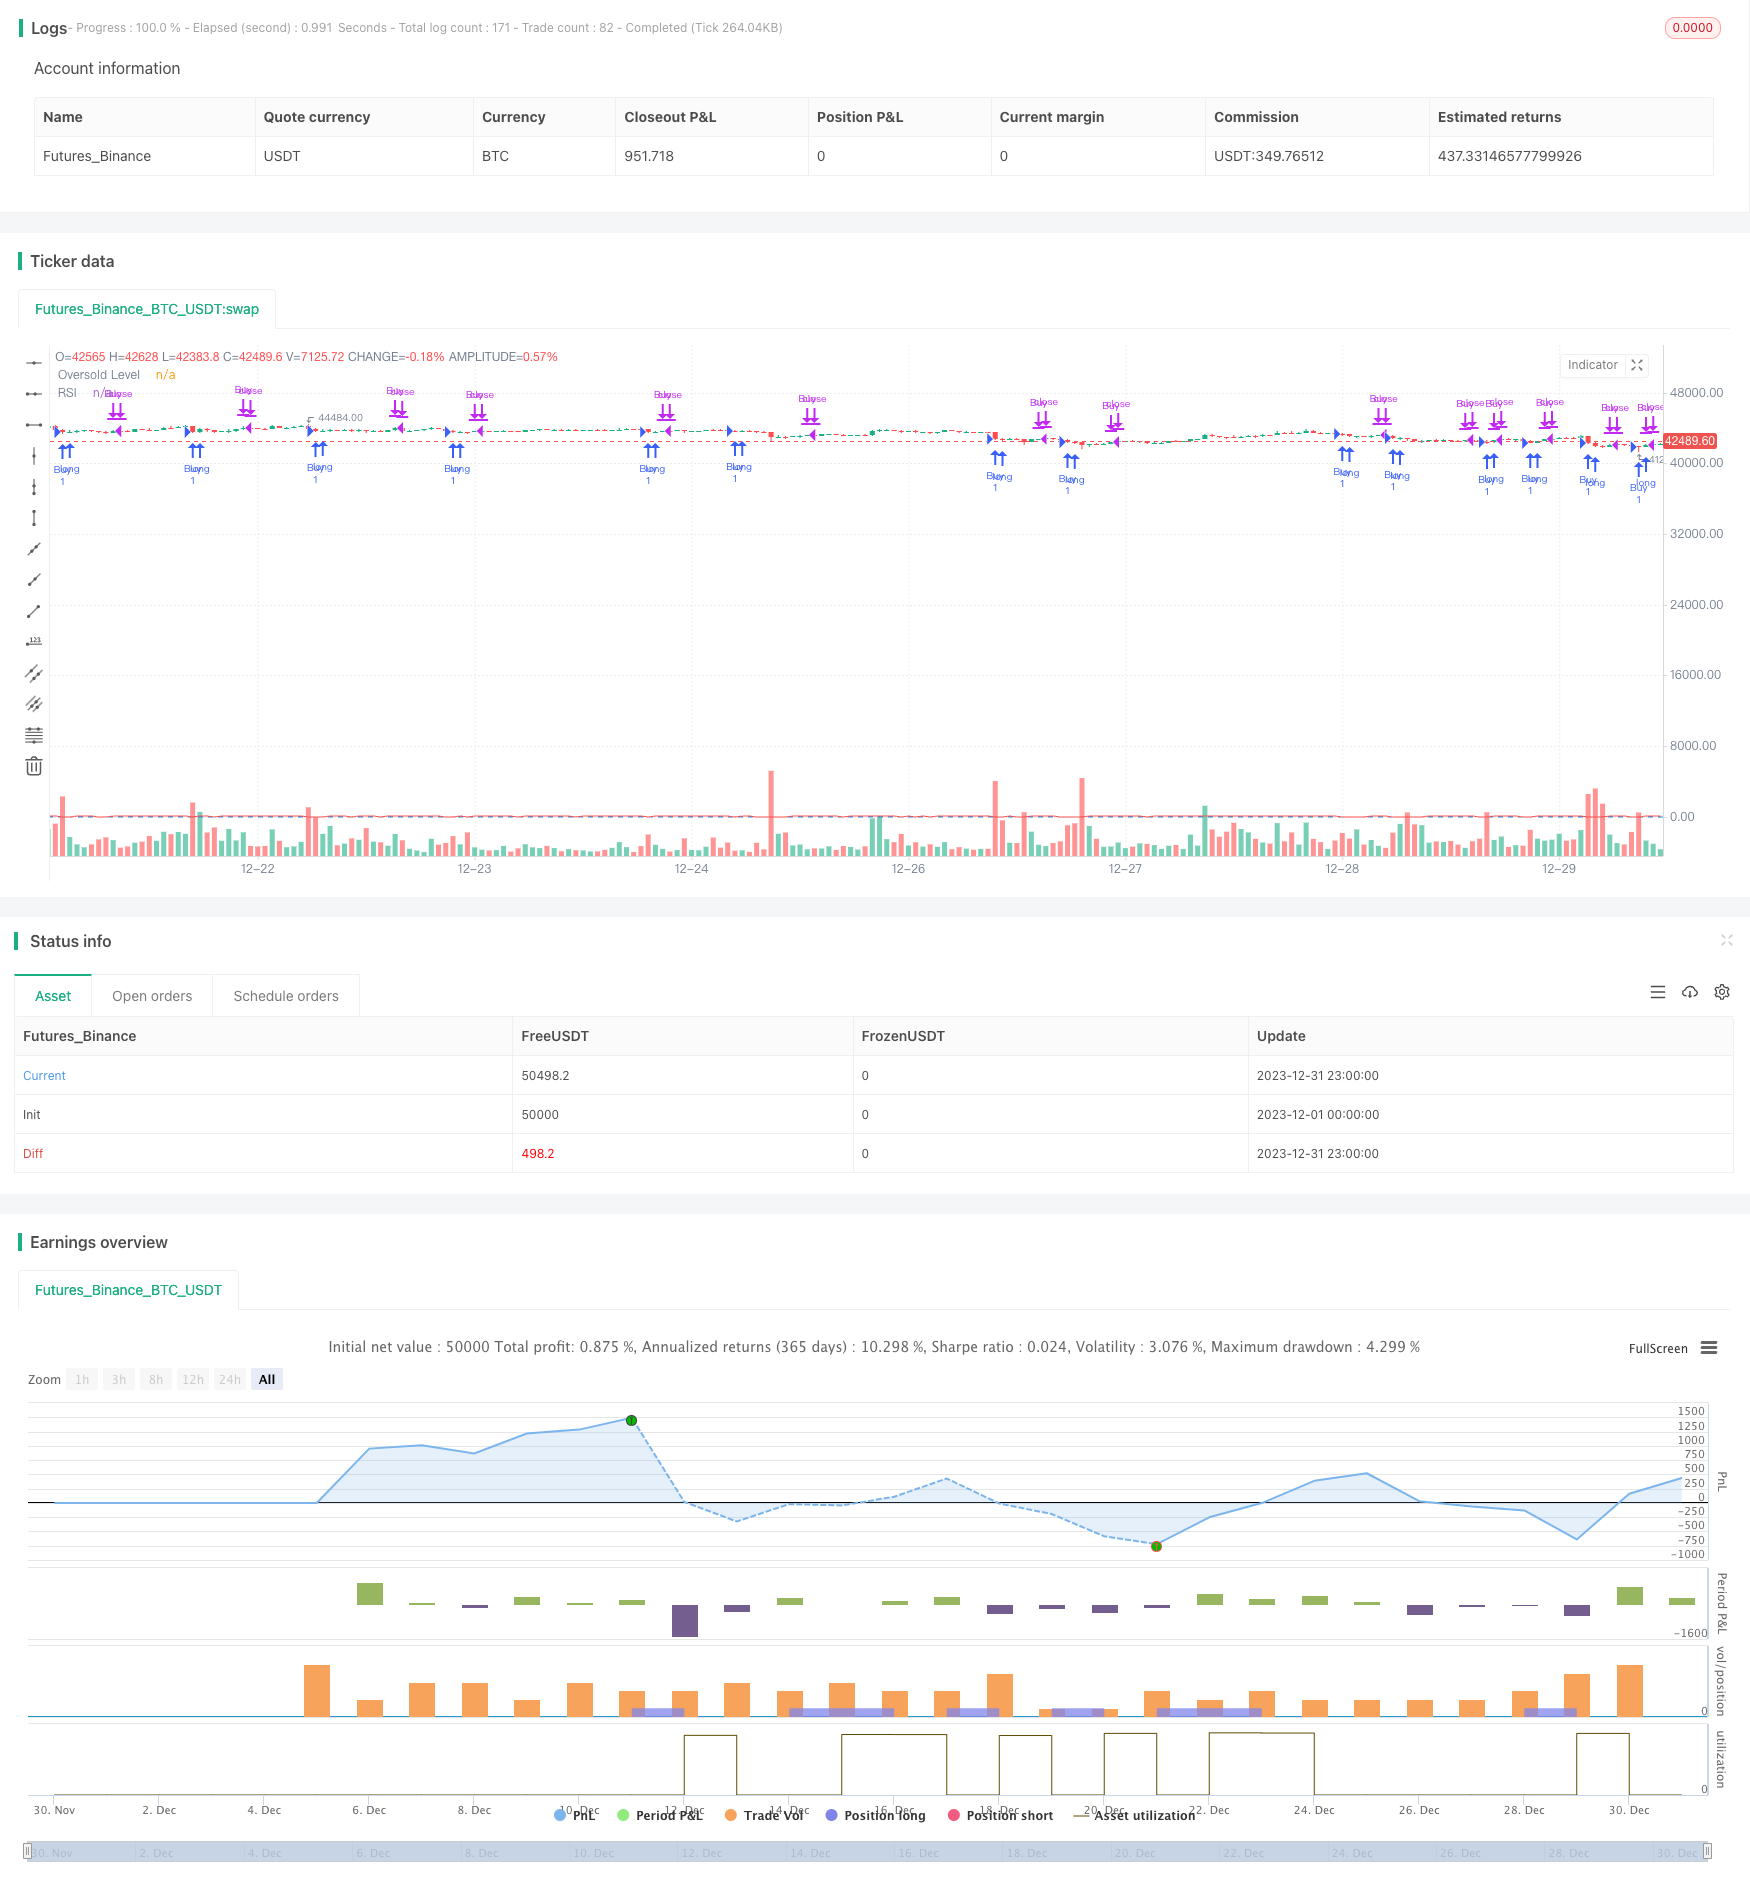
দ্বৈত সূচকের উপর ভিত্তি করে ব্রেকআউট কৌশল

ওভারভিউ
ডাবল সূচক ব্রেকআউট কৌশলটি আরএসআই সূচক এবং বন্ধের মূল্য সূচকগুলির সাথে একত্রিত হয়ে কম কেনা-বেচাকেনা পদ্ধতিতে বাণিজ্য করে। এই কৌশলটি সহজেই ব্যবহারযোগ্য, প্রত্যাহারের ঝুঁকি কম এবং মাঝারি-দীর্ঘ লাইনের অবস্থানের জন্য উপযুক্ত।
কৌশল নীতি
এই কৌশলটি মূলত নিম্নলিখিত দুটি সূচকের উপর ভিত্তি করে নির্ণয় করা হয়ঃ
- RSI সূচকঃ যখন RSI2 15 এর চেয়ে কম হয়, তখন অতিরিক্ত প্রবেশ করুন।
- গত দিনের শেষের দামঃ যখন আজকের শেষের দাম আগের দিনের সর্বোচ্চ দামের চেয়ে বেশি হয়, তখন পজিশনটি সরানো হয়।
প্রবেশের শর্তটি হ’ল আরএসআই ওভারবাই, যা নির্দেশ করে যে শেয়ারগুলি অত্যন্ত অবমূল্যায়িত এবং একটি শক্তিশালী বিপরীত হওয়ার সম্ভাবনা রয়েছে। প্রস্থান শর্তটি হল যে বন্ধের দামটি একদিনের সর্বোচ্চ মূল্যকে ছাড়িয়ে গেছে, যা ইঙ্গিত দেয় যে শেয়ারগুলি বহুবিধ ব্যবস্থায় প্রবেশ করছে এবং যথাযথভাবে থামানো উচিত।
সামর্থ্য বিশ্লেষণ
ডাবল মেট্রিকের এই কৌশলটির কিছু সুবিধাও রয়েছেঃ
- কৌশলটি সহজ এবং বাস্তবায়িত করা সহজ।
- ডাবল ইন্ডিকেটরের উপর ভিত্তি করে, ভুয়া সংকেতগুলি কার্যকরভাবে নিয়ন্ত্রণ করা যায়।
- RSI সূচক প্যারামিটার অপ্টিমাইজ করার জন্য অনেক জায়গা রয়েছে, যা সর্বোত্তম অবস্থায় সামঞ্জস্য করা যায়।
- এই প্রবণতাকে অনুসরণ করে, প্রত্যাহারের ঝুঁকি কম থাকে।
- এটি বড় মিডল ক্যাপিটাল স্টকগুলির জন্য ব্যাপকভাবে প্রয়োগ করা যেতে পারে, এবং এটি যুদ্ধক্ষেত্রে ভাল কাজ করে।
ঝুঁকি বিশ্লেষণ
এই কৌশলটির কিছু ঝুঁকিও রয়েছেঃ
- শেয়ারগুলি খুব বেশি ওঠানামা করছে, আরএসআই প্যারামিটারগুলিকে সামঞ্জস্য করতে হবে।
- এই ধরনের পরিস্থিতিতে, একটি সংক্ষিপ্ত লাইন রিডাউন আশা করা যায়।
- গতকালের সর্বোচ্চ মূল্যের বিপর্যয়ের যুক্তিসঙ্গততা যাচাই করতে হবে।
RSI প্যারামিটারগুলিকে অপ্টিমাইজ করে, ট্রেডিং টাইপগুলি মূল্যায়ন করে এবং অন্যান্য সূচকগুলির সাথে যুক্ত করে এই ঝুঁকিগুলি এড়ানো যায়।
অপ্টিমাইজেশান দিক
এই কৌশলটি নিম্নে উল্লেখিত বিষয়গুলির উপর দৃষ্টি নিবদ্ধ করেঃ
- RSI সূচকের বিভিন্ন সময়কালের কার্যকারিতা মূল্যায়ন করা।
- সমাপ্তি মূল্য এবং অন্যান্য মূল্য সূচকগুলির সমন্বয় পরীক্ষা করুন।
- খেলার পর কিছু সময়ের জন্য খেলায় ফিরে আসার মতো ক্ষতি প্রতিরোধের ব্যবস্থা যোগ করা।
- ট্রেডিং ভলিউমের পরিবর্তনের সাথে প্রবেশের সংকেতের নির্ভরযোগ্যতা মূল্যায়ন করা।
- মেশিন লার্নিং অ্যালগরিদম ব্যবহার করে প্যারামিটারগুলি স্বয়ংক্রিয়ভাবে অপ্টিমাইজ করুন।
সারসংক্ষেপ
দ্বিগুণ সূচক বিভাজন কৌশল সামগ্রিকভাবে একটি খুব ব্যবহারিক পরিমাণ কৌশল। এই কৌশলটি পরিচালনা করা সহজ, প্রত্যাহারের ঝুঁকি কম, প্যারামিটার অপ্টিমাইজেশন এবং নিয়মের পরিমার্জনের মাধ্যমে এটি একটি স্মার্ট এবং স্থিতিশীল পরিমাণ পদ্ধতি হতে পারে। যদি কার্যকরভাবে অবতরণ করা হয় তবে এটি আমাদের জন্য ভাল মাঝারি এবং দীর্ঘ লাইন ব্যবসায়ের সুযোগ সরবরাহ করতে পারে।
/*backtest
start: 2023-12-01 00:00:00
end: 2023-12-31 23:59:59
period: 1h
basePeriod: 15m
exchanges: [{"eid":"Futures_Binance","currency":"BTC_USDT"}]
*/

// This source code is subject to the terms of the Mozilla Public License 2.0 at https://mozilla.org/MPL/2.0/
// © hobbiecode

// If RSI(2) is less than 15, then enter at the close.
// Exit on close if today’s close is higher than yesterday’s high.

//@version=5
strategy("Hobbiecode - RSI + Close previous day", overlay=true)

// RSI parameters
rsi_period = 2
rsi_lower = 15

// Calculate RSI
rsi_val = ta.rsi(close, rsi_period)

// Check if RSI is lower than the defined threshold
if (rsi_val < rsi_lower)
    strategy.entry("Buy", strategy.long)

// Check if today's close is higher than yesterday's high
if (strategy.position_size > 0 and close > ta.highest(high[1], 1))
    strategy.close("Buy")

// Plot RSI on chart
plot(rsi_val, title="RSI", color=color.red)
hline(rsi_lower, title="Oversold Level", color=color.blue)