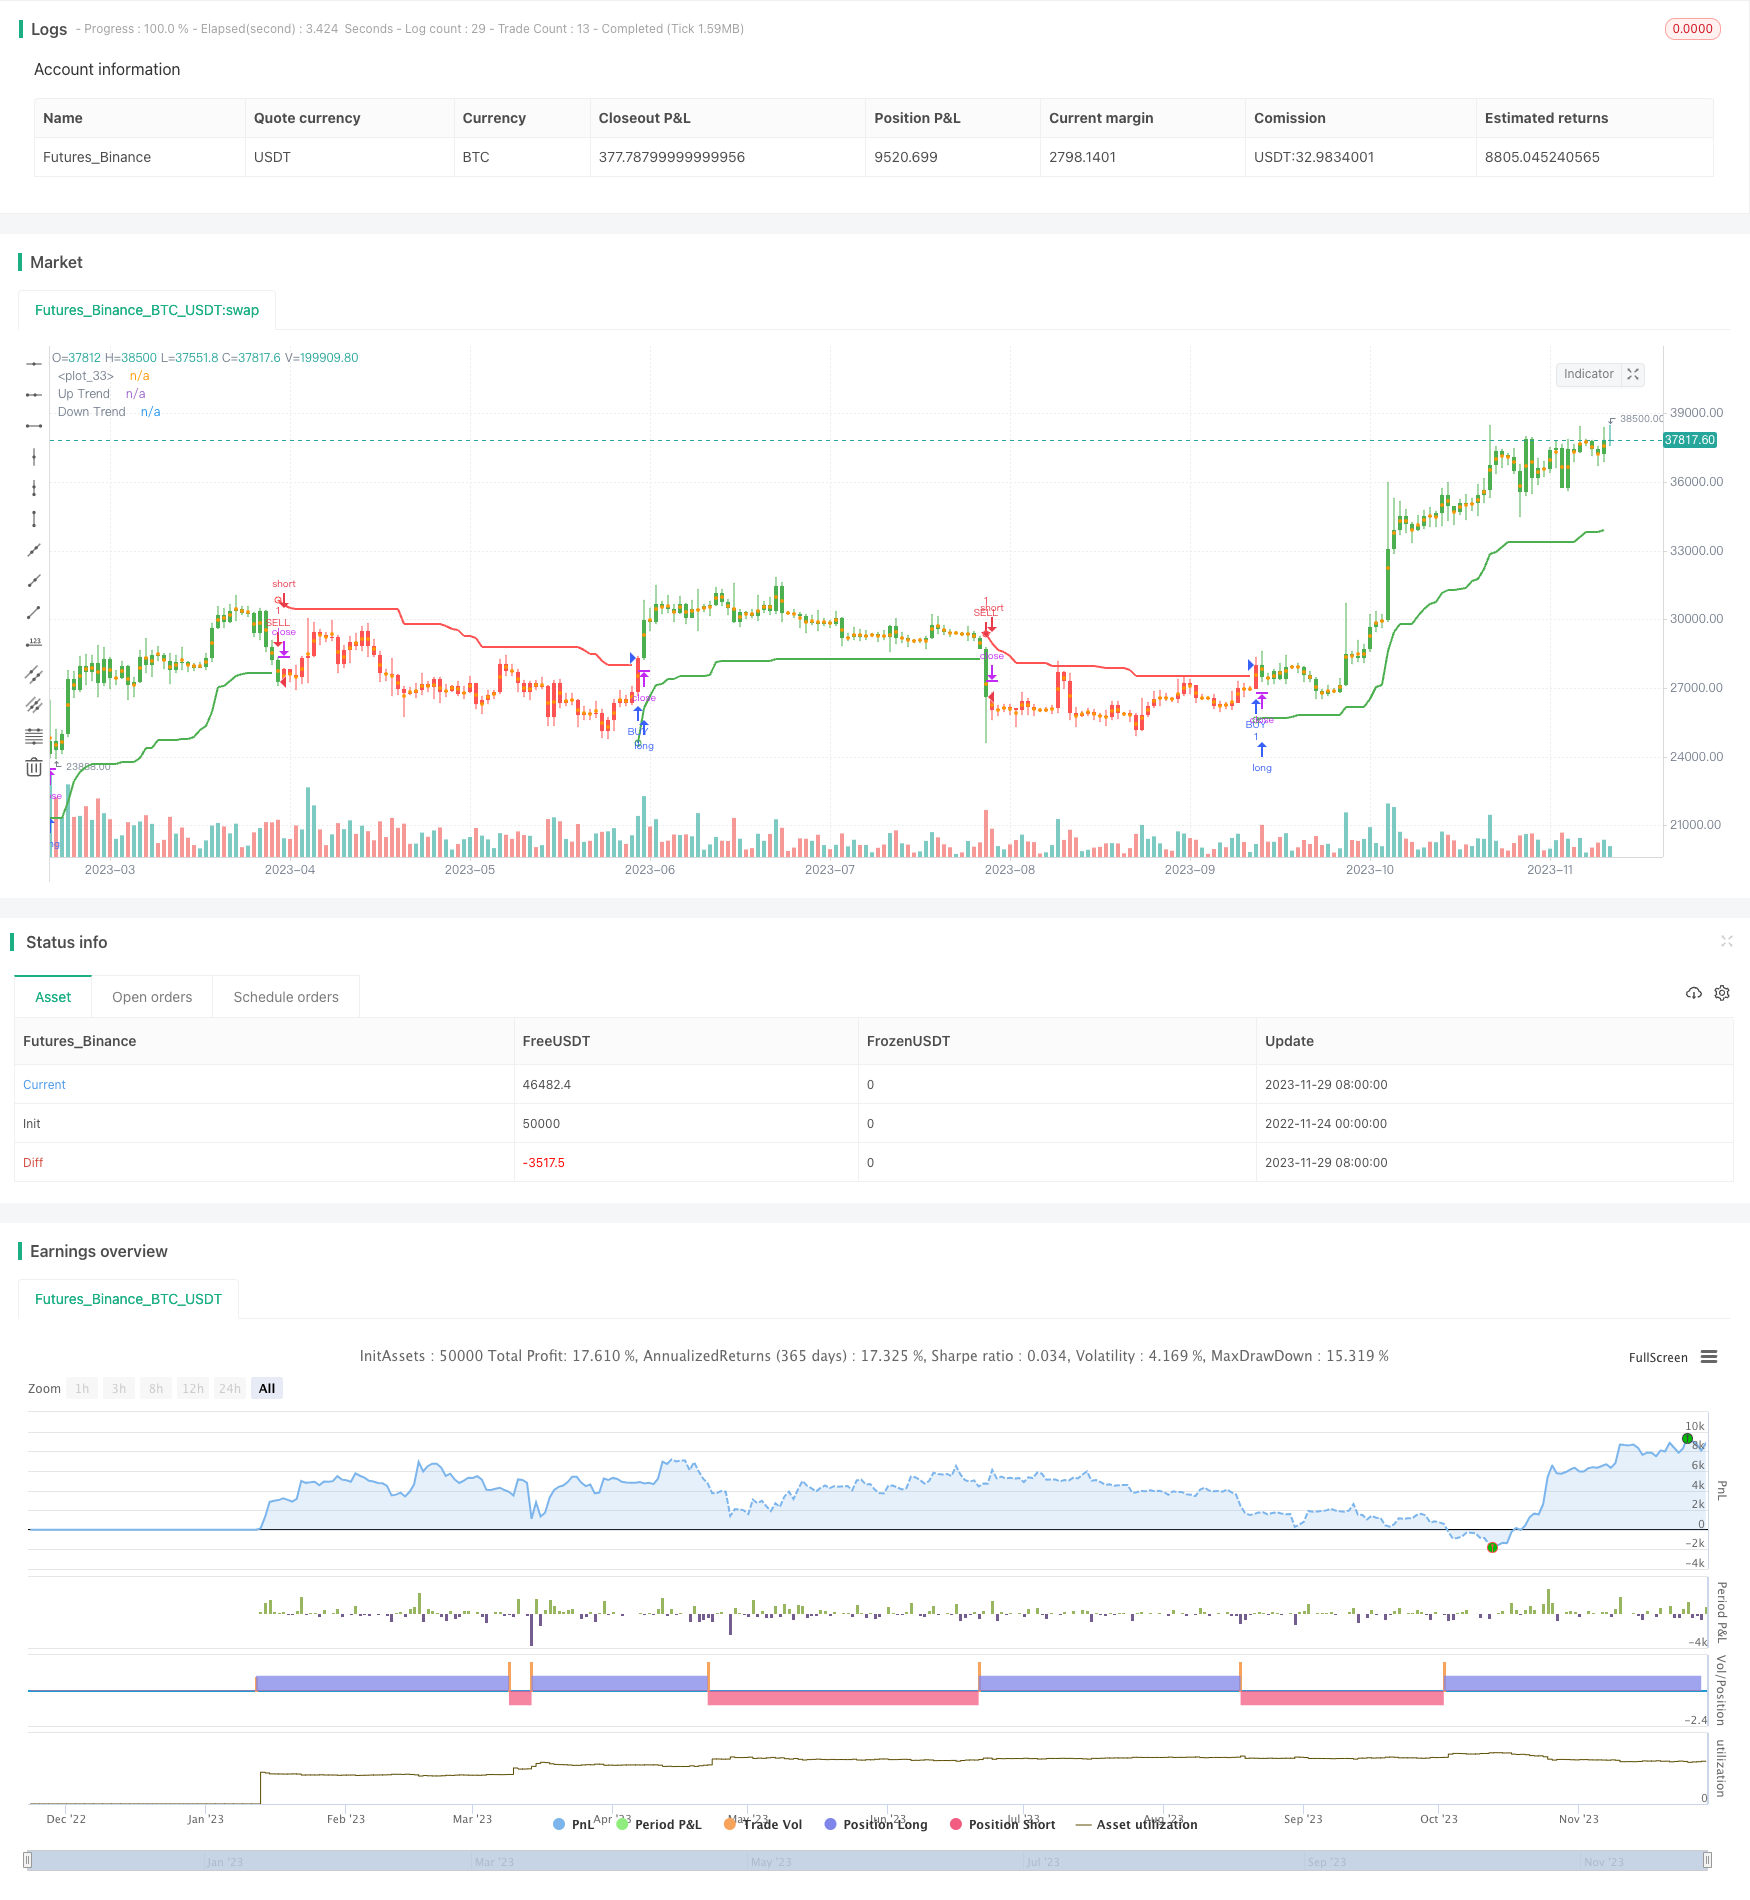
Strategie für Supertrend Bollinger Bands
Schriftsteller:ChaoZhang, Datum: 2023-12-01 16:29:56Tags:

Übersicht
Die Supertrend Bollinger Bands Strategie ist eine gängige Trailing Stop-Indikatorstrategie, die auf dem ATR (Average True Range) basiert.
Strategie Logik
Die Strategie verwendet zwei Hauptparameter - Periode und Multiplikator, mit Standardwerten von 10 bzw. 3 - zur Berechnung der Supertrend-Linien.
Oberste Zeile: Schließen - (Multiplikator x ATR) Unterste Linie: Schließen + (Multiplikator x ATR)
Wenn der Schlusskurs höher als die vorherige obere Linie ist, gilt dies als Aufwärtssignal.
Die Strategie beinhaltet auch den Bollinger Bands Indikator, wobei das mittlere Band als Basislinie verwendet wird und die oberen und unteren Bands zwei Standardabweichungen davon entfernt liegen. Ein Kaufsignal wird erzeugt, wenn der Preis über das mittlere Band von unten bricht. Ein Verkaufssignal wird erzeugt, wenn der Preis unter das mittlere Band von oben bricht.
Vorteile
- Verwenden Sie ATR, um die Volatilität dynamisch zu berechnen und Markttrendänderungen schnell zu erfassen
- Die Kombination von Bollinger Bands macht Handelssignale zuverlässiger
- Anpassbare Parameter für verschiedene Marktumgebungen
Risiken
- Anfällig für falsche Signale auf seitlichen Märkten
- Falsche Parameter-Einstellungen können zu einem Überhandel führen
- Nicht möglich, Trendumkehrpunkte mit einer gewissen Verzögerung zu bestimmen
Optimierungsrichtlinien
- Optimierung des ATR-Periodenparameters zur Verringerung der Lärmbelastung durch Filter
- Einbeziehung anderer Indikatoren zur Bestimmung von Unterstützung/Widerstand zur Verringerung der Wahrscheinlichkeit einer Gewinnrückführung
- Hinzufügen von Positionsgrößenregelungen zum Limit pro Verlust
Zusammenfassung
Die Supertrend Bollinger Bands Strategie integriert die Stärken mehrerer technischer Indikatoren und nutzt einen dynamischen Trailing-Stop-Mechanismus, um Markttrends effektiv zu verfolgen.
/*backtest
start: 2022-11-24 00:00:00
end: 2023-11-30 00:00:00
period: 1d
basePeriod: 1h
exchanges: [{"eid":"Futures_Binance","currency":"BTC_USDT"}]
*/

// This source code is subject to the terms of the Mozilla Public License 2.0 at https://mozilla.org/MPL/2.0/
// © KivancOzbilgic


//@version=4
strategy("SuperTrend STRATEGY", overlay=true)
Periods = input(title="ATR Period", type=input.integer, defval=10)
src = input(hl2, title="Source")
Multiplier = input(title="ATR Multiplier", type=input.float, step=0.1, defval=3.0)
changeATR= input(title="Change ATR Calculation Method ?", type=input.bool, defval=true)
showsignals = input(title="Show Buy/Sell Signals ?", type=input.bool, defval=false)
highlighting = input(title="Highlighter On/Off ?", type=input.bool, defval=true)
barcoloring = input(title="Bar Coloring On/Off ?", type=input.bool, defval=true)
atr2 = sma(tr, Periods)
atr= changeATR ? atr(Periods) : atr2
up=src-(Multiplier*atr)
up1 = nz(up[1],up)
up := close[1] > up1 ? max(up,up1) : up
dn=src+(Multiplier*atr)
dn1 = nz(dn[1], dn)
dn := close[1] < dn1 ? min(dn, dn1) : dn
trend = 1
trend := nz(trend[1], trend)
trend := trend == -1 and close > dn1 ? 1 : trend == 1 and close < up1 ? -1 : trend
upPlot = plot(trend == 1 ? up : na, title="Up Trend", style=plot.style_linebr, linewidth=2, color=color.green)
buySignal = trend == 1 and trend[1] == -1
plotshape(buySignal ? up : na, title="UpTrend Begins", location=location.absolute, style=shape.circle, size=size.tiny, color=color.green, transp=0)
plotshape(buySignal and showsignals ? up : na, title="Buy", text="Buy", location=location.absolute, style=shape.labelup, size=size.tiny, color=color.green, textcolor=color.white, transp=0)
dnPlot = plot(trend == 1 ? na : dn, title="Down Trend", style=plot.style_linebr, linewidth=2, color=color.red)
sellSignal = trend == -1 and trend[1] == 1
plotshape(sellSignal ? dn : na, title="DownTrend Begins", location=location.absolute, style=shape.circle, size=size.tiny, color=color.red, transp=0)
plotshape(sellSignal and showsignals ? dn : na, title="Sell", text="Sell", location=location.absolute, style=shape.labeldown, size=size.tiny, color=color.red, textcolor=color.white, transp=0)
mPlot = plot(ohlc4, title="", style=plot.style_circles, linewidth=0)
longFillColor = highlighting ? (trend == 1 ? color.green : color.white) : color.white
shortFillColor = highlighting ? (trend == -1 ? color.red : color.white) : color.white
fill(mPlot, upPlot, title="UpTrend Highligter", color=longFillColor)
fill(mPlot, dnPlot, title="DownTrend Highligter", color=shortFillColor)
FromMonth = input(defval = 9, title = "From Month", minval = 1, maxval = 12)
FromDay   = input(defval = 1, title = "From Day", minval = 1, maxval = 31)
FromYear  = input(defval = 2018, title = "From Year", minval = 999)
ToMonth   = input(defval = 1, title = "To Month", minval = 1, maxval = 12)
ToDay     = input(defval = 1, title = "To Day", minval = 1, maxval = 31)
ToYear    = input(defval = 9999, title = "To Year", minval = 999)
start     = timestamp(FromYear, FromMonth, FromDay, 00, 00)
finish    = timestamp(ToYear, ToMonth, ToDay, 23, 59)
window()  => time >= start and time <= finish ? true : false
longCondition = buySignal
if (longCondition)
    strategy.entry("BUY", strategy.long)
shortCondition = sellSignal
if (shortCondition)
    strategy.entry("SELL", strategy.short)
buy1= barssince(buySignal)
sell1 = barssince(sellSignal)
color1 = buy1[1] < sell1[1] ? color.green : buy1[1] > sell1[1] ? color.red : na
barcolor(barcoloring ? color1 : na)
- Schnelle und langsame EMA-Golden Cross-Durchbruchstrategie
- Der Wert des Scalping-Systems ist der Wert des Scalping-Systems, das für den Scalping verwendet wird.
- Strategie zur Verfolgung der Volatilität
- Durchbruchstrategie zur Positionierung von Schwingungen mit mehreren Indikatoren
- RSI-Durchschnittsumkehr Quantitative Handelsstrategie auf der Grundlage des RSI-Durchschnitts
- Strategie zur Umkehrung des doppelten gleitenden Durchschnitts
- Umgekehrte Kreuzungsstrategie für gleitende Durchschnittswerte
- Hull-MA-Kanal und Swing-Handelsstrategie mit linearer Regression
- Triple SuperTrend Quantitative Handelsstrategie
- Supertrend-Handelsstrategie auf der Grundlage von ATR- und MA-Kombination
- Strategie zur doppelten Umkehrverfolgung
- Die Strategie des Heiligen Grals
- Strategie für mehrfache Prozentsatzgewinne
- Geänderte Preis-Volumen-Trendstrategie auf Basis von Preis-Volumen-Veränderungen
- Strategie für eine doppelte Kreuzung von gleitenden Durchschnitten
- Doppelindikatoren-Combo Crazy Intraday Scalping-Strategie
- Dynamische Netzhandelsstrategie
- Handelsstrategie mit doppelten gleitenden Durchschnitten
- Früherer Gewinnspiel mit gleitendem Durchschnitt Eröffnungsgespräch Exitstrategie
- Monatliche parabolische Ausbruchsstrategie