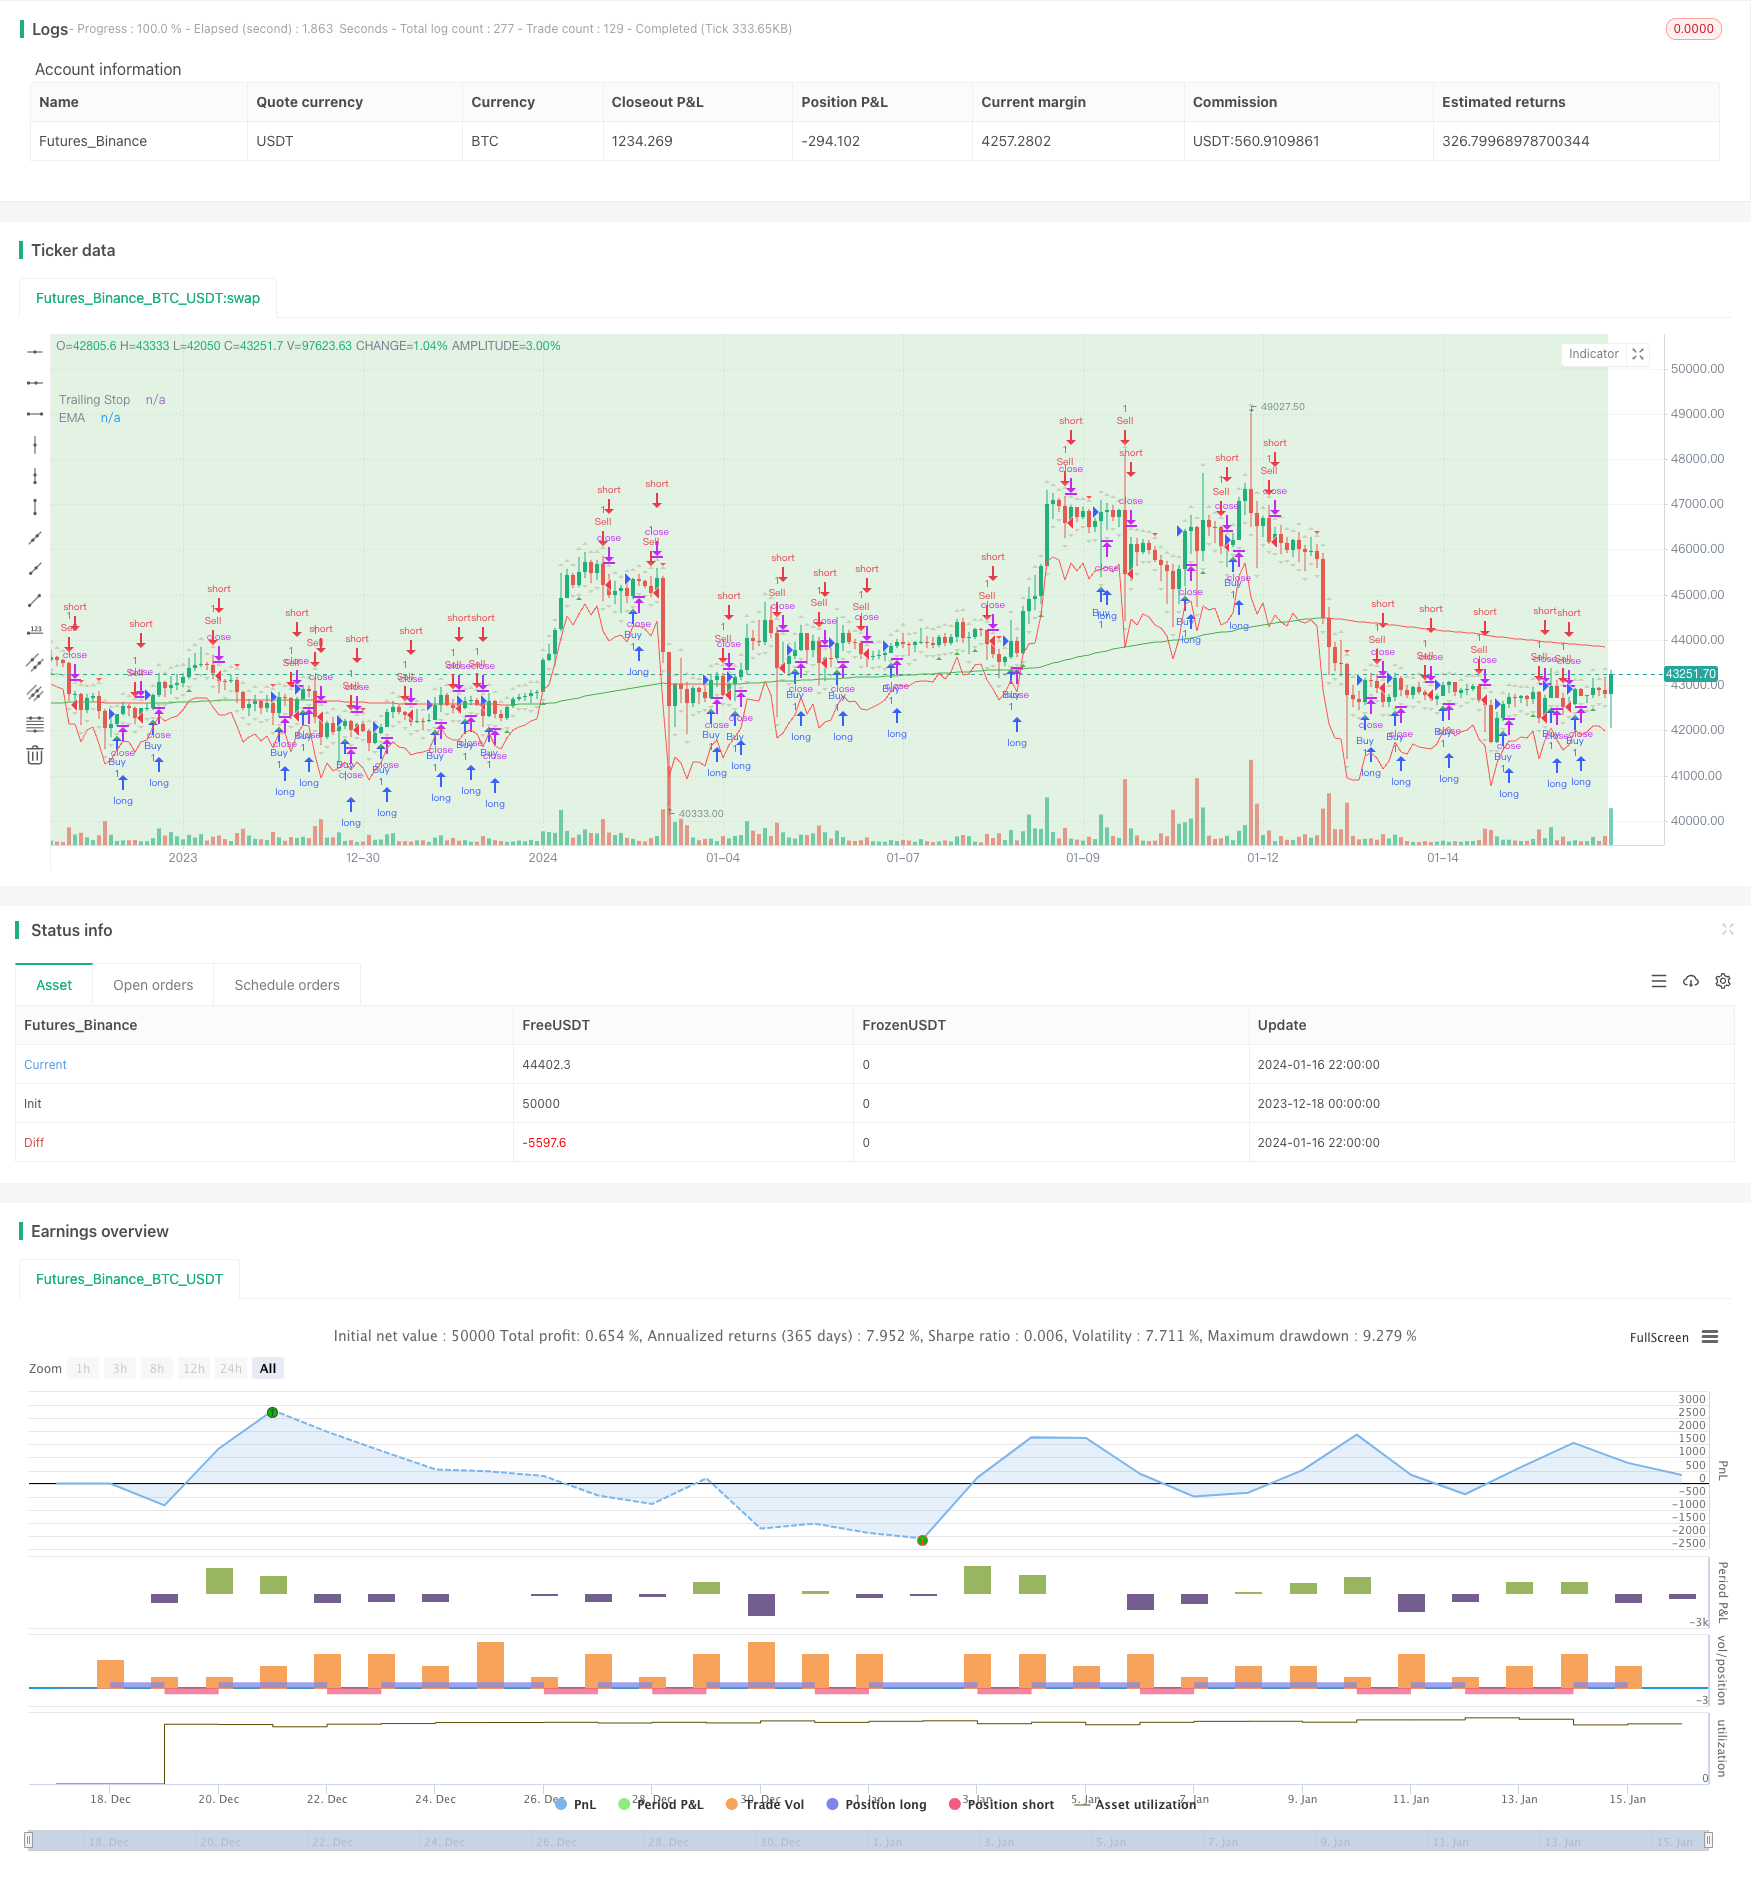
Handelsstrategie auf Basis von Angebots- und Nachfragezonen mit EMA und Trailing Stop
Schriftsteller:ChaoZhang, Datum: 2024-01-18 16.41:16Tags:

Übersicht
Die Strategie verwendet Angebot und Nachfragezonen, Exponential Moving Average (EMA) und Average True Range (ATR) Trailing Stop für Handelssignale. Benutzer können EMA-Einstellungen und Signalsichtbarkeit anpassen. Die Strategie markiert Höhere Hohe (HH), Niedrigere Niedrige (LL), Niedrigere Hohe (LH) und Höhere Niedrige (HL) Zonen. Die Signale werden nach der dritten Kerze angezeigt, die für das Backtesting geeignet ist.
Strategie Logik
Indikatorberechnungen
Exponentieller gleitender Durchschnitt (EMA):
- Die EMA wird anhand der Schlusskurs für einen bestimmten Zeitraum berechnet (Standard: 200).
- Formel: EMA = (Price_t x α) + (EMA_t-1 x (1 - α)), wobei α = 2/(Länge + 1)
Durchschnittliche tatsächliche Reichweite (ATR):
- ATR misst die Marktvolatilität anhand der tatsächlichen Preisspanne.
- Die wahre Reichweite ist die größte von:
- Hochstrom minus niedrigem Strom
- Absoluter Wert des aktuellen Höchstwerts minus vorheriger Schlusskurs
- Absoluter Wert des aktuellen Tiefstands minus vorheriger Tiefstand
- ATR verwendet in der Regel 14 Perioden.
Bei der Ermittlung des EMA für Trend und des ATR für den volatilitätsbasierten Trailing Stop.
Identifizierung der Zonen für Angebot und Nachfrage
Es identifiziert
-
Höherer Höher (HH): Aktueller Höhepunkt > vorheriger Höhepunkt, Aufwärtsdynamik.
-
Niedrigere Niedrigere (LL): Aktueller Tiefpunkt < vorheriger Tiefpunkt, Abwärtstrend.
-
Höher Niedrig (HL): aktueller Tiefpunkt > vorheriger Tiefpunkt, Aufwärtsfortschritt.
-
Niedriges Hoch (LH): Aktueller Höhepunkt < vorheriger Höhepunkt, weiter nach unten.
Verwendet mit Trends, um Umkehrungen oder Fortsetzungen zu erkennen.
Einreise und Ausreise
Eintrittssignal: Kauf/Verkauf bei Abschluss der dritten Kerze über/unter dem vorherigen Höchst-/Tiefwert.
Ausfahrt: Verzögerungsstop-Loss basierend auf ATR.
Vorteile
- Trends, Umkehrungen, Volatilität für robuste Signale kombiniert.
- Nachfrage/Angebotszonen kennzeichnen die wichtigsten S/R.
- Dynamischer ATR-Stopp passt sich an die Volatilität an.
- Anpassbare Parameter.
- Einfache Einstiegsregeln.
Risiken und Verbesserungen
- Falsche Signale: Optimieren Sie die EMA-Länge.
- Ein hoher ATR-Multiplikator riskiert, Trends zu verfolgen.
- Betrachten Sie zusätzliche Filter für Einträge.
- Testen Sie einen trendorientierten Ansatz.
Schlussfolgerung
Die Basisstrategie ermöglicht Erweiterungen und Kombinationen.
/*backtest
start: 2023-12-18 00:00:00
end: 2024-01-17 00:00:00
period: 2h
basePeriod: 15m
exchanges: [{"eid":"Futures_Binance","currency":"BTC_USDT"}]
*/

//@version=5
strategy("Supply and Demand Zones with EMA and Trailing Stop", shorttitle="SD Zones", overlay=true)

showBuySignals = input(true, title="Show Buy Signals", group="Signals")
showSellSignals = input(true, title="Show Sell Signals", group="Signals")
showHLZone = input(true, title="Show HL Zone", group="Zones")
showLHZone = input(true, title="Show LH Zone", group="Zones")
showHHZone = input(true, title="Show HH Zone", group="Zones")
showLLZone = input(true, title="Show LL Zone", group="Zones")

emaLength = input(200, title="EMA Length", group="EMA Settings")
atrLength = input(14, title="ATR Length", group="Trailing Stop")
atrMultiplier = input(2, title="ATR Multiplier", group="Trailing Stop")

// Function to identify supply and demand zones
getZones(src, len, mult) =>
    base = request.security(syminfo.tickerid, "D", close)
    upper = request.security(syminfo.tickerid, "D", high)
    lower = request.security(syminfo.tickerid, "D", low)
    multiplier = request.security(syminfo.tickerid, "D", mult)
    zonetype = base + multiplier * len
    zone = src >= zonetype
    [zone, upper, lower]

// Identify supply and demand zones
[supplyZone, _, _] = getZones(close, high[1] - low[1], 1)
[demandZone, _, _] = getZones(close, high[1] - low[1], -1)

// Plot supply and demand zones
bgcolor(supplyZone ? color.new(color.red, 80) : na)
bgcolor(demandZone ? color.new(color.green, 80) : na)

// EMA with Linear Weighted method
ema = ta.ema(close, emaLength)

// Color code EMA based on its relation to candles
emaColor = close > ema ? color.new(color.green, 0) : close < ema ? color.new(color.red, 0) : color.new(color.yellow, 0)

// Plot EMA
plot(ema, color=emaColor, title="EMA")

// Entry Signal Conditions after the third candle
longCondition = ta.crossover(close, high[1]) and bar_index >= 2
shortCondition = ta.crossunder(close, low[1]) and bar_index >= 2

// Trailing Stop using ATR
atrValue = ta.atr(atrLength)
trailStop = close - atrMultiplier * atrValue

// Strategy Entry and Exit
if (longCondition)
    strategy.entry("Buy", strategy.long)
    strategy.exit("TrailStop", from_entry="Buy", loss=trailStop)

if (shortCondition)
    strategy.entry("Sell", strategy.short)
    strategy.exit("TrailStop", from_entry="Sell", loss=trailStop)

// Plot Entry Signals
plotshape(series=showBuySignals ? longCondition : na, title="Buy Signal", color=color.new(color.green, 0), style=shape.triangleup, location=location.belowbar)
plotshape(series=showSellSignals ? shortCondition : na, title="Sell Signal", color=color.new(color.red, 0), style=shape.triangledown, location=location.abovebar)

// Plot Trailing Stop
plot(trailStop, color=color.new(color.red, 0), title="Trailing Stop")

// Plot HH, LL, LH, and HL zones
plotshape(series=showHHZone and ta.highest(high, 2)[1] and ta.highest(high, 2)[2] ? 1 : na, title="HH Zone", color=color.new(color.blue, 80), style=shape.triangleup, location=location.abovebar)
plotshape(series=showLLZone and ta.lowest(low, 2)[1] and ta.lowest(low, 2)[2] ? 1 : na, title="LL Zone", color=color.new(color.blue, 80), style=shape.triangledown, location=location.belowbar)
plotshape(series=showLHZone and ta.highest(high, 2)[1] and ta.lowest(low, 2)[2] ? 1 : na, title="LH Zone", color=color.new(color.orange, 80), style=shape.triangleup, location=location.abovebar)
plotshape(series=showHLZone and ta.lowest(low, 2)[1] and ta.highest(high, 2)[2] ? 1 : na, title="HL Zone", color=color.new(color.orange, 80), style=shape.triangledown, location=location.belowbar)
- Eine Optimierung der Trendstrategie basierend auf dem Ichimoku Cloud Chart
- Kreuztrendumkehrung in Kombination mit drei Zehn-Oszillator-Doppelstrategien
- Fibonacci-Durchschnittskerze mit gleitender Durchschnittsstrategie für den quantitativen Handel
- Einfache Stop & Buy-Strategie basierend auf Prozentsatz
- Eine Analyse der quantitativen Handelsstrategie auf Basis der Gauss-Fehlerfunktion
- RSI-Umkehrstrategie
- RSI-VWAP kurzfristige Quant-Strategie
- Anpassungsfähige Kryptowährungs-Grid-Handelsstrategie auf der Grundlage von Arbitrage
- Eine doppelte Kreuzung der gleitenden Durchschnittswerte
- Handelsstrategie mit doppelten gleitenden Durchschnitten
- Bollinger Bands-basierte Trendstrategie
- Erweiterte Preisvolumen-Trendstrategie
- Kurzfristige Strategie zur Beobachtung von Schwankungen
- Aggressive quantitative Bottom-Snipping-Strategie
- Trend nach Handelsstrategie auf Basis des T3-Indikators
- Kurzfristige Handelsstrategie auf Basis des Stochastischen Index
- London SMA Cross ETH Umkehrhandelsstrategie
- Trendverfolgungsstrategie auf Basis von SMA und ATR
- Hilo-Aktivator Kauf-Verkauf-Signalstrategie
- Strategie des exponentiell glätteten stochastischen Oszillators