Thermometer strategies in the practice and application of inventor quantization platforms
Author: Goodness, Created: 2019-07-20 14:34:05, Updated: 2023-10-23 17:30:02
Why is it called a thermometer? We named the system after its adaptability to conversion and trading in both market, volatility and trend modes. The system was derived from our observation of the success of a particular system in a particular market area.
First, we create a function to help determine the market pattern. Based on the output of this function, the thermostat switches from following to short oscillation mode.
The trend tracking pattern uses a trend tracking mechanism similar to the one in the Brynne band. The short swing system is an open breakthrough that includes pattern recognition. The function compares the distance of the market's swing to the actual distance of the market's move:
Abs (closing price - closing price[29])/ (highest price) (30) - lowest price (lowest price, 30 days) * 100
The function generates a value between 0 and 100. The larger the value, the less crowded the current market is. If the function returns a value less than 20, the system enters short-swing mode.
Essentially, most markets are showing a swinging movement, with the system trying to grab the fluctuations and make a meager profit out of them. The thermometer tries to accomplish this feat by buying/selling small market impulses. If the fluctuations are large enough, the system switches modes.
Through in-depth analysis of short-term volatility, we find that sometimes it is better to buy than to sell, and vice versa. These times can be determined by simple visual patterns. If today's closing price is higher than yesterday's high, low, and closing price (also known as the key point of the day), then we think that tomorrow's market action is likely to be bearish. However, if today's closing price is lower than yesterday's average high, low, and closing price, then today's market may be bearish.
In the inventor quantification platform, the thermostat strategy is a very popular strategy, where the user adds some additional trading logic according to their needs, to make the strategy perform better.
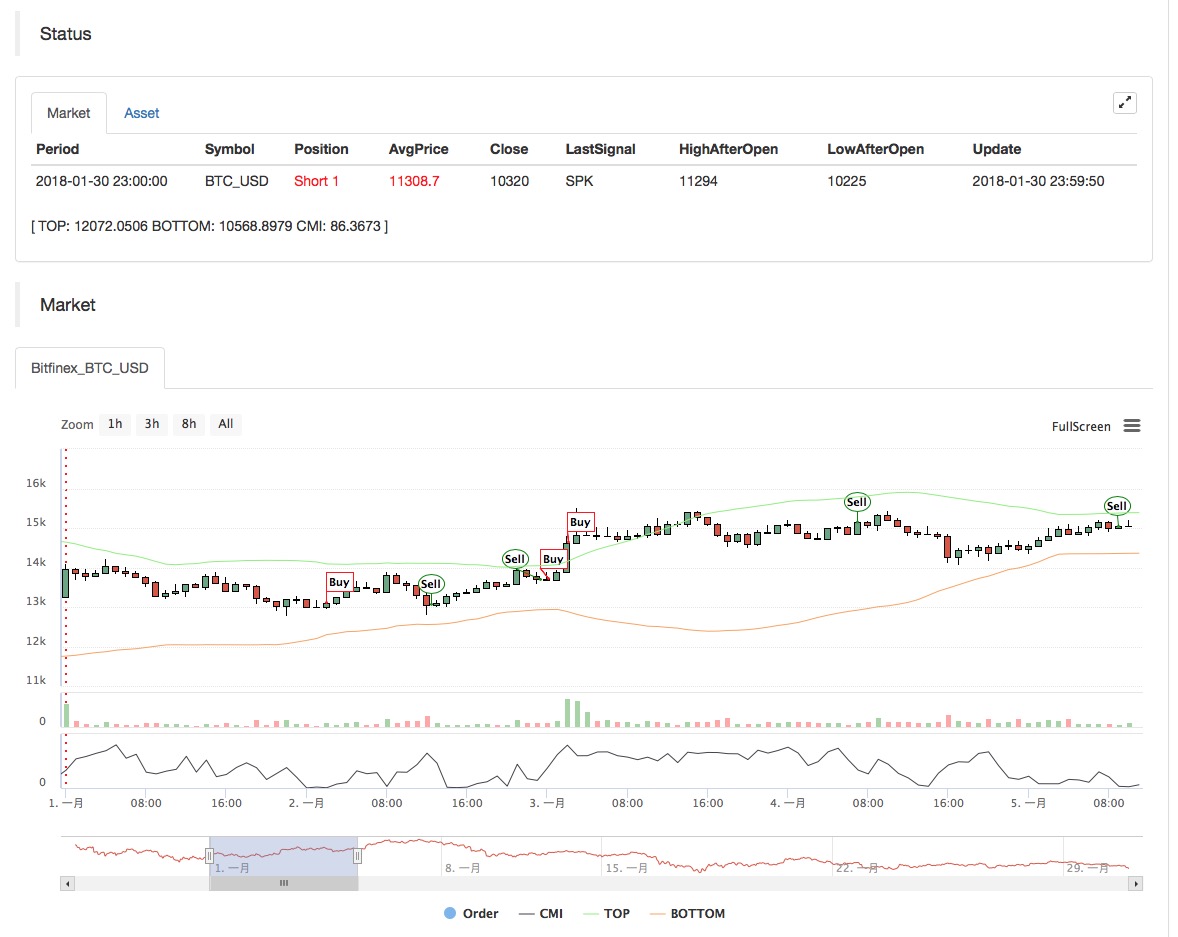
The main image: The formula for the trajectory is: TOP^^MAC+N_TMPTMP;//Brin channel trajectory Bottom of the track: Bottom of the track
This is the second image: CMI formula: CMI:ABS ((C-REF ((C,N_CMI-1))/HHV ((H,N_CMI) -LLV ((L,N_CMI)) *100;//0-100 The larger the value, the stronger the trend, and the CMI <20 is the shocking pattern, and the CMI>20 is the trend.
Code ((My language):
MAC:=MA(CLOSE,N);
TMP:=STD(CLOSE,N);
TOP^^MAC+N_TMP*TMP;      // 布林通道上轨
BOTTOM^^MAC-N_TMP*TMP;   // 布林通道下轨
BBOLL:=C>MAC;
SBOLL:=C<MAC;
N_CMI:=30;

CMI:ABS(C-REF(C,N_CMI-1))/(HHV(H,N_CMI)-LLV(L,N_CMI))*100; //0-100 取值越大,说明趋势越强,CMI<20震荡模式,CMI>20为趋势

N_KD:=9;
M1:=3;
M2:=3;
RSV:=(CLOSE-LLV(LOW,N_KD))/(HHV(HIGH,N_KD)-LLV(LOW,N_KD))*100; //收盘价与N周期最低值做差,N周期最高值与N周期最低值做差,两差之间做比值。

K:=SMA(RSV,M1,1); //RSV的移动平均值
D:=SMA(K,M2,1);   //K的移动平均值
MIND:=30;
BKD:=K>D AND D<MIND;
SKD:=K<D AND D>100-MIND;

// 震荡模式
BUYPK1:=CMI < 20 AND BKD;  //震荡多单买平开
SELLPK1:=CMI < 20 AND SKD; //震荡空单卖平开

// 趋势模式下原有震荡持仓的处理
SELLY1:=REF(CMI,BARSBK) < 20 AND C>BKPRICE*(1+0.01*STOPLOSS*3) AND K<D; //震荡多单止盈
BUYY1:=REF(CMI,BARSSK) < 20 AND C<SKPRICE*(1-0.01*STOPLOSS*3) AND K>D;  //震荡空单止盈

// 趋势模式
BUYPK2:=CMI >= 20 AND C > TOP;        // 趋势多单买平开
SELLPK2:=CMI >= 20 AND C < BOTTOM;    // 趋势空单卖平开

// 趋势模式下原有震荡持仓的处理
SELLY2:=REF(CMI,BARSBK) >= 20 AND C>BKPRICE*(1+0.01*STOPLOSS*3) AND SBOLL;//趋势多单止盈
BUYY2:=REF(CMI,BARSSK) >= 20 AND C<SKPRICE*(1-0.01*STOPLOSS*3) AND BBOLL;//趋势空单止盈
SELLS2:=REF(CMI,BARSBK) >= 20 AND C<BKPRICE*(1-0.01*STOPLOSS) AND SBOLL;//趋势多单止损
BUYS2:=REF(CMI,BARSSK) >= 20 AND C>SKPRICE*(1+0.01*STOPLOSS) AND BBOLL;//趋势空单止损

IF BARPOS>N THEN BEGIN
    BUYPK1,BPK;
    SELLPK1,SPK;
    BUYPK2,BPK;
    SELLPK2,SPK;
END
BUYY1,BP(SKVOL);
BUYY2,BP(SKVOL);
BUYS2,BP(SKVOL);
SELLY1,SP(BKVOL);
SELLY2,SP(BKVOL);
SELLS2,SP(BKVOL);
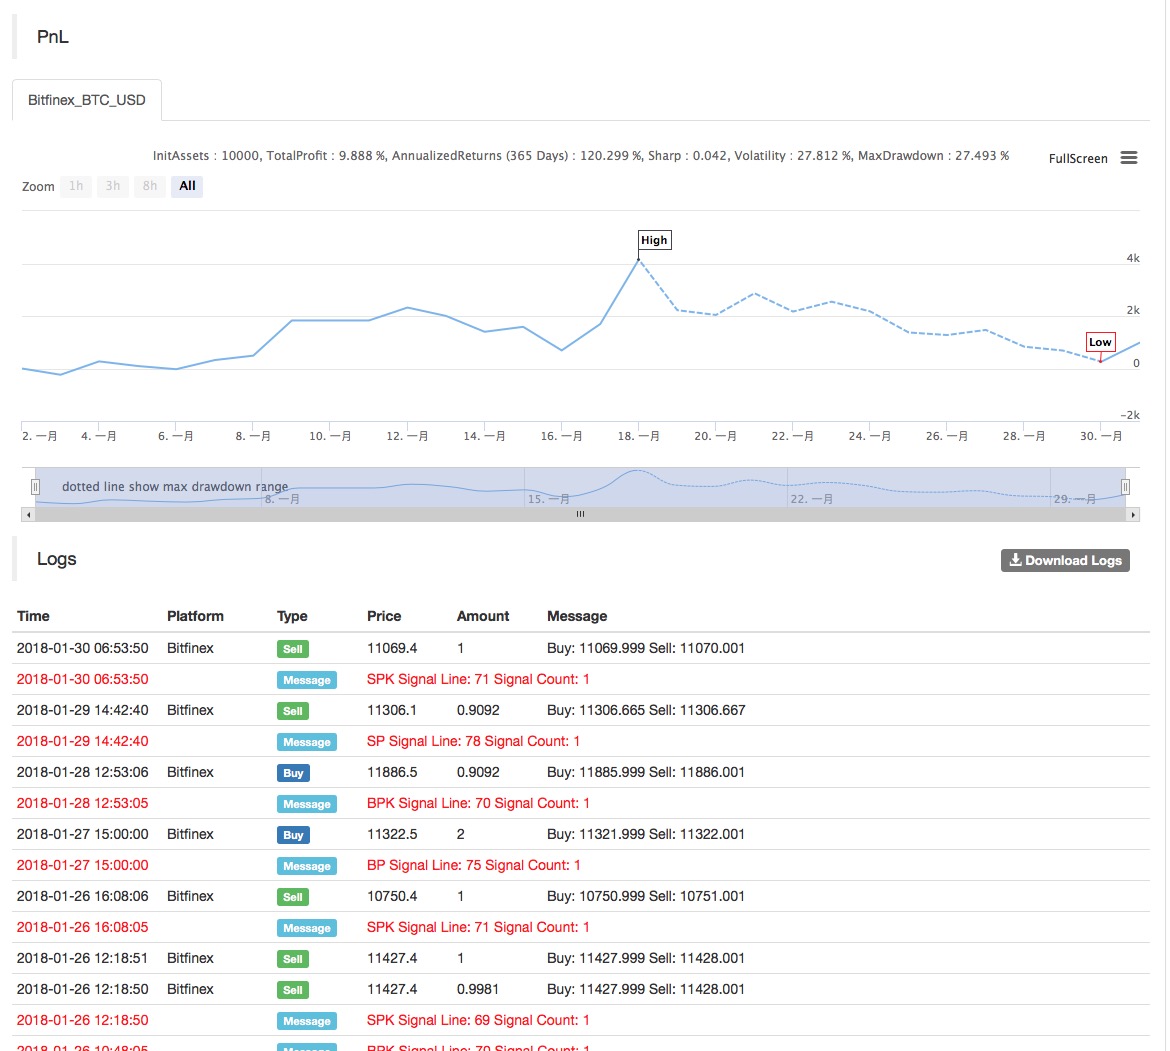
The results of the strategy were as follows:


For more information, please see:https://www.fmz.com/strategy/129086
- Quantitative Practice of DEX Exchanges (2) -- Hyperliquid User Guide
- DEX exchange quantitative practices ((2) -- Hyperliquid user guide
- Quantitative Practice of DEX Exchanges (1) -- dYdX v4 User Guide
- Introduction to Lead-Lag Arbitrage in Cryptocurrency (3)
- DEX exchange quantitative practice ((1) -- dYdX v4 user guide
- Introduction to the Lead-Lag suite in digital currency (3)
- Introduction to Lead-Lag Arbitrage in Cryptocurrency (2)
- Introduction to the Lead-Lag suite in the digital currency (2)
- Discussion on External Signal Reception of FMZ Platform: A Complete Solution for Receiving Signals with Built-in Http Service in Strategy
- Discussing FMZ platform external signal reception: a complete set of strategies for the reception of signals from built-in HTTP services
- Introduction to Lead-Lag Arbitrage in Cryptocurrency (1)
- Visualizing modules to build trading strategies - out
- KENTNA channel upgraded version of the KENTNA kingkeltner strategy
- Quantitative trading strategies with a trade index weighting
- Introducing the Aroon indicator
- The relative strengths and weaknesses of price-based quantitative trading strategies
- Introducing the adaptive moving average KAMA
- Implementation of Dual Thrust trading algorithms using My language on the inventor's quantification platform
- Introduction to RangeBreak Strategy
- Trading strategy based on box theory
- Trading strategies based on box theory that support commodity futures and digital currencies
- The strategic framework for the indicators
- 6 simple strategies and practices for beginners in quantitative digital currency trading
- Visualizing modules to build trading strategies - progress
- Pivot Point day trading system
- Three potential models in quantitative trading
- RangeBreak strategy combined with real-world use of volatility
- Neural network and digital currency quantitative trading series ((1)
LSTM predicts Bitcoin price - Principles and writing of stop-loss models
- Visualizing modules to build trading strategies - a basic understanding
- Digital currency adaptive even-line trading system and KAMA algorithm solver based inventor-based quantitative trading software