Indicator: WaveTrend Oscillator
Author: ChaoZhang, Date: 2022-05-06 18:40:27Tags: EMASMA
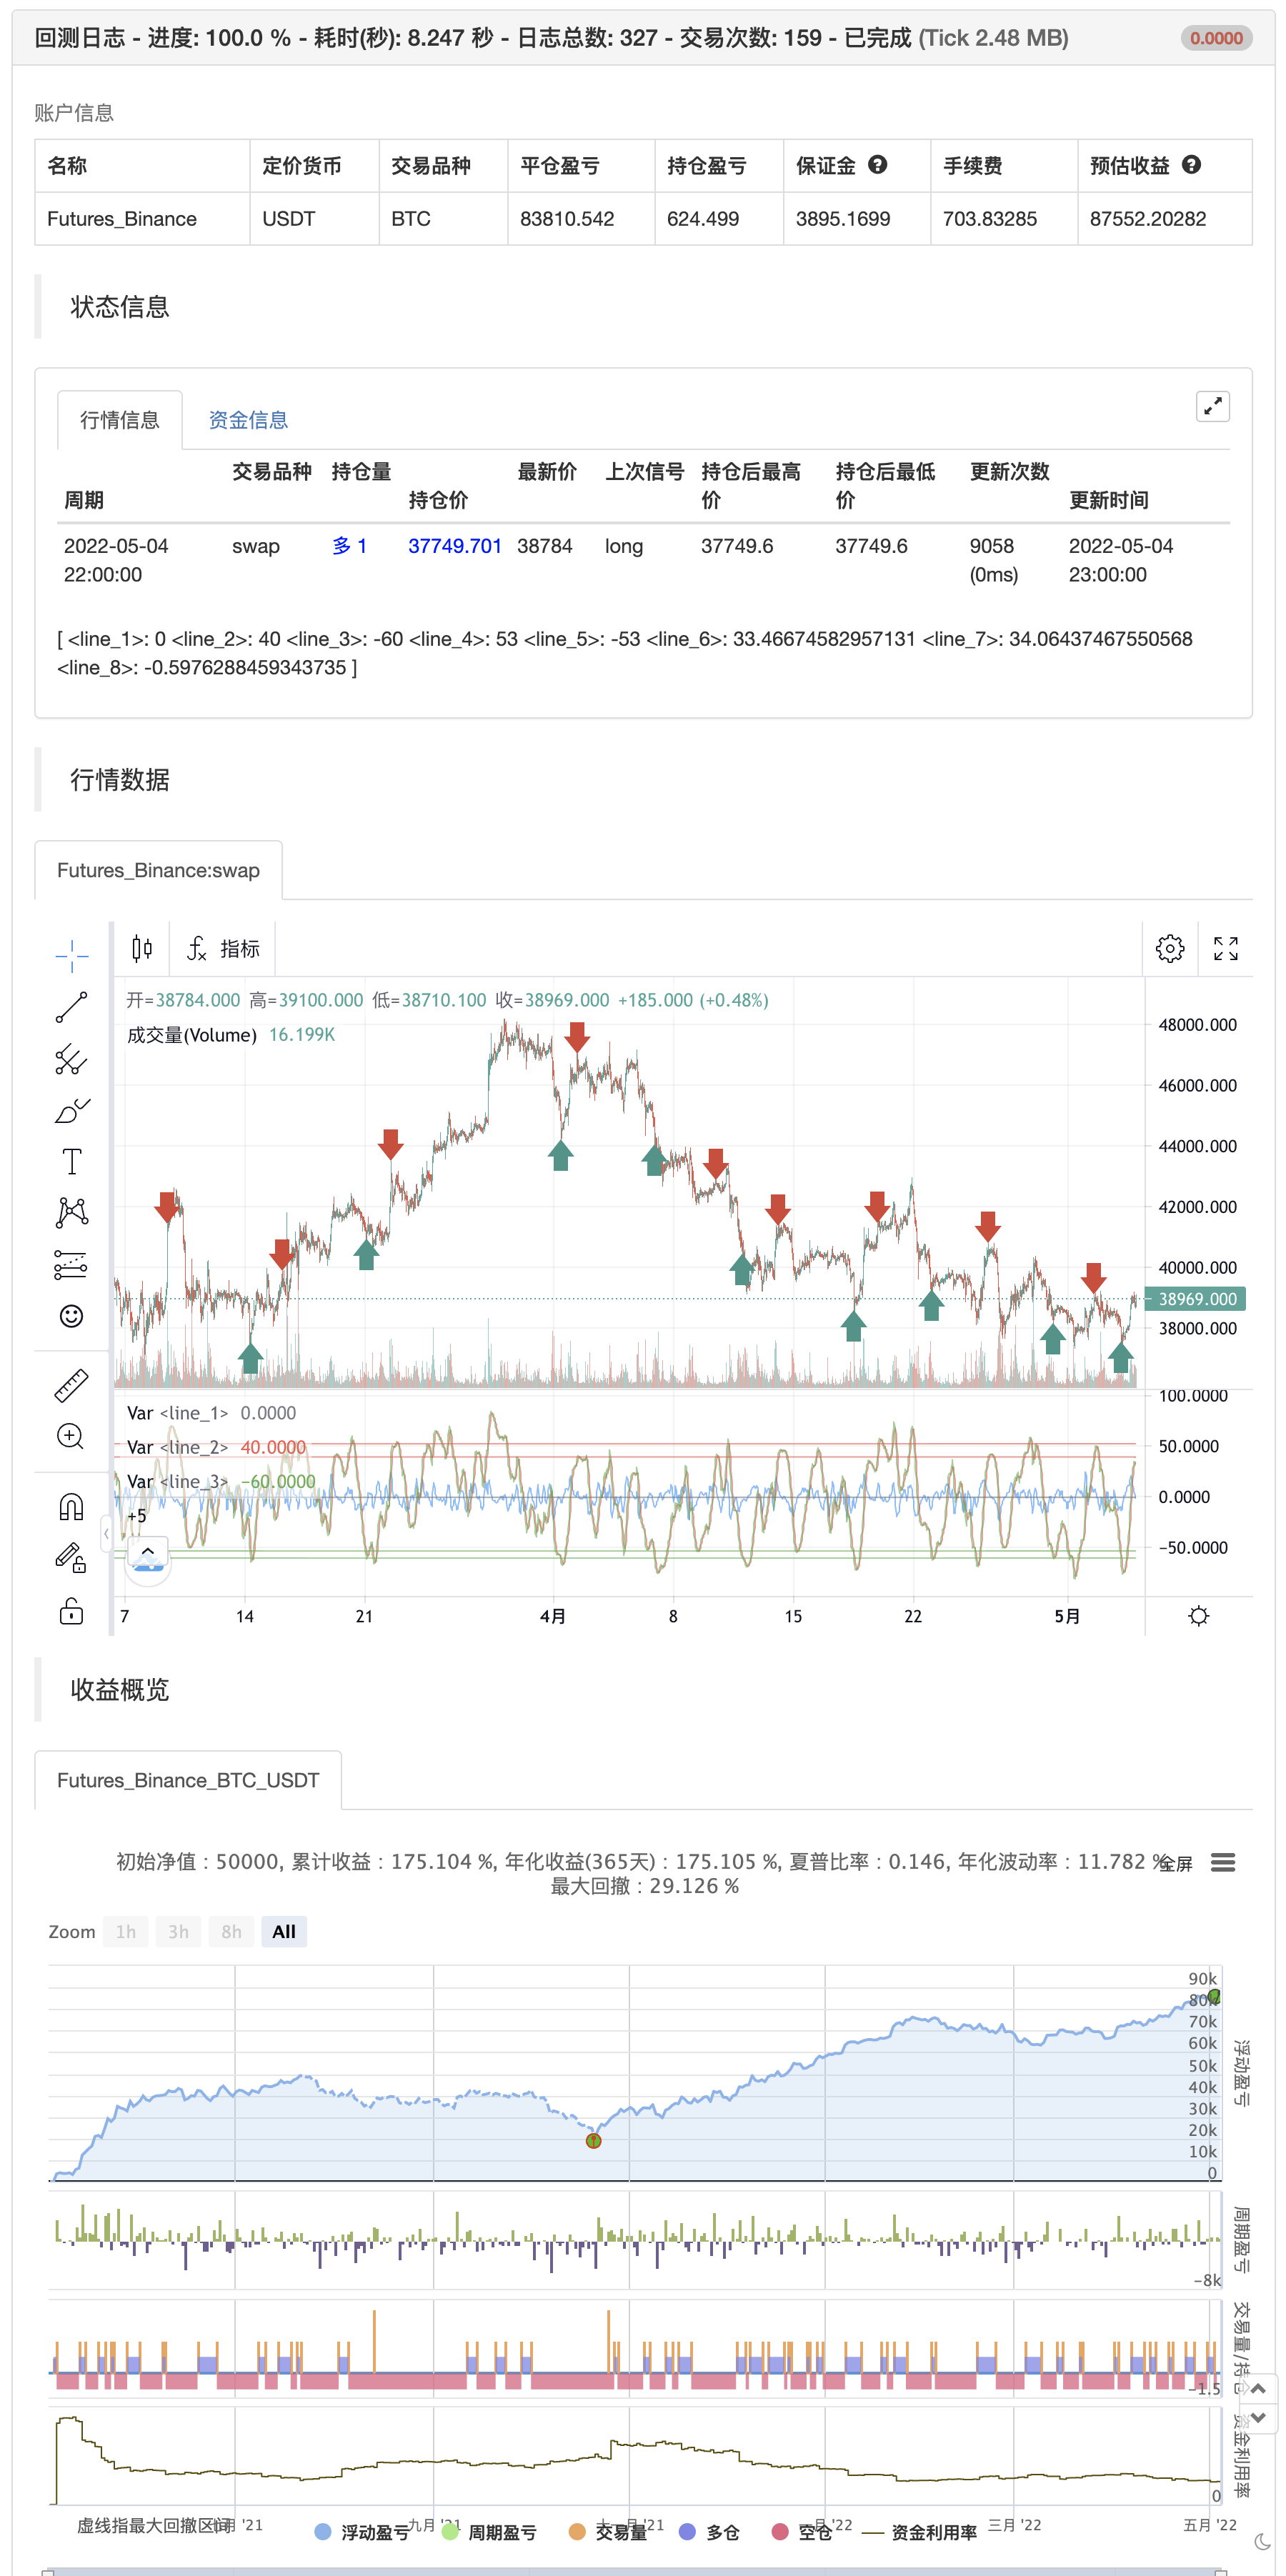
WaveTrend Oscillator is a port of a famous TS /MT indicator. When the oscillator is above the overbought band (red lines) and crosses down the signal (dotted line), it is usually a good SELL signal. Similarly, when the oscillator crosses above the signal when below the Oversold band (green lines), it is a good BUY signal.
I have marked some cross-overs in the above chart. As you can see, they are not the only useful signals WT generates. Try it on your instrument and let me know what you think.
Reassessment

/*backtest
start: 2021-05-05 00:00:00
end: 2022-05-04 23:59:00
period: 1h
basePeriod: 15m
exchanges: [{"eid":"Futures_Binance","currency":"BTC_USDT"}]
args: [["v_input_3",40]]
*/

//
// @author LazyBear
//
// If you use this code in its original/modified form, do drop me a note.
//
study(title="WaveTrend [LazyBear]", shorttitle="WT_LB")
n1 = input(10, "Channel Length")
n2 = input(21, "Average Length")
obLevel1 = input(60, "Over Bought Level 1")
obLevel2 = input(53, "Over Bought Level 2")
osLevel1 = input(-60, "Over Sold Level 1")
osLevel2 = input(-53, "Over Sold Level 2")

ap = hlc3
esa = ta.ema(ap, n1)
d = ta.ema(math.abs(ap - esa), n1)
ci = (ap - esa) / (0.015 * d)
tci = ta.ema(ci, n2)

wt1 = tci
wt2 = ta.sma(wt1,4)

plot(0, color=color.gray)
plot(obLevel1, color=color.red)
plot(osLevel1, color=color.green)
plot(obLevel2, color=color.red, style=3)
plot(osLevel2, color=color.green, style=3)

plot(wt1, color=color.green)
plot(wt2, color=color.red, style=3)
plot(wt1-wt2, color=color.blue, transp=80)
if wt1 >obLevel1
    strategy.entry("entry short", strategy.short)
else if wt1 < osLevel1
    strategy.entry("entry long", strategy.long)
Related
- Multi-Wave Trend Crossing Risk Management Quantitative Strategy
- Multi-EMA Crossover Momentum Strategy
- Dual EMA Volume Trend Confirmation Strategy for Quantitative Trading
- Advanced Quantitative Trend Following and Cloud Reversal Composite Trading Strategy
- EMA Crossover Momentum Scalping Strategy
- SMA Dual Moving Average Crossover Strategy
- Trading ABC
- EMA, SMA, Moving Average Crossover, Momentum Indicator
- EMA5 and EMA13 Crossover Strategy
- Multi-EMA Trend Momentum Recognition and Stop-Loss Trading System
- Super Moving Average and Upperband Crossover Strategy
More
- SuperTrend
- Swing Highs/Lows & Candle Patterns
- TMA Overlay
- MACD + SMA 200 Strategy
- CM Sling Shot System
- Bollinger + RSI, Double Strategy v1.1
- Bollinger Bands Strategy
- Optimized Trend Tracker
- Monthly Returns in PineScript Strategies
- ADX and DI for v4
- MacD Custom Indicator-Multiple Time Frame+All Available Options!
- Squeeze Momentum Indicator
- AlphaTrend
- multiple timeframe trading
- Sentiment Oscillator
- Bitcoin Ando is used to trade in the currency of the currency of the currency of the currency.
- Turtles strategy
- Get your trend
- AlphaTrend use mfi
- The digital currency market has a new strategy for robbing coins (Teaching)