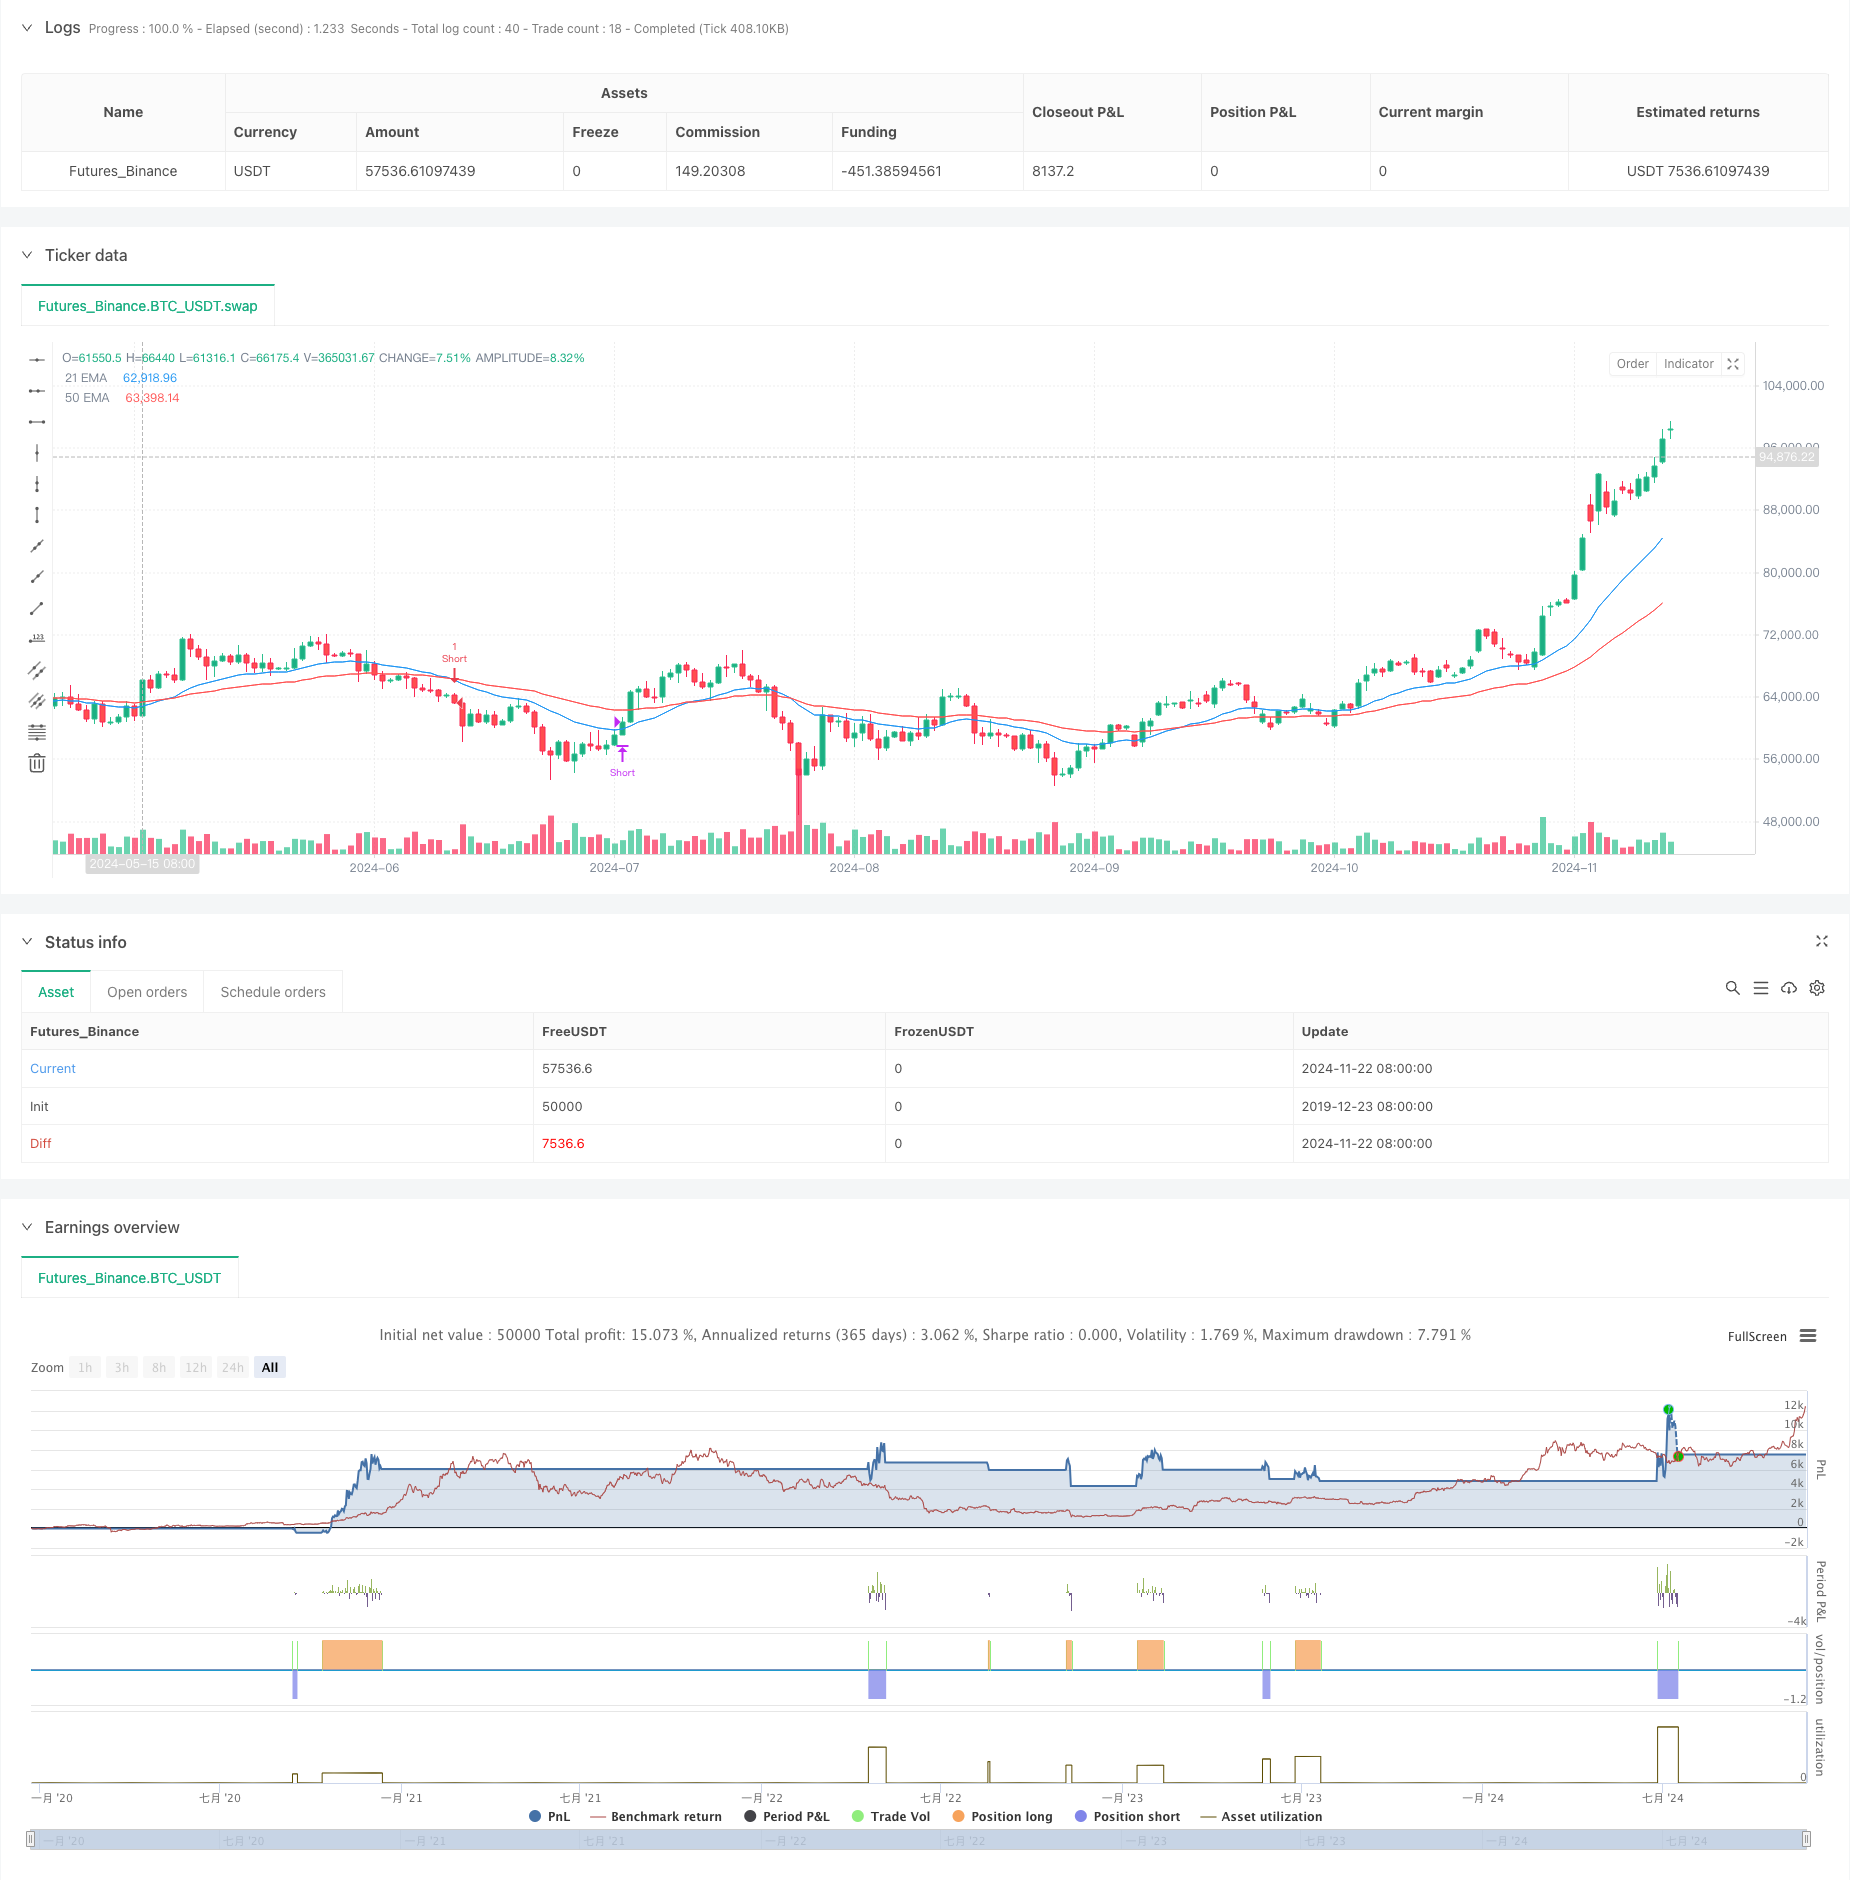
概述
这是一个基于双均线和成交量的趋势确认策略。该策略利用21周期和50周期指数移动平均线(EMA)的交叉信号,结合成交量分析来确认趋势方向,从而实现市场趋势的把握和交易机会的捕捉。策略采用1小时时间周期,通过技术指标的组合来提高交易的准确性和可靠性。
策略原理
策略核心逻辑包含三个主要部分:趋势判断、入场信号和出场信号。趋势判断通过比较当前成交量与20周期成交量均线来实现,高于均线视为看多趋势,低于均线视为看空趋势。入场信号基于21周期EMA和50周期EMA的交叉,结合成交量趋势确认。具体而言,当成交量大于均线且21周期EMA上穿50周期EMA时,触发做多信号;当成交量小于均线且21周期EMA下穿50周期EMA时,触发做空信号。出场信号则基于价格与任一均线的关系,当价格跌破任一均线时平多,当价格突破任一均线时平空。
策略优势
- 多重信号确认:通过结合均线交叉和成交量分析,提高了信号的可靠性
- 趋势跟踪:利用双均线系统有效捕捉市场趋势
- 风险控制:设置了明确的出场条件,可以及时止损
- 客观量化:策略完全基于技术指标,避免主观判断
- 适应性强:可应用于不同市场和时间周期
策略风险
- 震荡市场风险:在横盘震荡市场可能产生频繁假突破
- 滑点风险:高频交易可能面临较大滑点
- 资金管理风险:未设置具体的仓位控制机制
- 市场环境依赖:策略表现受市场趋势强度影响较大
策略优化方向
- 增加趋势强度过滤:可引入ADX等趋势强度指标
- 完善资金管理:添加动态仓位管理机制
- 优化出场机制:可考虑加入移动止损
- 增加回撤控制:设置最大回撤限制
- 优化参数选择:对各周期参数进行回测优化
总结
该策略通过结合双均线系统和成交量分析,构建了一个完整的趋势跟踪交易系统。策略设计合理,具有较好的可操作性和适应性。通过建议的优化方向,可进一步提升策略的稳定性和盈利能力。策略适合在趋势明显的市场环境中运用,但需要投资者注意风险控制和市场适应性分析。
策略源码
/*backtest
start: 2019-12-23 08:00:00
end: 2024-11-23 08:00:00
period: 1d
basePeriod: 1d
exchanges: [{"eid":"Futures_Binance","currency":"BTC_USDT"}]
*/

//@version=5
strategy("TATA Swing Trading Strategy with Volume and EMAs", overlay=true)

// Define the moving averages
ema21 = ta.ema(close, 21)
ema50 = ta.ema(close, 50)

// Calculate volume moving average for analysis
volumeMA = ta.sma(volume, 20)

// Trend Confirmation using Volume
isBullishTrend = volume > volumeMA
isBearishTrend = volume < volumeMA

// Long Entry Conditions
longCondition = isBullishTrend and ta.crossover(ema21, ema50)
// Short Entry Conditions
shortCondition = isBearishTrend and ta.crossunder(ema21, ema50)

// Exit Conditions
exitLong = close < ema21 or close < ema50
exitShort = close > ema21 or close > ema50

// Execute trades based on conditions
if (longCondition)
    strategy.entry("Long", strategy.long)

if (shortCondition)
    strategy.entry("Short", strategy.short)

if (exitLong)
    strategy.close("Long")

if (exitShort)
    strategy.close("Short")

// Plotting the EMAs
plot(ema21, color=color.blue, title="21 EMA")
plot(ema50, color=color.red, title="50 EMA")
相关推荐
- 多重波浪趋势交叉风险管理量化策略
- 多重指数移动平均线交叉动量策略
- EMA, SMA, 均线交叉, 动量指标
- 多重均线趋势动量识别与止损交易系统
- EMA交叉动量短线交易策略
- SMA双均线交叉策略
- Trading ABC
- EMA5与EMA13交叉策略
- 高级量化趋势追踪与云图反转复合交易策略
- 超级均线与Upperband交叉策略
更多内容
- 自适应波动率与动量量化交易系统(AVMQTS)
- 基于玻林格带与蜡烛图形态的高级趋势交易策略
- 基于ATR波动率和均线的自适应趋势跟踪退出策略
- 双均线动量趋势交易策略结合满实体烛线信号系统
- 双时间周期超级趋势与RSI策略优化系统
- 双均线交叉趋势追踪策略结合动态止盈止损系统
- 多重时间框架趋势跟踪交易系统(MTF-ATR-MACD)
- 双时间周期超趋势RSI智能交易策略
- 双重MACD价格行为突破追踪策略
- 多重均线趋势动量识别与止损交易系统
- 双均线RSI交叉动态止盈止损量化策略
- 增强型多周期动态自适应趋势跟踪交易系统
- 大幅波动突破型双向交易策略:基于点位阈值的多空进场系统
- 强化波林格均值回归量化策略
- 动态达瓦斯箱体突破与均线趋势确认交易系统
- EMA双均线交叉动态止盈止损量化交易策略
- 多重EMA交叉趋势跟踪与动态止盈止损优化策略
- 双均线交叉自适应动态止盈止损策略
- 双平台对冲平衡策略
- 双均线交叉动态止盈止损量化策略