概述
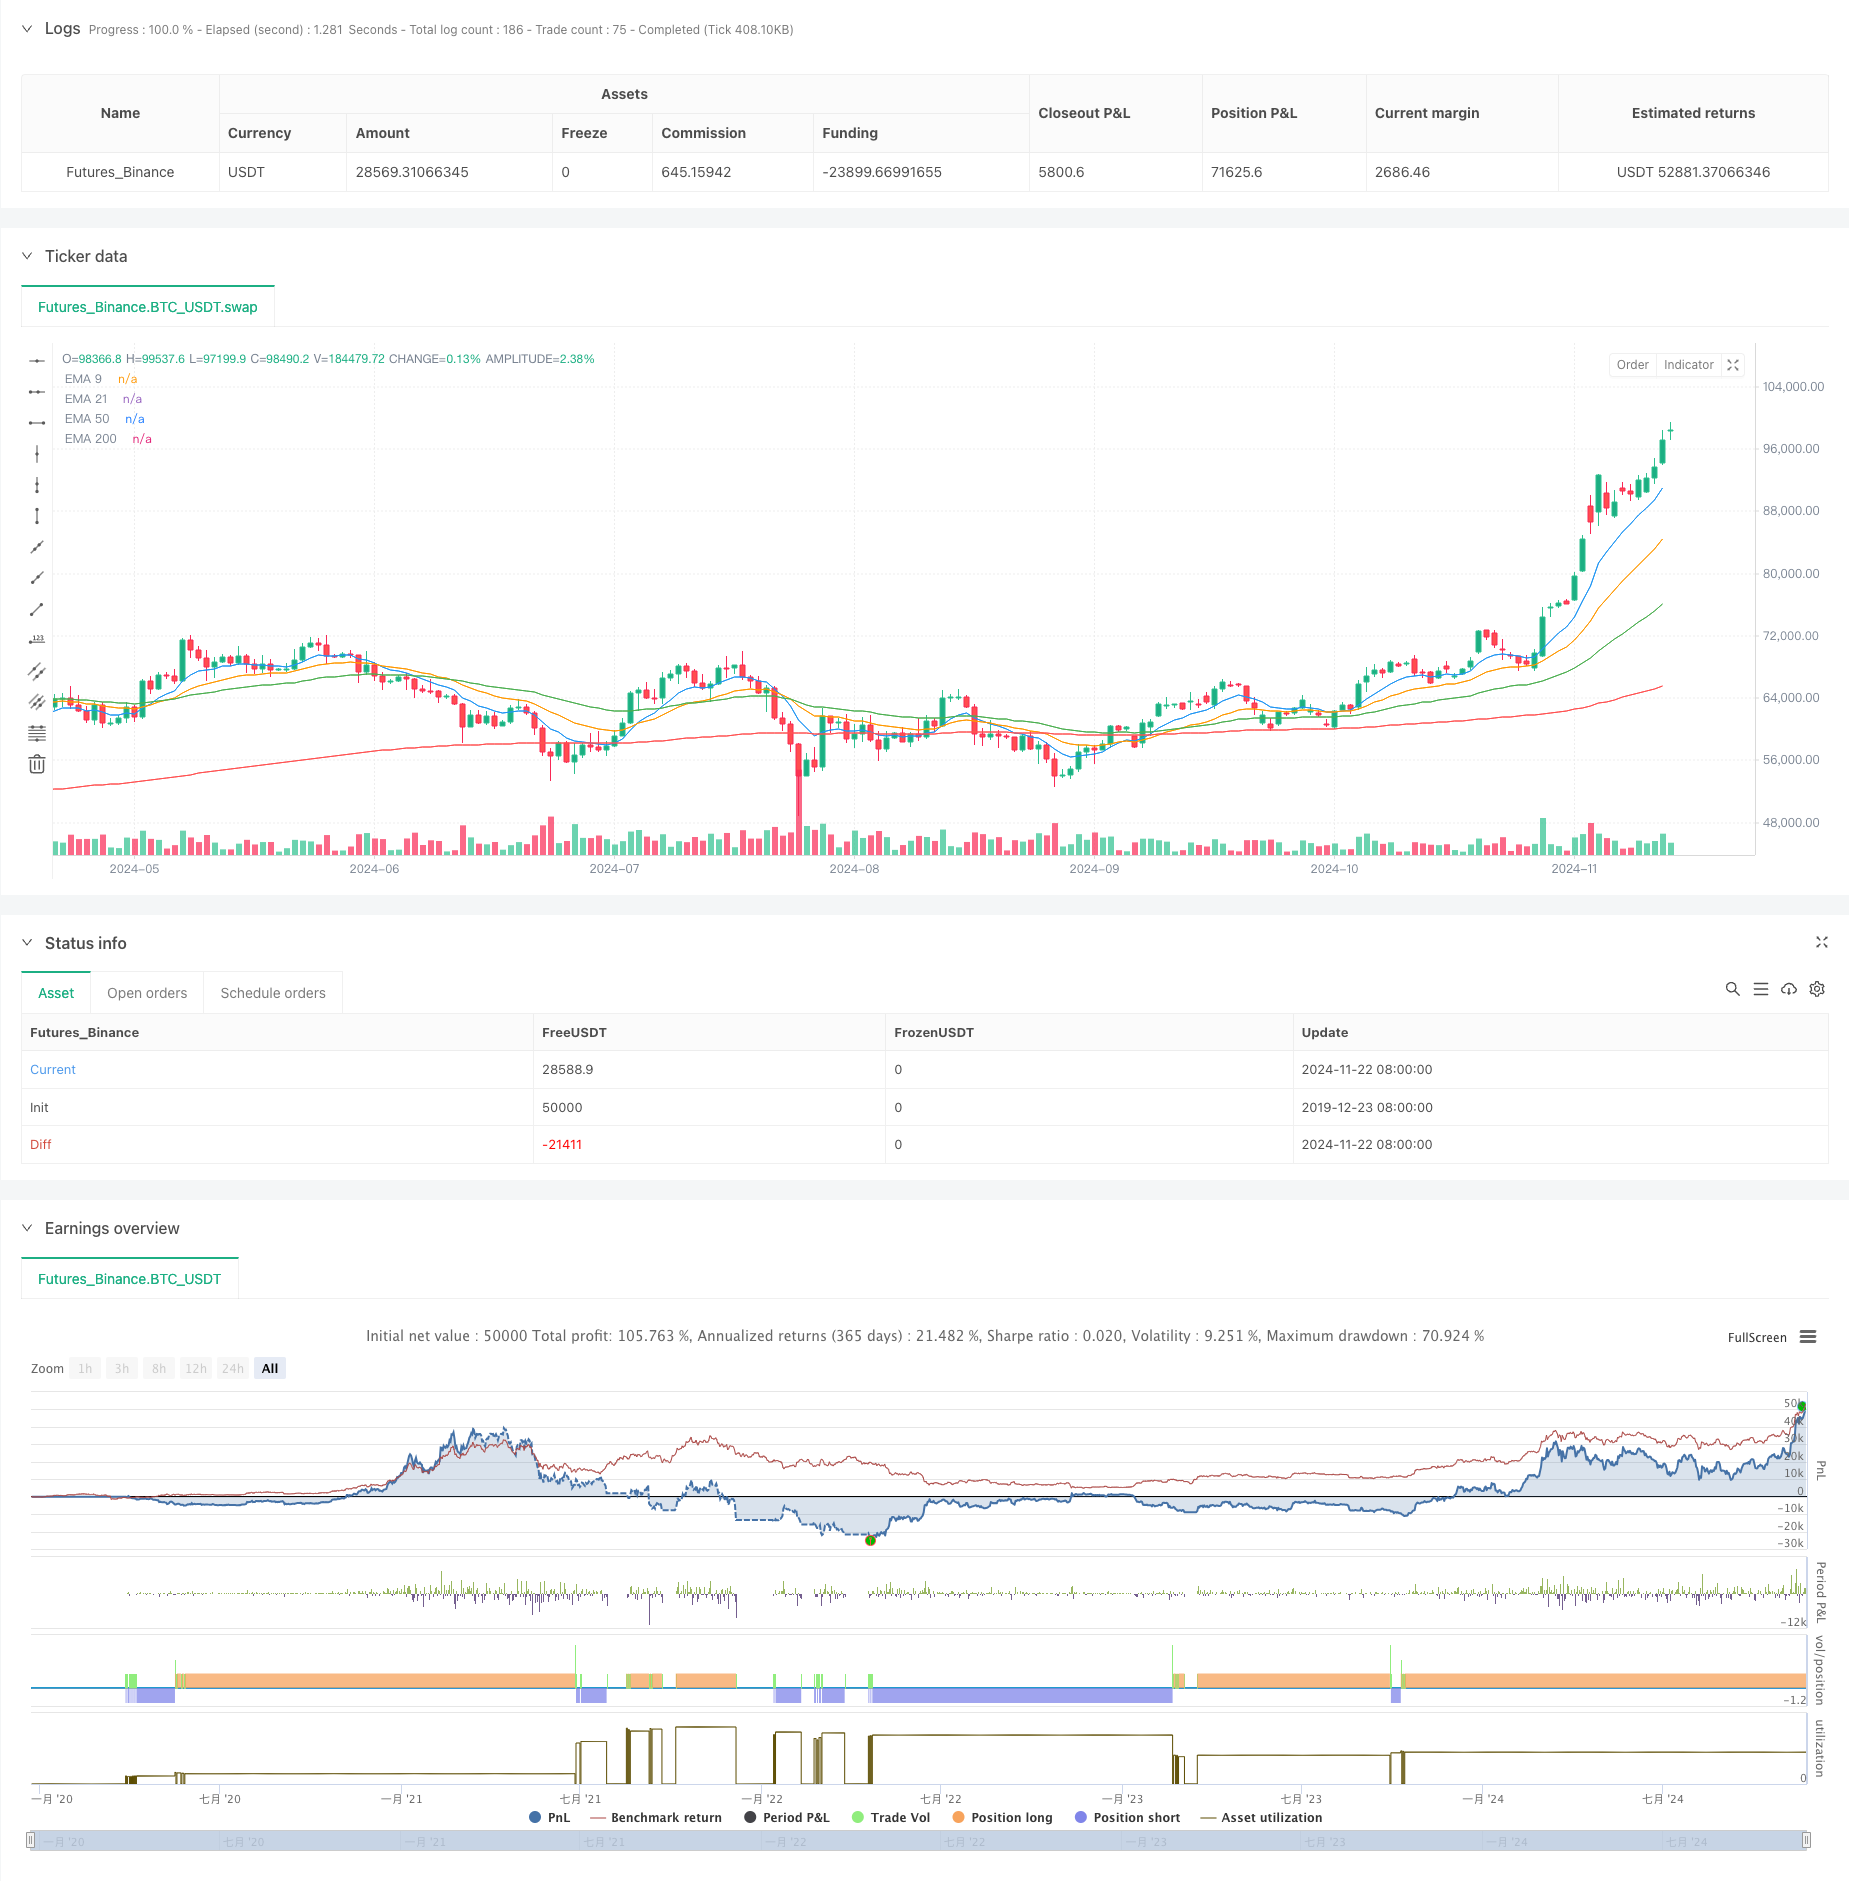
该策略是一个基于四重指数移动平均线(EMA)的趋势跟踪系统,通过9、21、50和200周期EMA的交叉和排列来识别市场趋势,并结合百分比止损进行风险控制。策略通过判断四条均线的排列顺序来确定市场趋势方向,当短期均线位于长期均线之上时入场做多,反之做空,同时设置固定百分比止损来控制风险。
策略原理
策略使用了四条不同周期的指数移动平均线(9、21、50、200),通过观察这些均线之间的关系来判断市场趋势。当9日EMA位于21日EMA之上,21日EMA位于50日EMA之上,50日EMA位于200日EMA之上时,系统认为市场处于强势上涨趋势,发出做多信号。相反,当均线呈现相反排列时,系统认为市场处于下跌趋势,发出做空信号。同时,策略引入了2%的止损设置,用于控制每笔交易的最大损失。
策略优势
- 多重均线交叉提供了更可靠的趋势确认信号,减少了假突破带来的风险
- 通过不同周期均线的排列来判断趋势强度,可以有效过滤掉市场噪音
- 固定百分比止损设置提供了明确的风险控制机制
- 策略逻辑简单清晰,易于理解和执行
- 适用于多个市场和时间周期,具有较强的普适性
策略风险
- 在震荡市场中可能产生频繁的假信号,导致连续止损
- 均线系统具有滞后性,可能错过趋势初期的重要价格变动
- 固定百分比止损可能不适合所有市场环境和波动率条件
- 没有考虑市场波动率变化对止损设置的影响
- 缺乏利润目标设置,可能导致盈利不能有效兑现
策略优化方向
- 引入ATR指标动态调整止损距离,使其更适应市场波动率变化
- 增加趋势强度过滤器,如ADX指标,以提高入场信号质量
- 添加移动止损机制,更好地保护已有盈利
- 引入成交量指标作为趋势确认的辅助指标
- 考虑添加利润目标或者移动止盈机制
- 优化均线周期参数,使其更适合特定市场特征
总结
这是一个结构完整的趋势跟踪交易系统,通过多重均线的配合使用提供了较为可靠的趋势识别机制,同时采用固定百分比止损来控制风险。虽然系统存在一定的滞后性,但通过合理的参数优化和额外指标的补充,可以进一步提升策略的稳定性和盈利能力。这个策略特别适合波动较大的市场,以及中长期的趋势跟踪交易。
策略源码
/*backtest
start: 2019-12-23 08:00:00
end: 2024-11-23 08:00:00
period: 1d
basePeriod: 1d
exchanges: [{"eid":"Futures_Binance","currency":"BTC_USDT"}]
*/

//@version=5
strategy("4 EMA Strategy with Stop Loss", overlay=true)

// Define the EMA lengths
ema1_length = input(9, title="EMA 1 Length")
ema2_length = input(21, title="EMA 2 Length")
ema3_length = input(50, title="EMA 3 Length")
ema4_length = input(200, title="EMA 4 Length")

// Calculate the EMAs
ema1 = ta.ema(close, ema1_length)
ema2 = ta.ema(close, ema2_length)
ema3 = ta.ema(close, ema3_length)
ema4 = ta.ema(close, ema4_length)

// Plot EMAs on the chart
plot(ema1, color=color.blue, title="EMA 9")
plot(ema2, color=color.orange, title="EMA 21")
plot(ema3, color=color.green, title="EMA 50")
plot(ema4, color=color.red, title="EMA 200")

// Define conditions for Buy and Sell signals
buy_condition = (ema1 > ema2 and ema2 > ema3 and ema3 > ema4)
sell_condition = (ema1 < ema2 and ema2 < ema3 and ema3 < ema4)

// Input stop loss percentage
stop_loss_perc = input(2.0, title="Stop Loss %")

// Execute buy signal
if (buy_condition)
    strategy.entry("Buy", strategy.long)

    // Set stop loss at a percentage below the entry price
    strategy.exit("Sell", "Buy", stop=strategy.position_avg_price * (1 - stop_loss_perc / 100))

// Execute sell signal
if (sell_condition)
    strategy.entry("Sell", strategy.short)

    // Set stop loss at a percentage above the entry price
    strategy.exit("Cover", "Sell", stop=strategy.position_avg_price * (1 + stop_loss_perc / 100))
相关推荐