概述
本策略名为”多周期均线交叉动量策略”。该策略基于多个时间周期的均线交叉信号,结合了指数移动平均线(EMA)和简单移动平均线(SMA)来识别潜在的买入和卖出机会。策略使用了9周期EMA、30周期SMA、50周期SMA、200周期SMA和325周期SMA,为交易者提供了从短期到长期的全面市场趋势视角。
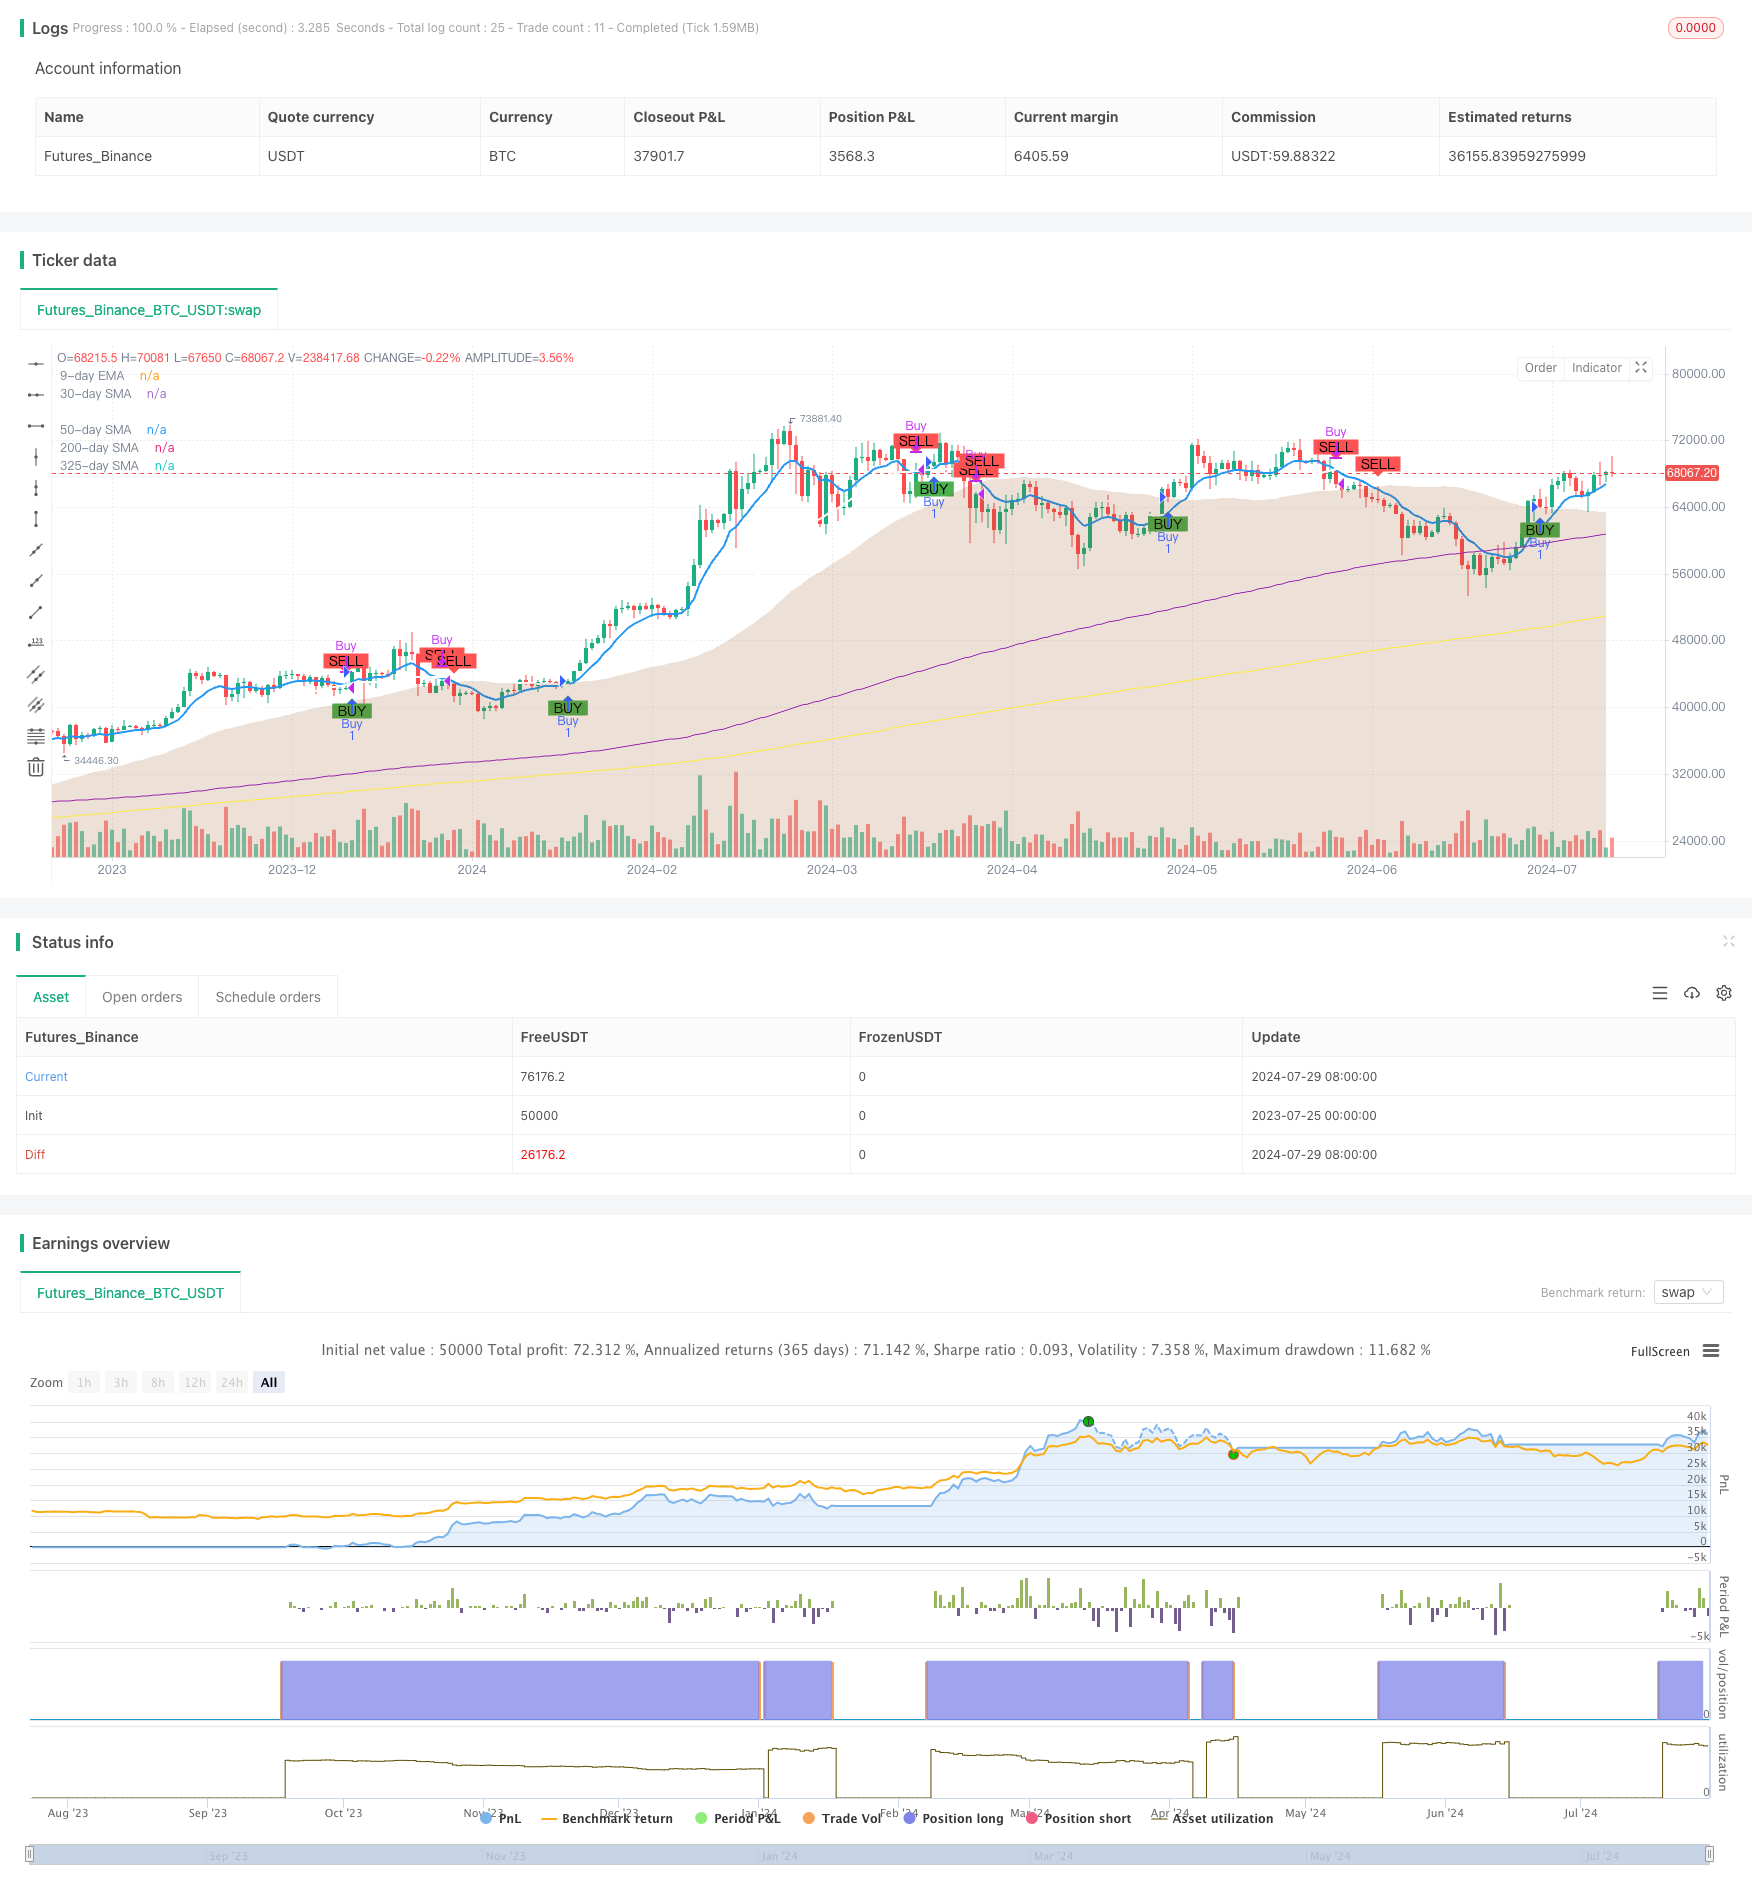
通过观察9周期EMA与30周期SMA的交叉情况,策略生成买入和卖出信号。当9周期EMA向上穿越30周期SMA时,触发买入信号;当9周期EMA向下穿越30周期SMA或50周期SMA时,触发卖出信号。这种方法旨在捕捉市场动量的变化,同时考虑不同时间框架的趋势支持。
策略原理
短期趋势指标:9周期EMA用于捕捉最近的价格变动,对市场的短期波动反应灵敏。
中期趋势指标:30周期SMA和50周期SMA用于识别中期趋势。50周期SMA以面积图的形式展示,为交易者提供了视觉上的支撑和阻力区域。
长期趋势指标:200周期SMA和325周期SMA用于确定主要的市场趋势,为交易决策提供更广阔的市场背景。
交叉信号:
- 买入信号:当9周期EMA上穿30周期SMA时触发。
- 卖出信号:当9周期EMA下穿30周期SMA或50周期SMA时触发。
可视化:策略在图表上标记了买入和卖出信号,使用绿色”BUY”标签表示买入点,红色”SELL”标签表示卖出点。
警报功能:策略还包含了基于买入和卖出信号的警报设置,方便交易者及时获取市场动向。
策略优势
多周期分析:通过结合多个时间周期的均线,策略能够全面把握市场趋势,从短期波动到长期趋势都有所考虑。
动量捕捉:使用EMA和SMA的交叉来捕捉市场动量的变化,有助于及时进入新兴趋势。
风险管理:通过观察多个均线的位置关系,交易者可以更好地评估当前市场风险水平。
视觉直观:策略在图表上清晰标记了买卖信号,并使用不同颜色和样式的均线,使得市场趋势一目了然。
灵活性:交易者可以根据自己的偏好调整各个均线的参数,以适应不同的交易风格和市场环境。
警报功能:内置的警报设置可以帮助交易者不错过重要的市场机会。
与其他指标兼容:策略可以与其他技术分析工具结合使用,如TKP T3 Trend With Psar Barcolor指标,进一步增强分析的准确性。
策略风险
滞后性:作为滞后指标,均线可能在剧烈波动的市场中产生滞后信号,导致入场或出场时机不佳。
假突破:在横盘整理阶段,均线交叉可能产生频繁的假突破信号,增加交易成本。
趋势依赖:在无趋势或趋势不明显的市场中,策略的效果可能不佳。
参数敏感性:不同的均线参数设置可能导致完全不同的交易结果,需要经过充分的回测和优化。
过度交易:频繁的均线交叉可能导致过度交易,增加交易成本并降低整体收益。
忽视基本面:纯粹依赖技术指标可能忽视重要的基本面因素,影响交易决策的全面性。
市场环境适应性:在不同的市场环境下(如高波动性或低波动性市场),策略的表现可能有显著差异。
策略优化方向
引入过滤器:可以添加额外的过滤条件,如成交量确认或其他动量指标,以减少假信号。
动态参数调整:考虑使用自适应均线或根据市场波动性动态调整均线参数,以适应不同的市场环境。
止损和止盈优化:加入智能止损和止盈机制,如跟踪止损或基于ATR的动态止损,以更好地管理风险和锁定利润。
时间框架分析:考虑在多个时间框架上应用策略,只有当不同时间框架的信号一致时才进行交易。
加入趋势强度过滤:使用ADX等趋势强度指标,只在明确的趋势中交易,避免在横盘市场频繁交易。
结合基本面分析:考虑将一些基本面因素纳入决策过程,如经济数据发布或重要新闻事件。
机器学习优化:利用机器学习算法优化均线参数和交易规则,以适应不断变化的市场条件。
回测和前向测试:进行严格的历史回测和前向测试,以确保策略在不同市场环境下的稳健性。
总结
“多周期均线交叉动量策略”是一个基于技术分析的量化交易策略,通过多个时间周期的均线交叉来捕捉市场动量变化和潜在的交易机会。策略结合了短期、中期和长期的市场趋势分析,为交易者提供了全面的市场视角。
该策略的主要优势在于其多维度的市场分析和清晰的视觉呈现,使得交易者能够更好地理解和把握市场动向。然而,像所有基于技术指标的策略一样,它也面临着信号滞后和假突破等风险。
为了优化策略性能,交易者可以考虑引入额外的过滤器、动态参数调整、优化风险管理措施,以及结合其他分析方法。重要的是要通过充分的回测和实盘验证来确保策略在各种市场条件下的可靠性。
总的来说,这个策略为交易者提供了一个solid的框架,可以根据个人交易风格和市场认知进行进一步定制和优化。在实际应用中,建议将其与其他分析工具和方法结合使用,以做出更全面、更准确的交易决策。
/*backtest
start: 2023-07-25 00:00:00
end: 2024-07-30 00:00:00
period: 1d
basePeriod: 1h
exchanges: [{"eid":"Futures_Binance","currency":"BTC_USDT"}]
*/

// This Pine Script™ code is subject to the terms of the Mozilla Public License 2.0 at https://mozilla.org/MPL/2.0/
// © Target2026

//@version=5
strategy("EMA/SMA Crossover Strategy with Additional MAs", overlay=true)

// Define input parameters for the EMA and SMAs
emaLength = input.int(9, title="EMA Length")
sma30Length = input.int(30, title="30 SMA Length")
sma50Length = input.int(50, title="50 SMA Length")
sma200Length = input.int(200, title="200 SMA Length")
sma325Length = input.int(325, title="325 SMA Length")

// Calculate the EMA and SMAs
emaValue = ta.ema(close, emaLength)
sma30Value = ta.sma(close, sma30Length)
sma50Value = ta.sma(close, sma50Length)
sma200Value = ta.sma(close, sma200Length)
sma325Value = ta.sma(close, sma325Length)

// Plot the EMA and SMAs on the chart
plot(emaValue, title="9-day EMA", color=color.blue, linewidth=2)
plot(sma30Value, title="30-day SMA", color=color.white, linewidth=2)
plot(sma200Value, title="200-day SMA", color=color.purple)
plot(sma325Value, title="325-day SMA", color=color.yellow)

// Plot the 50 SMA as an area chart with brown color and 21% opacity
plot(sma50Value, title="50-day SMA", color=color.new(#8B4513, 79), style=plot.style_area)

// Define the crossover conditions
buySignal = ta.crossover(emaValue, sma30Value)
sellSignal = ta.crossunder(emaValue, sma30Value) or ta.crossunder(emaValue, sma50Value)

// Plot buy and sell signals on the chart
plotshape(series=buySignal, location=location.belowbar, color=color.green, style=shape.labelup, text="BUY")
plotshape(series=sellSignal, location=location.abovebar, color=color.red, style=shape.labeldown, text="SELL")

// Implement the strategy
if (buySignal)
    strategy.entry("Buy", strategy.long)
if (sellSignal)
    strategy.close("Buy")

// Optional: Add alert conditions
alertcondition(buySignal, title="Buy Alert", message="Buy signal: EMA crossed above 30 SMA")
alertcondition(sellSignal, title="Sell Alert", message="Sell signal: EMA crossed below 30 SMA or 50 SMA")