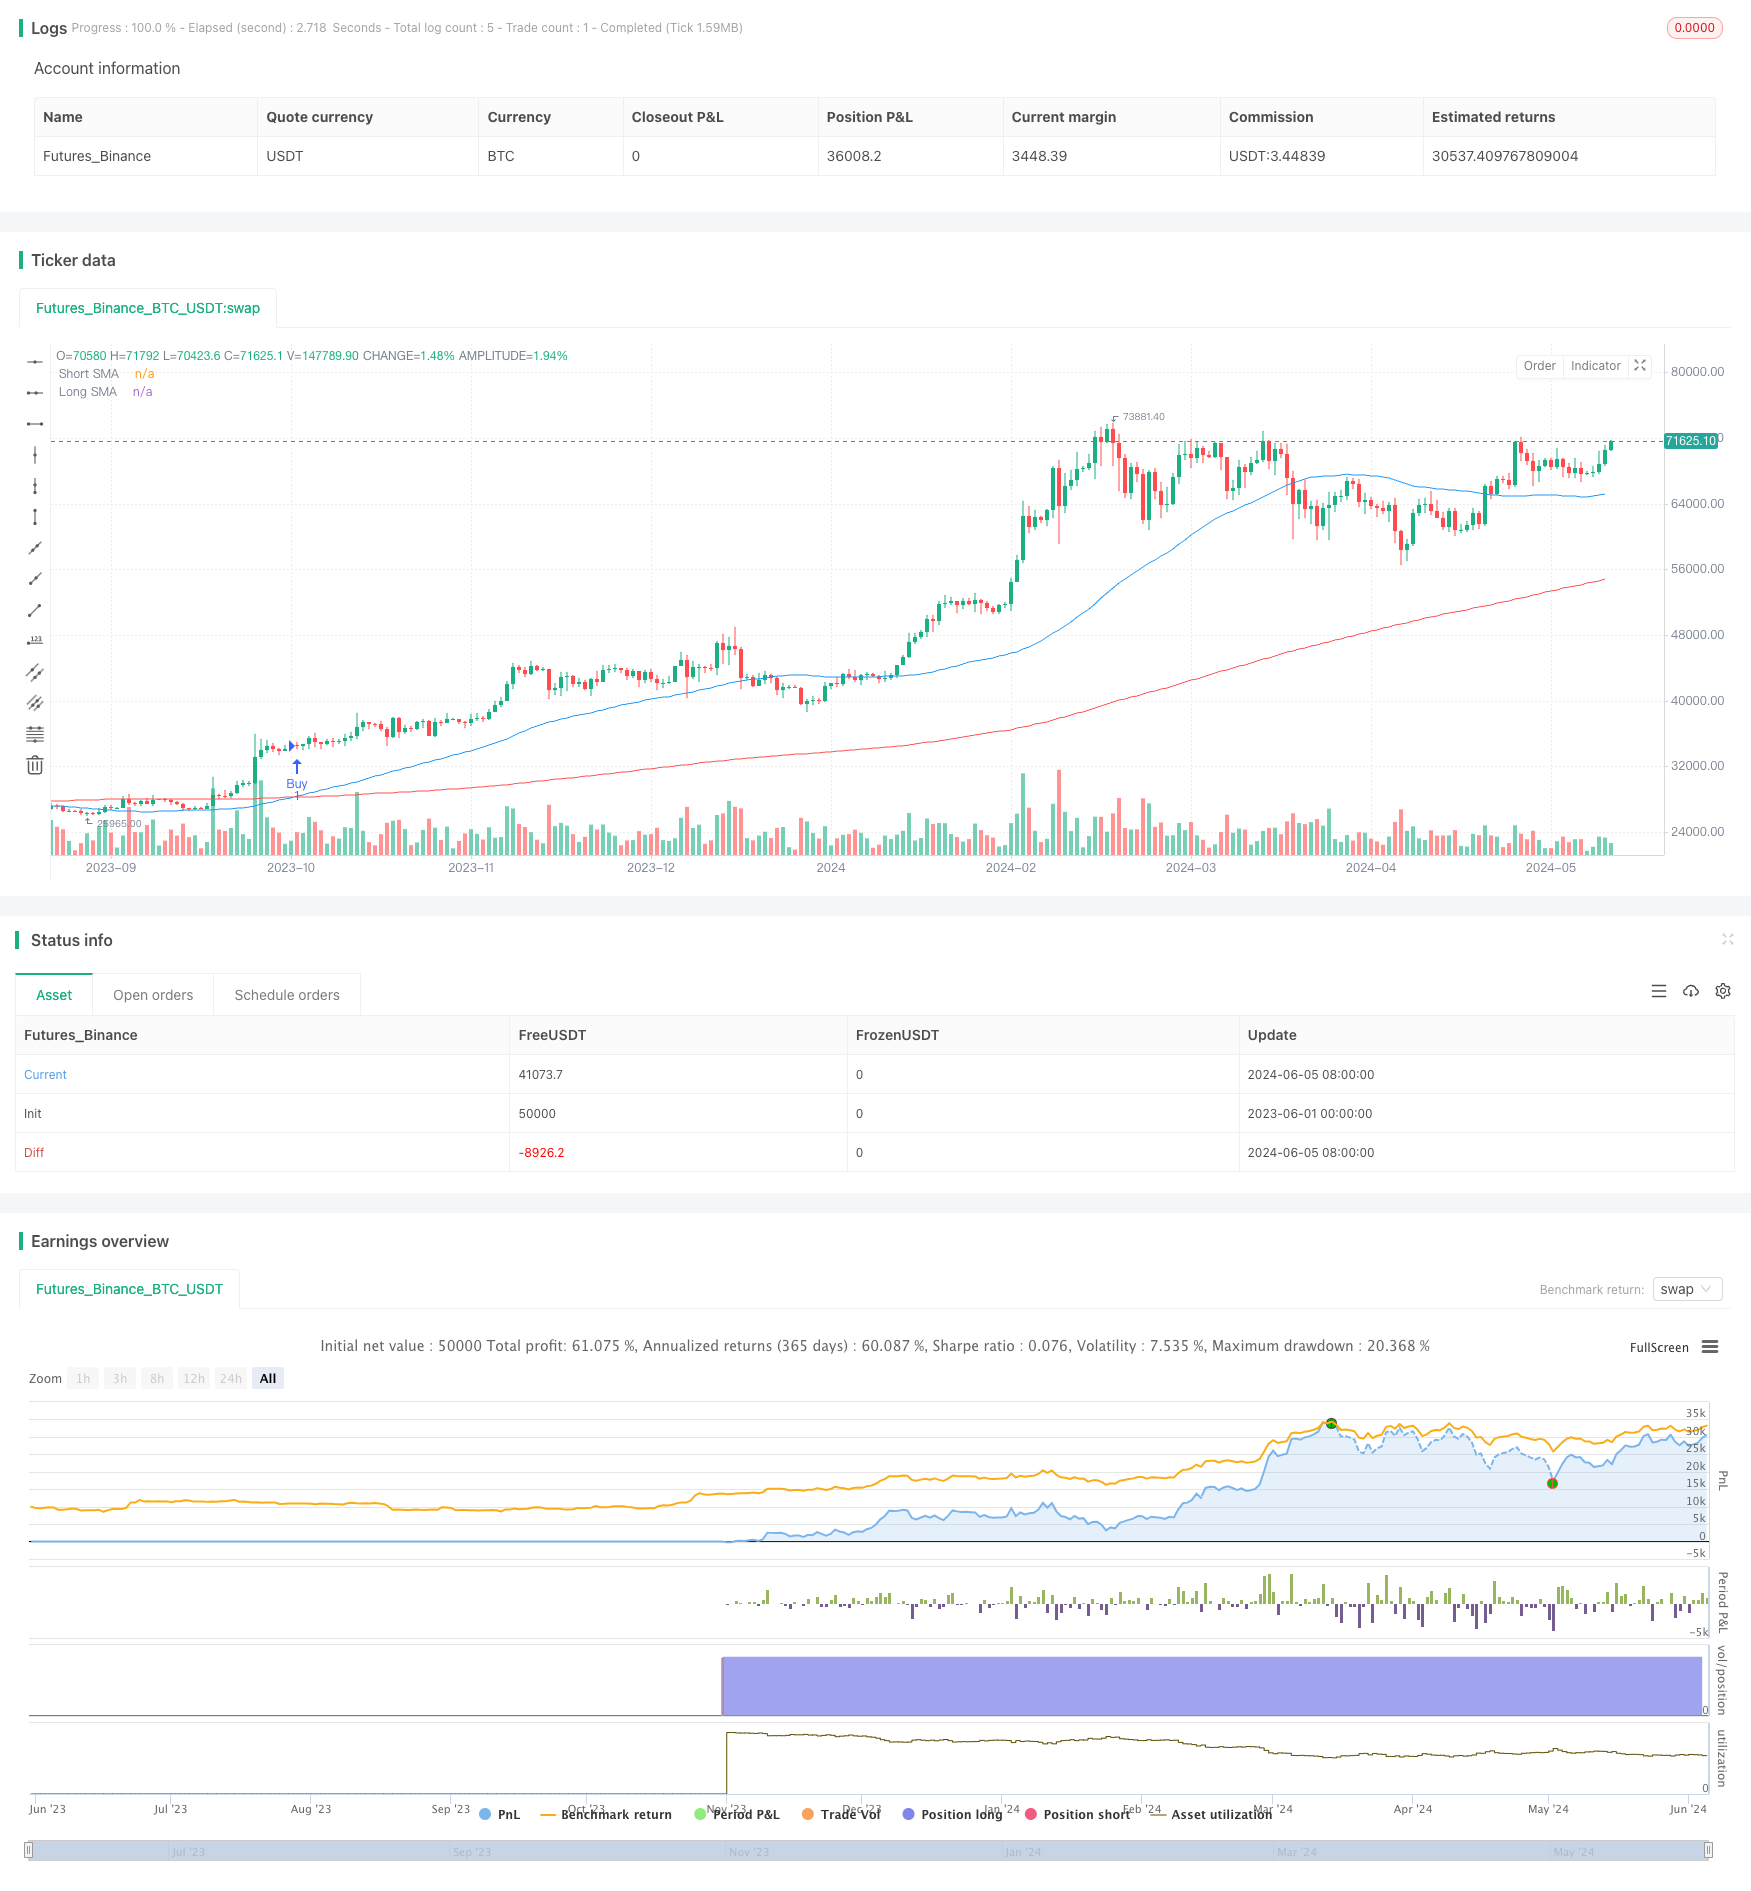
SMA双均线交叉策略
Author: ChaoZhang, Date: 2024-06-07 14:49:52Tags: SMAEMA

概述
该策略是一种基于双均线交叉原理的量化交易策略。策略通过计算两条不同周期的简单移动平均线(SMA),当短期SMA上穿长期SMA时产生买入信号,当短期SMA下穿长期SMA时产生卖出信号。该策略代码还引入了日期范围和时间框架的设置,可以灵活地对策略进行回测和优化。
策略原理
该策略的核心原理是利用不同周期的移动平均线之间的交叉关系来捕捉价格趋势的变化。移动平均线是一种常用的技术指标,通过对过去一段时间内的价格进行平均,可以滤除短期波动,反映价格的整体趋势。当短期移动平均线上穿长期移动平均线时,表明价格可能开始出现上升趋势,此时产生买入信号;反之,当短期移动平均线下穿长期移动平均线时,表明价格可能开始出现下降趋势,此时产生卖出信号。
策略优势
- 简单易懂:该策略基于移动平均线的交叉原理,逻辑清晰,易于理解和实现。
- 适应性强:通过调整短期和长期移动平均线的周期参数,可以适应不同的市场和交易品种。
- 趋势跟踪:移动平均线能够有效地捕捉价格的整体趋势,有助于在趋势形成的早期阶段进行交易。
- 可自定义:该策略代码提供了日期范围和时间框架的设置,可以灵活地对策略进行回测和优化。
策略风险
- 参数敏感:策略的表现可能对移动平均线的周期参数较为敏感,不同的参数设置可能导致不同的结果。
- 频繁交易:当市场波动较大或者处于震荡区间时,该策略可能会产生较多的交易信号,导致频繁交易和高额手续费。
- 滞后效应:移动平均线存在一定的滞后性,可能在趋势已经形成后才产生交易信号,错过最佳入场时机。
- 突发事件:该策略主要依赖历史价格数据,对于突发的重大事件可能反应不足。
策略优化方向
- 引入其他技术指标:可以考虑将其他技术指标如RSI、MACD等与移动平均线结合,提高交易信号的可靠性。
- 优化参数选择:对短期和长期移动平均线的周期参数进行优化,找到适合特定市场和交易品种的最佳参数组合。
- 增加过滤条件:引入交易量、波动率等额外的过滤条件,过滤掉一些可能的假信号。
- 动态调整参数:根据市场状态的变化,动态调整移动平均线的周期参数,以适应不同的市场环境。
- 加入风险管理:设置合理的止损和止盈规则,控制单笔交易的风险敞口,提高策略的风险调整后收益。
总结
该SMA双均线交叉策略是一种简单易懂、适应性强的量化交易策略。通过利用不同周期移动平均线的交叉关系,策略能够有效地捕捉价格趋势的变化,为交易者提供买入和卖出信号。但是,策略的表现可能对参数选择较为敏感,并且在市场波动较大时可能产生频繁交易和滞后效应。为了进一步优化策略,可以考虑引入其他技术指标、优化参数选择、增加过滤条件、动态调整参数和加入风险管理等措施。总的来说,该策略可以作为量化交易的基础策略之一,但在实际应用中还需要根据具体情况进行适当的优化和改进。
/*backtest
start: 2023-06-01 00:00:00
end: 2024-06-06 00:00:00
period: 1d
basePeriod: 1h
exchanges: [{"eid":"Futures_Binance","currency":"BTC_USDT"}]
*/

//@version=5
strategy("SMA Crossover Strategy with Date Range and Timeframe", overlay=true, default_qty_type=strategy.fixed, default_qty_value=1, initial_capital=1000, currency=currency.USD, pyramiding=0, commission_type=strategy.commission.percent, commission_value=0)

// Define the lengths for the short and long SMAs
shortSMA_length = input.int(50, title="Short SMA Length", minval=1)
longSMA_length = input.int(200, title="Long SMA Length", minval=1)

// Define the start and end dates for the backtest
startDate = input(timestamp("2024-06-01 00:00"), title="Start Date")
endDate = input(timestamp("2024-06-05 00:00"), title="End Date")

// Define the timeframe for the SMAs
smaTimeframe = input.timeframe("D", title="SMA Timeframe")

// Request the short and long SMAs from the selected timeframe
dailyShortSMA = request.security(syminfo.tickerid, smaTimeframe, ta.sma(close, shortSMA_length))
dailyLongSMA = request.security(syminfo.tickerid, smaTimeframe, ta.sma(close, longSMA_length))

// Plot the SMAs on the chart
plot(dailyShortSMA, color=color.blue, title="Short SMA")
plot(dailyLongSMA, color=color.red, title="Long SMA")

// Define the crossover conditions based on the selected timeframe SMAs
buyCondition = ta.crossover(dailyShortSMA, dailyLongSMA)
sellCondition = ta.crossunder(dailyShortSMA, dailyLongSMA)

// Generate buy and sell signals only if the current time is within the date range

if (buyCondition)
    strategy.entry("Buy", strategy.long)
if (sellCondition)
    strategy.close("Buy")

// Optional: Add visual buy/sell markers on the chart
plotshape(series=buyCondition and (time >= startDate and time <= endDate), title="Buy Signal", location=location.belowbar, color=color.green, style=shape.labelup, text="BUY")
plotshape(series=sellCondition and (time >= startDate and time <= endDate), title="Sell Signal", location=location.abovebar, color=color.red, style=shape.labeldown, text="SELL")
相关内容
- 多重波浪趋势交叉风险管理量化策略
- 多重指数移动平均线交叉动量策略
- EMA, SMA, 均线交叉, 动量指标
- 多重均线趋势动量识别与止损交易系统
- EMA交叉动量短线交易策略
- Trading ABC
- 双均线成交量趋势确认量化交易策略
- EMA5与EMA13交叉策略
- 高级量化趋势追踪与云图反转复合交易策略
- 超级均线与Upperband交叉策略
更多内容
- Supertrend和EMA组合策略
- TGT基于价格下跌买入策略
- EMA交叉与RSI过滤的双重趋势策略
- EMA均线与抛物线SAR组合策略
- MACD与RSI相结合的多重过滤日内交易策略
- 基于两个市场价格关系的套利交易策略
- RSI基于百分比止盈止损的交易策略
- MACD与马丁策略结合的多头优化交易策略
- Elliott 波动随机EMA策略
- 布林带交叉移动平均策略
- 10SMA与MACD双重趋势跟踪交易策略
- MACD和RSI结合的自然交易策略
- 动态时间框架高低点突破策略
- 动态趋势跟踪策略
- 趋势过滤与异常退出的平滑移动平均止损止盈策略
- MACD与R:R比率日内限制收敛策略
- 星光移动平均交叉策略
- 百分比阈值量化交易策略
- 基于双均线交叉的移动平均线策略
- MACD与Supertrend组合策略