Trend Following Maximized Moving Average Crossover Strategy
Author: ChaoZhang, Date: 2023-10-17 13:05:29Tags:

Overview
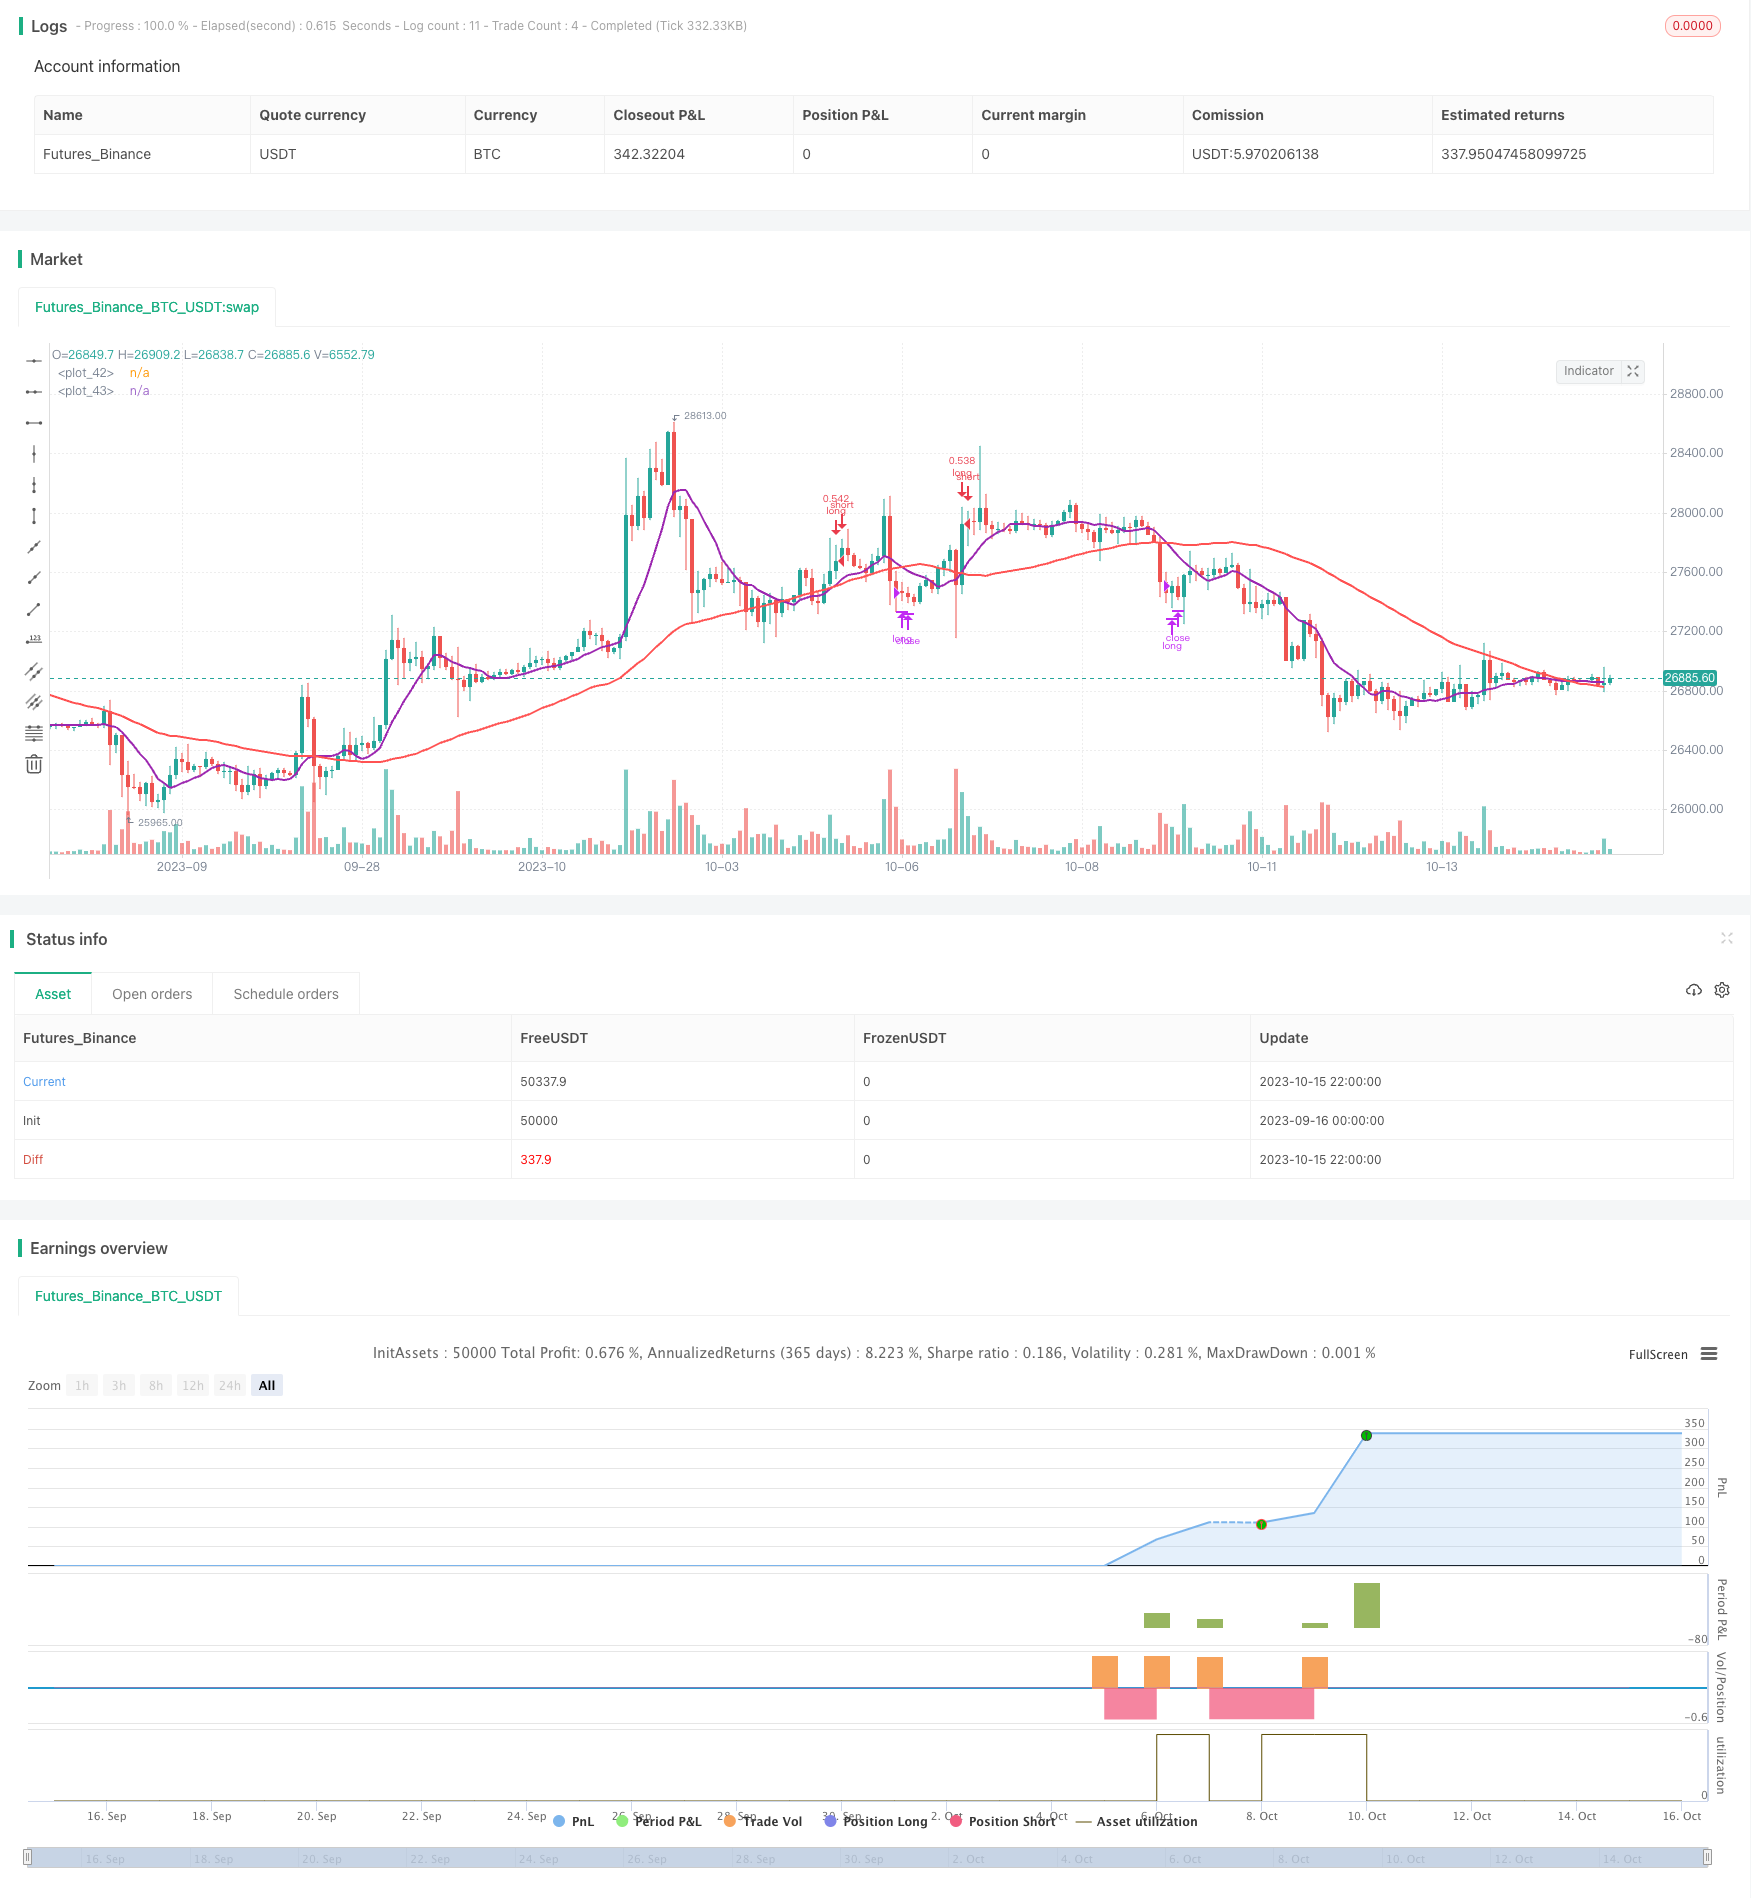
This strategy uses the crossover of two moving averages with different periods to generate trading signals. It belongs to trend following strategies. The strategy captures trending opportunities by using signals when a shorter period MA crosses a longer period MA.
Strategy Logic
The strategy uses a 9-period short term MA (SMA) and a 50-period long term MA (LMA). When the SMA crosses above the LMA, a buy signal is generated. When the SMA crosses below the LMA, a sell signal is generated.
The strategy also incorporates the RSI indicator to gauge the strength of the trend. Trading signals are only generated when RSI is above a threshold (default 55). This avoids incorrect signals when RSI is in overbought zones.
The strategy trades 30% of total capital each time, with only one position open at a time. 0.1% commission is accounted for.
Advantage Analysis
- Captures trending opportunities effectively using MA crossover trend signals.
- Incorporating RSI avoids incorrect signals when trend stalls.
- Default parameters are optimized and produce steady returns across various markets.
- Reasonable capital management avoids oversized position sizing.
Risk Analysis
- Prone to whipsaws and incorrect signals during range-bound markets without a trend.
- No profits without a significant trend as a trend following strategy.
- Excessive trading and commissions if parameters not tuned properly.
- Lack of stop loss exposes strategy to events risk.
Risks can be reduced via parameter optimization, using other indicators, strict capital management, and stop loss.
Enhancement Opportunities
- Test different MA combinations to find optimal parameters.
- Incorporate other indicators like MACD to confirm trend.
- Implement dynamic stop loss to control loss per trade.
- Adjust position sizing based on different markets.
- Use volume indicators to gauge trend strength.
Conclusion
The strategy captures trending opportunities using simple MA crossover system. Default parameters are optimized with steady returns, suitable for algorithmic trading. Further improvements can be made by adding other indicators, optimizing parameters, and implementing stop loss. Overall, it is an effective trend following strategy for trending markets using crossover signals.
/*backtest
start: 2023-09-16 00:00:00
end: 2023-10-16 00:00:00
period: 2h
basePeriod: 15m
exchanges: [{"eid":"Futures_Binance","currency":"BTC_USDT"}]
*/

// This source code is subject to the terms of the Mozilla Public License 2.0 at https://mozilla.org/MPL/2.0/
// © relevantLeader16058

//@version=4
strategy(shorttitle='Maximized Moving Average Crossing ',title='Maximized Moving Average Crossing (by Coinrule)', overlay=true, initial_capital=1000,  default_qty_type = strategy.percent_of_equity, default_qty_value = 30, commission_type=strategy.commission.percent, commission_value=0.1)

//Backtest dates
fromMonth = input(defval = 1,    title = "From Month",      type = input.integer, minval = 1, maxval = 12)
fromDay   = input(defval = 1,    title = "From Day",        type = input.integer, minval = 1, maxval = 31)
fromYear  = input(defval = 2020, title = "From Year",       type = input.integer, minval = 1970)
thruMonth = input(defval = 1,    title = "Thru Month",      type = input.integer, minval = 1, maxval = 12)
thruDay   = input(defval = 1,    title = "Thru Day",        type = input.integer, minval = 1, maxval = 31)
thruYear  = input(defval = 2112, title = "Thru Year",       type = input.integer, minval = 1970)

showDate  = input(defval = true, title = "Show Date Range", type = input.bool)

start     = timestamp(fromYear, fromMonth, fromDay, 00, 00)        // backtest start window
finish    = timestamp(thruYear, thruMonth, thruDay, 23, 59)        // backtest finish window
window()  => time >= start and time <= finish ? true : false       // create function "within window of time"

//MA inputs and calculations
inlong=input(50, title='MA long period')
inshort=input(9, title='MA short period')

MAlong = sma(close, inlong)
MAshort= sma(close, inshort)

// RSI inputs and calculations
lengthRSI = (14)

RSI = rsi(close, lengthRSI)
RSI_Signal = input(55, title = 'RSI Trigger', minval=1)

//Entry and Exit
bullish = crossover(MAshort, MAlong)
bearish = crossunder(MAshort, MAlong)

strategy.entry(id="long", long = true, when = bullish and RSI > RSI_Signal and window())
strategy.close(id="long", when = bearish and window())


plot(MAshort, color=color.purple, linewidth=2)
plot(MAlong, color=color.red, linewidth=2)
- STC MA ATR Integrated Trend Trading Strategy
- Bull Trend Riding Strategy Based on Stochastic RSI with Special Rules for Heavy Bullish Bias
- Short-Mid Term Trend Following Strategy Based on SMA Indicators
- Gold/Silver 30m Trend Following Breakout Strategy
- Adaptive Trend Tracking Stop Loss Strategy
- Short-term Bearish Strategy Based on EMA Crossover and Bear Power Indicators
- Dual EMA Crossover Trading Strategy
- Dual Moving Average Crossover Strategy
- Williams 9 Days Breakout Strategy
- Multi Moving Average Rating Trend Strategy
- Trend Following Buy and Sell Strategy
- He is also a member of the board of directors of the National Association for the Advancement of Science.
- RSI and Moving Average Crossover Multi Timeframe Trading Strategy
- Combo Strategy of 123 Reversal and Smoothed RSI
- Dual EMA Crossover Trading Strategy
- Dynamic ATR Stop Loss Center Line Strategy
- Dual EMA Crossover Strategy
- Ichimoku Cloud Day Trading Strategy
- Dynamic Risk-Adjusted Leverage Trading System
- MACD Momentum Strategy