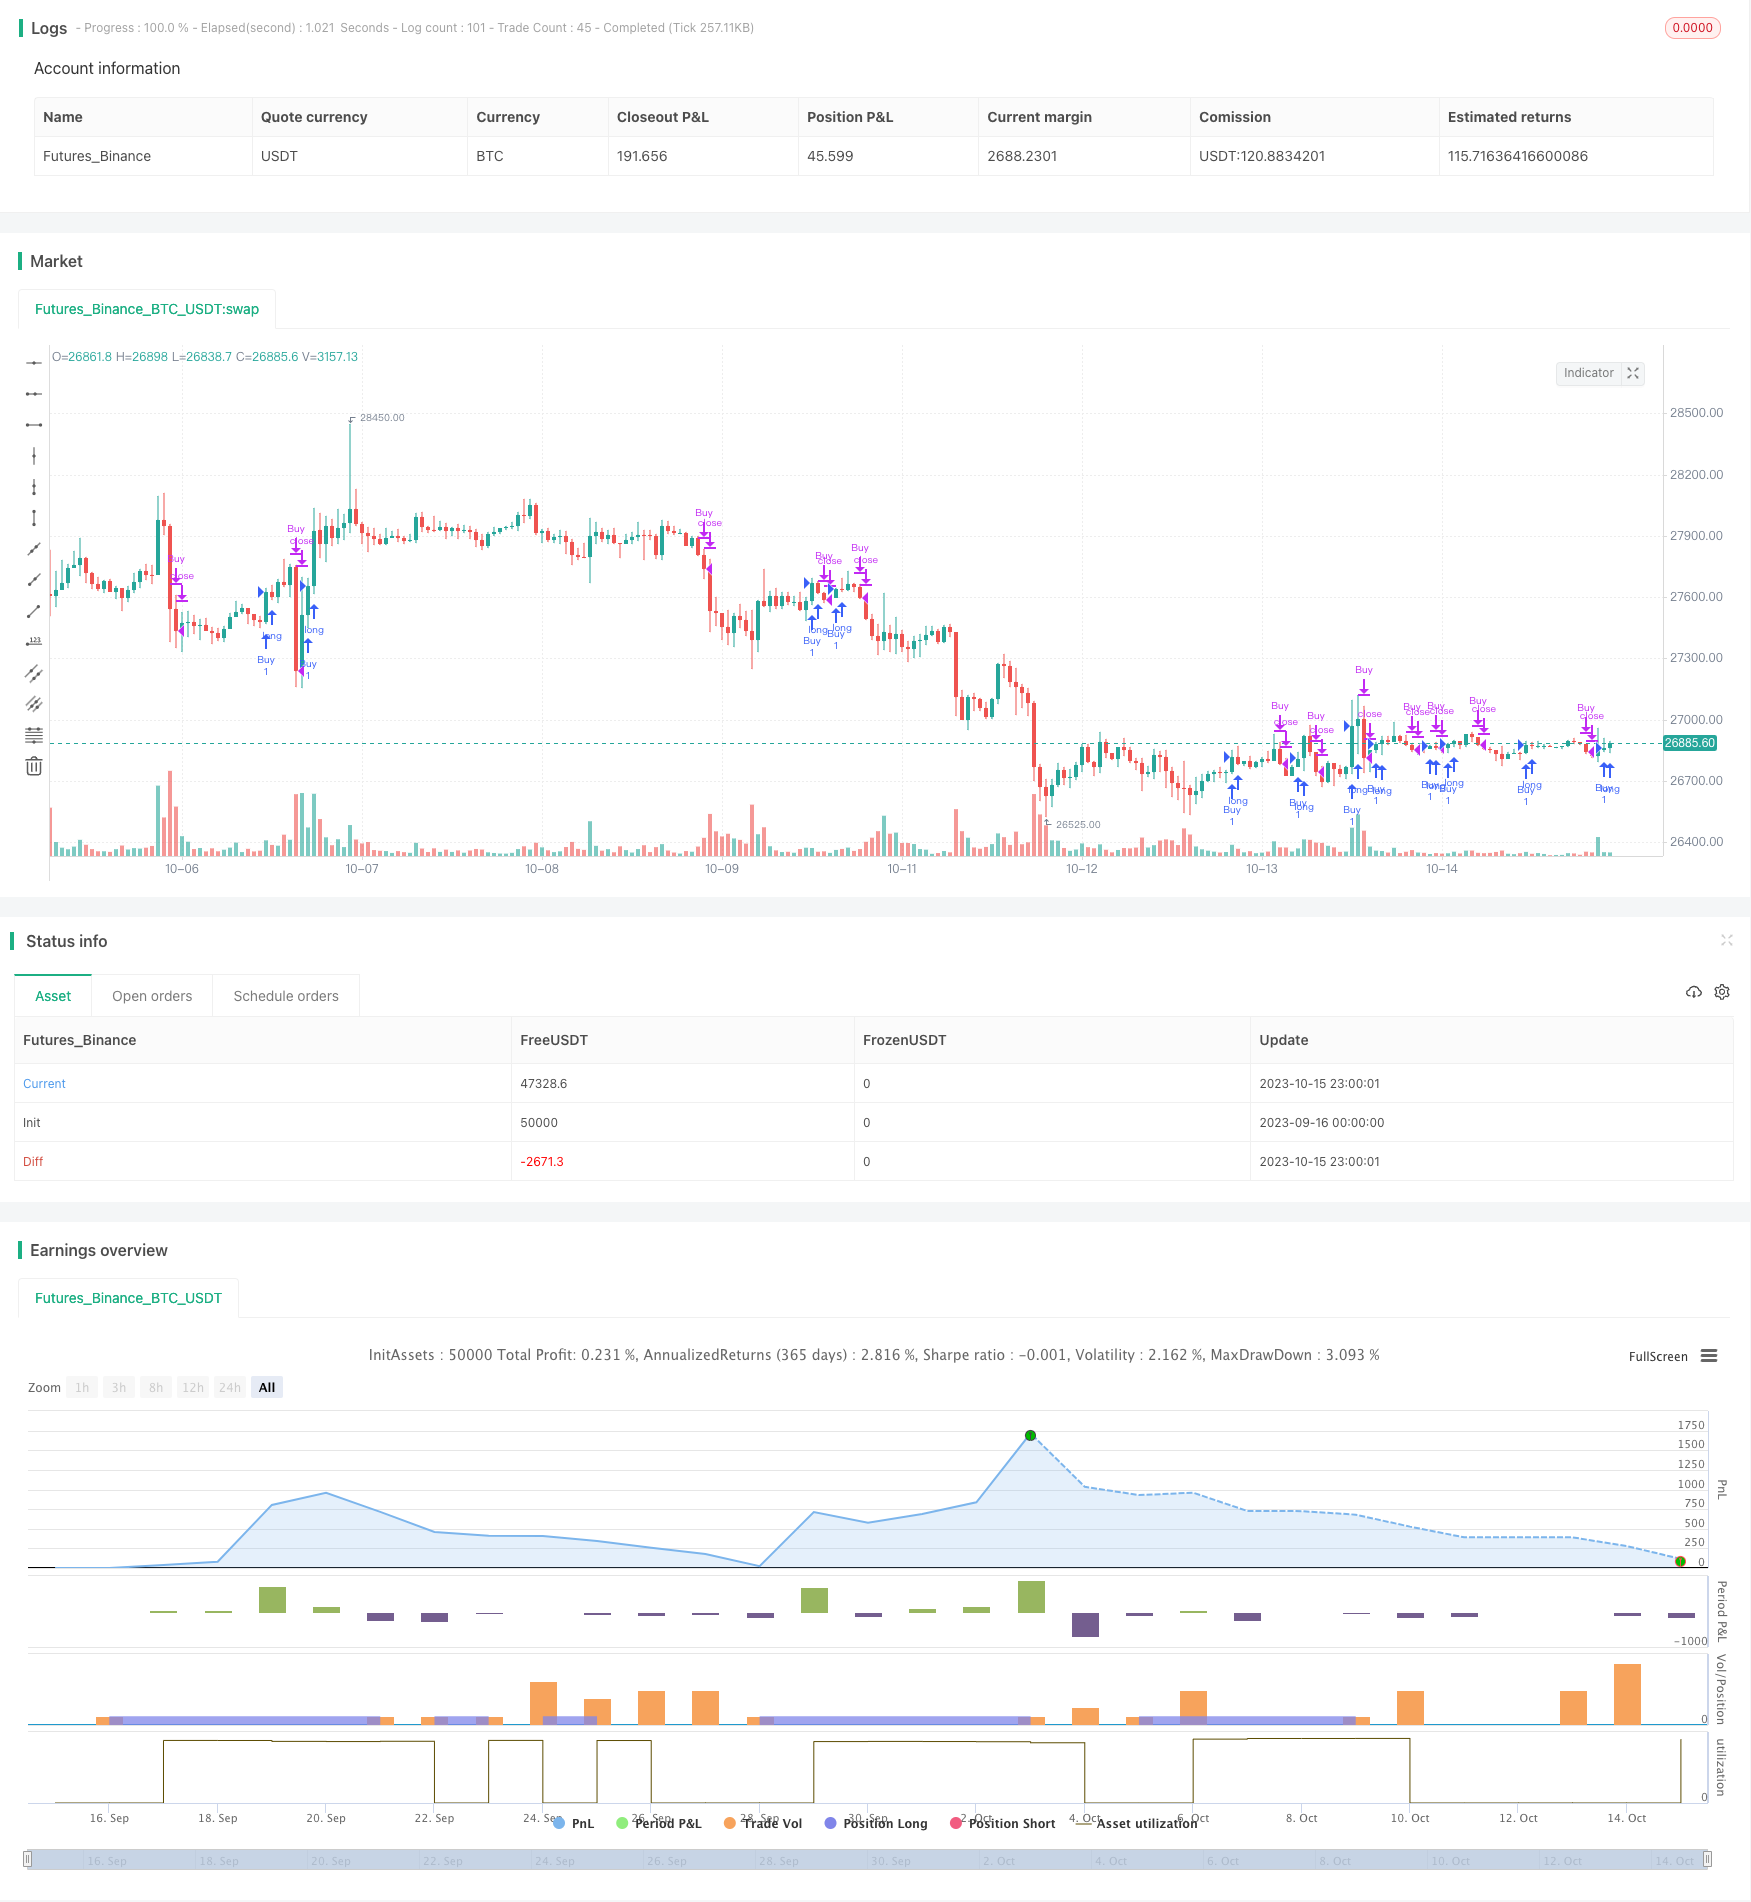
TAM Intraday RSI Trading Strategy
Author: ChaoZhang, Date: 2023-10-17 16:58:46Tags:

Overview
The TAM intraday RSI trading strategy utilizes the crossover of RSI indicators across different periods to generate intraday entry and exit signals. The strategy performs well in both bull and bear environments by effectively capitalizing on overbought and oversold conditions revealed by the RSI indicator and making counter trend trades when the market shows signs of reversal.
Strategy Logic
The strategy employs two RSI indicators to generate buy and sell signals. The buy signal uses a short period 2-day RSI and a medium period 14-day RSI, triggering a buy when either the short or medium RSI crosses above 50. The sell signal uses a short period 7-day RSI and a medium period 50-day RSI, triggering a sell when either the short or medium RSI crosses below 50.
The strategy also requires the RSI to actually move past the 50 threshold, not just cross it, which helps filter out many false signals. Specifically, a buy requires meeting the following conditions:
- 2-day RSI crosses above 50
- 2-day RSI is greater than 50
- 14-day RSI crosses above 50
- 14-day RSI is greater than 50
The sell conditions are similar:
- 7-day RSI crosses below 50
- 7-day RSI is less than 50
- 50-day RSI crosses below 50
- 50-day RSI is less than 50
Such multi-layer filtering ensures signals are only triggered when RSI shows clear overbought/oversold indications, and will not be misled by minor oscillations.
Advantage Analysis
The TAM intraday RSI strategy has the following advantages:
-
Utilizing dual RSI provides multi timeframe analysis, filtering market noise effectively and only entering at significant trend reversal points.
-
Requiring actual RSI value to breach key threshold avoids false breakout signals.
-
Adopting RSI of differing parameters for entry and exit can pinpoint reversal timing more precisely.
-
RSI exhibits relatively stable performance within intraday trading windows, suitable for intraday strategies.
-
Customizable parameters allow adjusting RSI inputs for different markets and better results.
-
Simple and clear logic makes it easy to understand and implement for algo trading.
Risk Analysis
Some risks also exist with the strategy:
-
Intraday trading has overnight gap risk that can skip stop loss settings.
-
RSI divergence occurs frequently and must be validated with other indicators.
-
High volatility in intraday periods means stop loss must be wide yet not too wide.
-
Parameter optimization risks overfitting, requiring testing across varying markets.
-
Backtesting limitations cannot fully reflect real trading, requiring tuning for live performance.
Optimization Directions
The strategy can be improved in the following aspects:
-
Add confirmation with other indicators like KDJ, MACD etc.
-
Implement volume filter to only consider signals on increasing volume.
-
Optimize parameters for even shorter intraday cycles.
-
Assist decision with machine learning models to find optimal parameters algorithmically.
-
Artistic touch combining key S/R levels, chart patterns from technical analysis.
-
Improve stop loss with dynamic ATR, volatility based methods.
Conclusion
Overall the TAM intraday RSI strategy is a very practical quant strategy. It effectively assesses overbought and oversold conditions using the multi timeframe RSI evaluation and generates solid signals when combined with strict entry/exit rules to filter out false signals. With proper optimization and risk management, the strategy can produce stable trade signals and achieve good results. Its clear and straightforward logic makes it easy to implement and test for algo traders.
/*backtest
start: 2023-09-16 00:00:00
end: 2023-10-16 00:00:00
period: 1h
basePeriod: 15m
exchanges: [{"eid":"Futures_Binance","currency":"BTC_USDT"}]
*/

// This source code is subject to the terms of the Mozilla Public License 2.0 at https://mozilla.org/MPL/2.0/
// © DvKel

//@version=5
strategy("TAM - RSI Strategy", overlay = true)

// Input parameters
useDateFilter = input.bool(true, title="Filter Date Range of Backtest",  group="Backtest Time Period")
startDate = input(timestamp("2020-01-01"), title = "Start date", group = "Backtest Time Period")
buyRsiLength1 = input(2, title = "RSI Buy Length 1 (default 2)", group="Buy configuration")
buyRsiLength2 = input(14, title = "RSI Buy Length 2 (default 14)", group="Buy configuration")
buyRsiValue = input(50, title = "RSI Buy Value Signal (default 50)", group="Buy configuration")
closeRsiLength1 = input(7, title = "RSI Close Length 1 (default 7)", group="Close configuration")
closeRsiLength2 = input(50, title = "RSI Close Length 2 (default 50)", group="Close configuration")
closeRsiValue = input(50, title = "RSI Close Value Signal (default 50)", group="Close configuration")

// Check timeframe
inTradeWindow = true

// Calculate RSI
rsiBuy1Value =  ta.rsi(close, buyRsiLength1)
rsiBuy2Value = ta.rsi(close, buyRsiLength2)
rsiClose1Value =  ta.rsi(close, closeRsiLength1)
rsiClose2Value = ta.rsi(close, closeRsiLength2)

// Strategy conditions
//(ta.crossover(rsiBuy1Value, buyRsiValue) or ta.crossover(rsiBuy2Value, buyRsiValue)) and
//8ta.crossunder(rsiClose1Value, closeRsiValue) or ta.crossunder(rsiClose2Value, closeRsiValue)) and
buyCondition = (ta.crossover(rsiBuy1Value, buyRsiValue) or ta.crossover(rsiBuy2Value, buyRsiValue)) and rsiBuy1Value > buyRsiValue and rsiBuy2Value > buyRsiValue
closeCondition = (ta.crossunder(rsiClose1Value, closeRsiValue) or ta.crossunder(rsiClose2Value, closeRsiValue)) and rsiClose1Value < closeRsiValue and rsiClose2Value < closeRsiValue


// Strategy actions
if (inTradeWindow  and buyCondition)
    strategy.entry("Buy", strategy.long)


if (inTradeWindow and closeCondition)
    strategy.close("Buy")

// Plot RSI and overbought/oversold levels
plotchar(rsiBuy1Value, title = "RSI-Buy1", color = color.green)
plotchar(rsiBuy2Value, title = "RSI-Buy2", color = color.lime)
plotchar(rsiClose1Value, title = "RSI-Close1", color = color.red)
plotchar(rsiClose2Value, title = "RSI-Close2", color = color.fuchsia)
- Relative Body Index Crossover Strategy
- Multi-level Batch Take Profit BTC Robot Trading Strategy
- Dual Moving Average and RSI Reversal Trading Strategy
- Dual Moving Average Bollinger Band System Strategy
- Architecture Breakthrough Backtesting Strategy
- Breakout Strategy Based on Turtle Trading
- The DEMA Trend Following Strategy
- Algorithm RSI Range Breakout Strategy
- RSI Rising Crypto Trending Strategy
- EMA Slope Cross Trend Following Strategy
- Exponential Moving Average Crossover Strategy
- Moving Average Crossover Strategy
- Tracking Breakout Strategy
- Dual Moving Average Monitoring Model
- Mean Reversion Strategy Based on ATR
- Relative Volume Trend Following Trading Strategy
- MACD Trend Balancing Strategy
- EMA and Heikin Ashi Trading Strategy
- Trend Following Long Only Strategy
- Multi-model Candlestick Pattern Combination Strategy