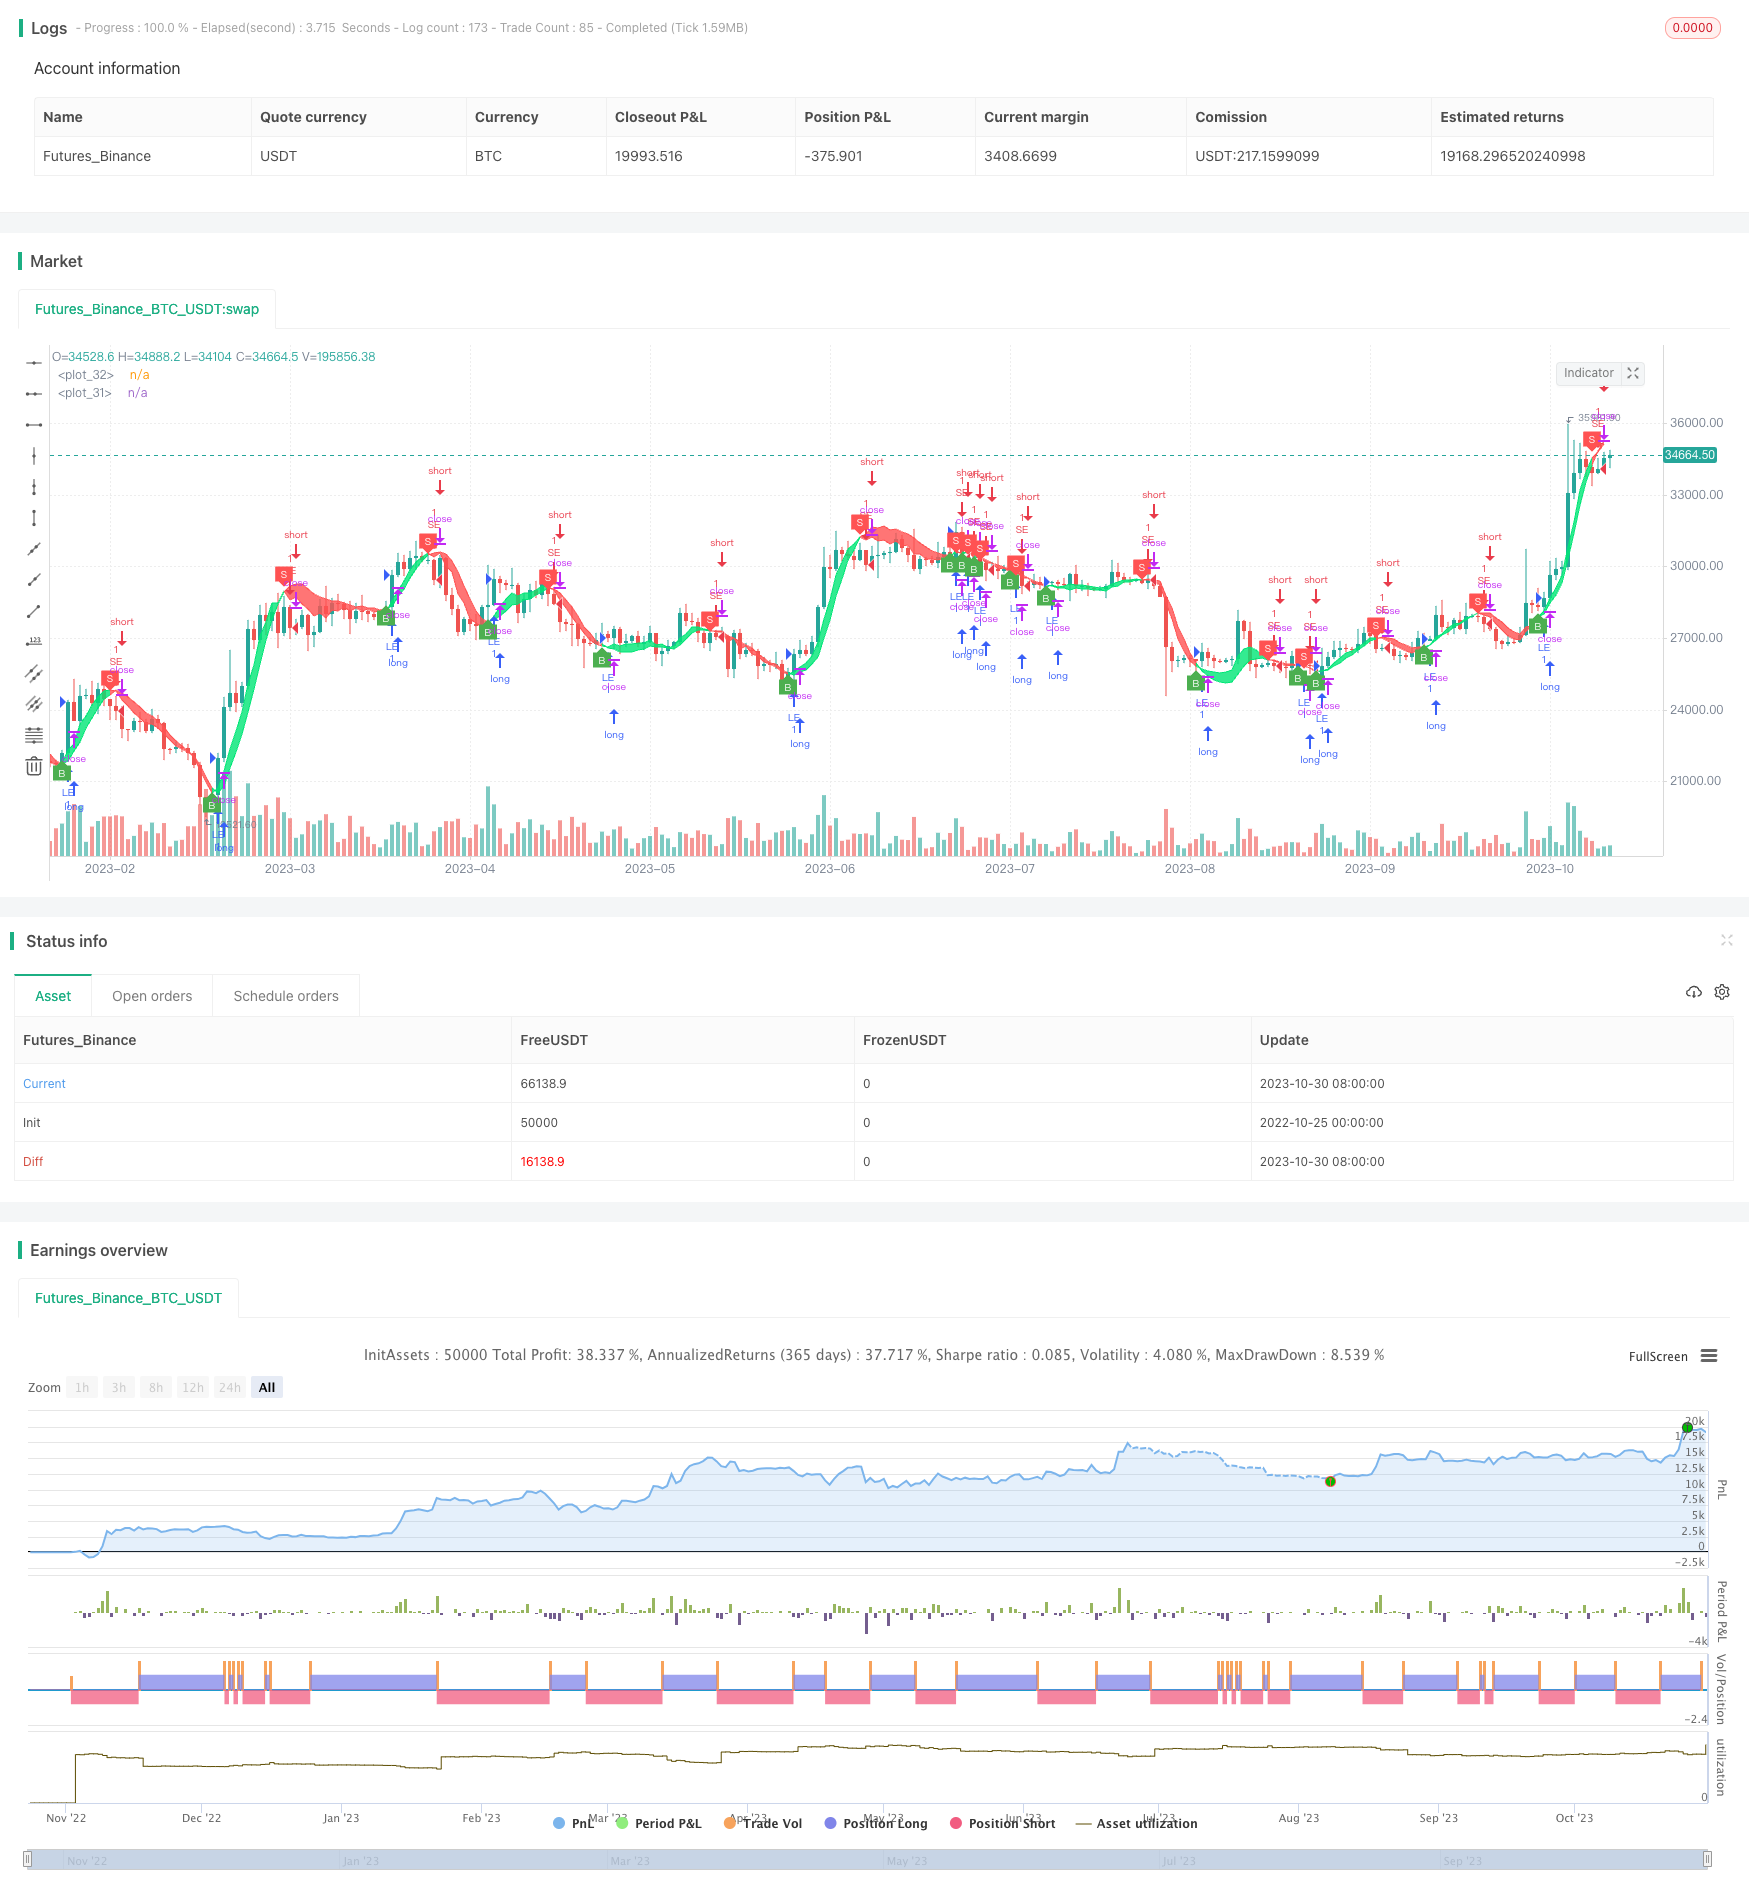
Overview
This strategy combines Hull Moving Average and Kalman filter to identify and track price trends, belonging to trend tracking strategies. It uses two Hull Moving Averages with different periods to generate trading signals, and adopts Kalman filter to smooth the signals, aiming to improve signal quality and strategy stability.
Strategy Logic
The strategy uses 24-period Hull Moving Average (hma) and 24-period Triple Hull Moving Average (hma3) to construct trading signals.
When hma crosses over hma3, a buy signal is generated. When hma crosses below hma3, a sell signal is generated.
Kalman filter is disabled by default. When enabled, it smooths hma and hma3 to filter out excessive noise and improve signal quality.
Kalman filter eliminates random noise from signals through predicting and correcting steps. The difference between each measurement and last prediction is treated as the correcting item to predict next measurement more precisely. By repeating prediction and correction, the impact of noise can be reduced gradually to smooth the signal.
This strategy leverages Kalman filter to enhance the stability of moving average strategies by filtering out random fluctuations and tracking persistent trends.
Advantages
Dual moving averages system can better identify lasting trends compared to single moving average.
Hull Moving Average puts more weight on recent prices through weighted calculation, making it more sensitive in capturing price changes.
Kalman filter can effectively filter out random noise from signals, reducing false signals and improving signal quality.
Adjustable parameters like period and Kalman filter gain allows the strategy to adapt to different market conditions.
Adopting cross-period techniques generates more persistent signals, avoiding being misguided by excessive random fluctuations.
Visual interface intuitively displays signals and trend status for ease of operation.
Risks
Dual moving averages are prone to generating wrong signals around trend turning points, unable to timely capture reversals.
The lagging of moving averages may miss opportunities of fast price reversals.
Not suitable for violent fluctuating markets. Should avoid using it during turbulent phases.
Kalman filter parameters could impact strategy performance. Too large gain may filter out valid signals.
Longer periods have slow response while shorter periods are vulnerable to noise. Parameter tuning is required based on market conditions.
Unfixed long/short holding periods lead to idle time with no positions, reducing capital utilization efficiency.
Enhancement
Try adaptive moving averages which dynamically optimize parameters based on volatility.
Incorporate volatility metrics to avoid trading during choppy markets and only trade on obvious trends.
Set up stop loss to limit losses and improve risk control.
Optimize Kalman filter parameters to balance tracking sensitivity and noise filtering level.
Confirm signal validity with other indicators like volume, Bollinger Bands for trend persistence.
Utilize machine learning to train parameters and improve strategy robustness and adaptiveness.
Conclusion
This strategy effectively identifies lasting trends and improves signal quality by dual Hull MAs and Kalman filter. Note parameter optimization, market adaptiveness and risk control for steady profits. Further improvements can be achieved through machine learning and quantitative analysis. Continuous enhancements will shape a robust and efficient trend tracking system.
/*backtest
start: 2022-10-25 00:00:00
end: 2023-10-31 00:00:00
period: 1d
basePeriod: 1h
exchanges: [{"eid":"Futures_Binance","currency":"BTC_USDT"}]
*/

//@version=4
strategy("Hull Trend with Kahlman Strategy Backtest", shorttitle="HMA-Kahlman Trend Strat", overlay=true)

src       = input(hl2,   "Price Data")
length    = input(24,    "Lookback")
showcross = input(true,  "Show cross over/under")
gain      = input(10000, "Gain")
k         = input(true,  "Use Kahlman")

hma(_src, _length) =>
    wma((2 * wma(_src, _length / 2)) - wma(_src, _length), round(sqrt(_length)))

hma3(_src, _length) =>
    p = length/2
    wma(wma(close,p/3)*3 - wma(close,p/2) - wma(close,p),p)

kahlman(x, g) =>
    kf = 0.0
    dk = x - nz(kf[1], x)
    smooth = nz(kf[1],x)+dk*sqrt((g/10000)*2)
    velo = 0.0
    velo := nz(velo[1],0) + ((g/10000)*dk)
    kf := smooth+velo

a = k ? kahlman(hma(src, length), gain) : hma(src, length)
b = k ? kahlman(hma3(src, length), gain) : hma3(src, length)
c = b > a ? color.lime : color.red
crossdn = a > b and a[1] < b[1]
crossup = b > a and b[1] < a[1]

p1 = plot(a,color=c,linewidth=1,transp=75)
p2 = plot(b,color=c,linewidth=1,transp=75)
fill(p1,p2,color=c,transp=55)
plotshape(showcross and crossdn ? a : na, location=location.absolute, style=shape.labeldown, color=color.red, size=size.tiny, text="S", textcolor=color.white, transp=0, offset=-1)
plotshape(showcross and crossup ? a : na, location=location.absolute, style=shape.labelup, color=color.green, size=size.tiny, text="B", textcolor=color.white, transp=0, offset=-1)

longCondition = crossup
if (longCondition)
    strategy.entry("LE", strategy.long)

shortCondition = crossdn
if (shortCondition)
    strategy.entry("SE", strategy.short)