Price-based Stop Loss and Take Profit Strategy
Author: ChaoZhang, Date: 2023-11-23 15:36:00Tags:

Overview
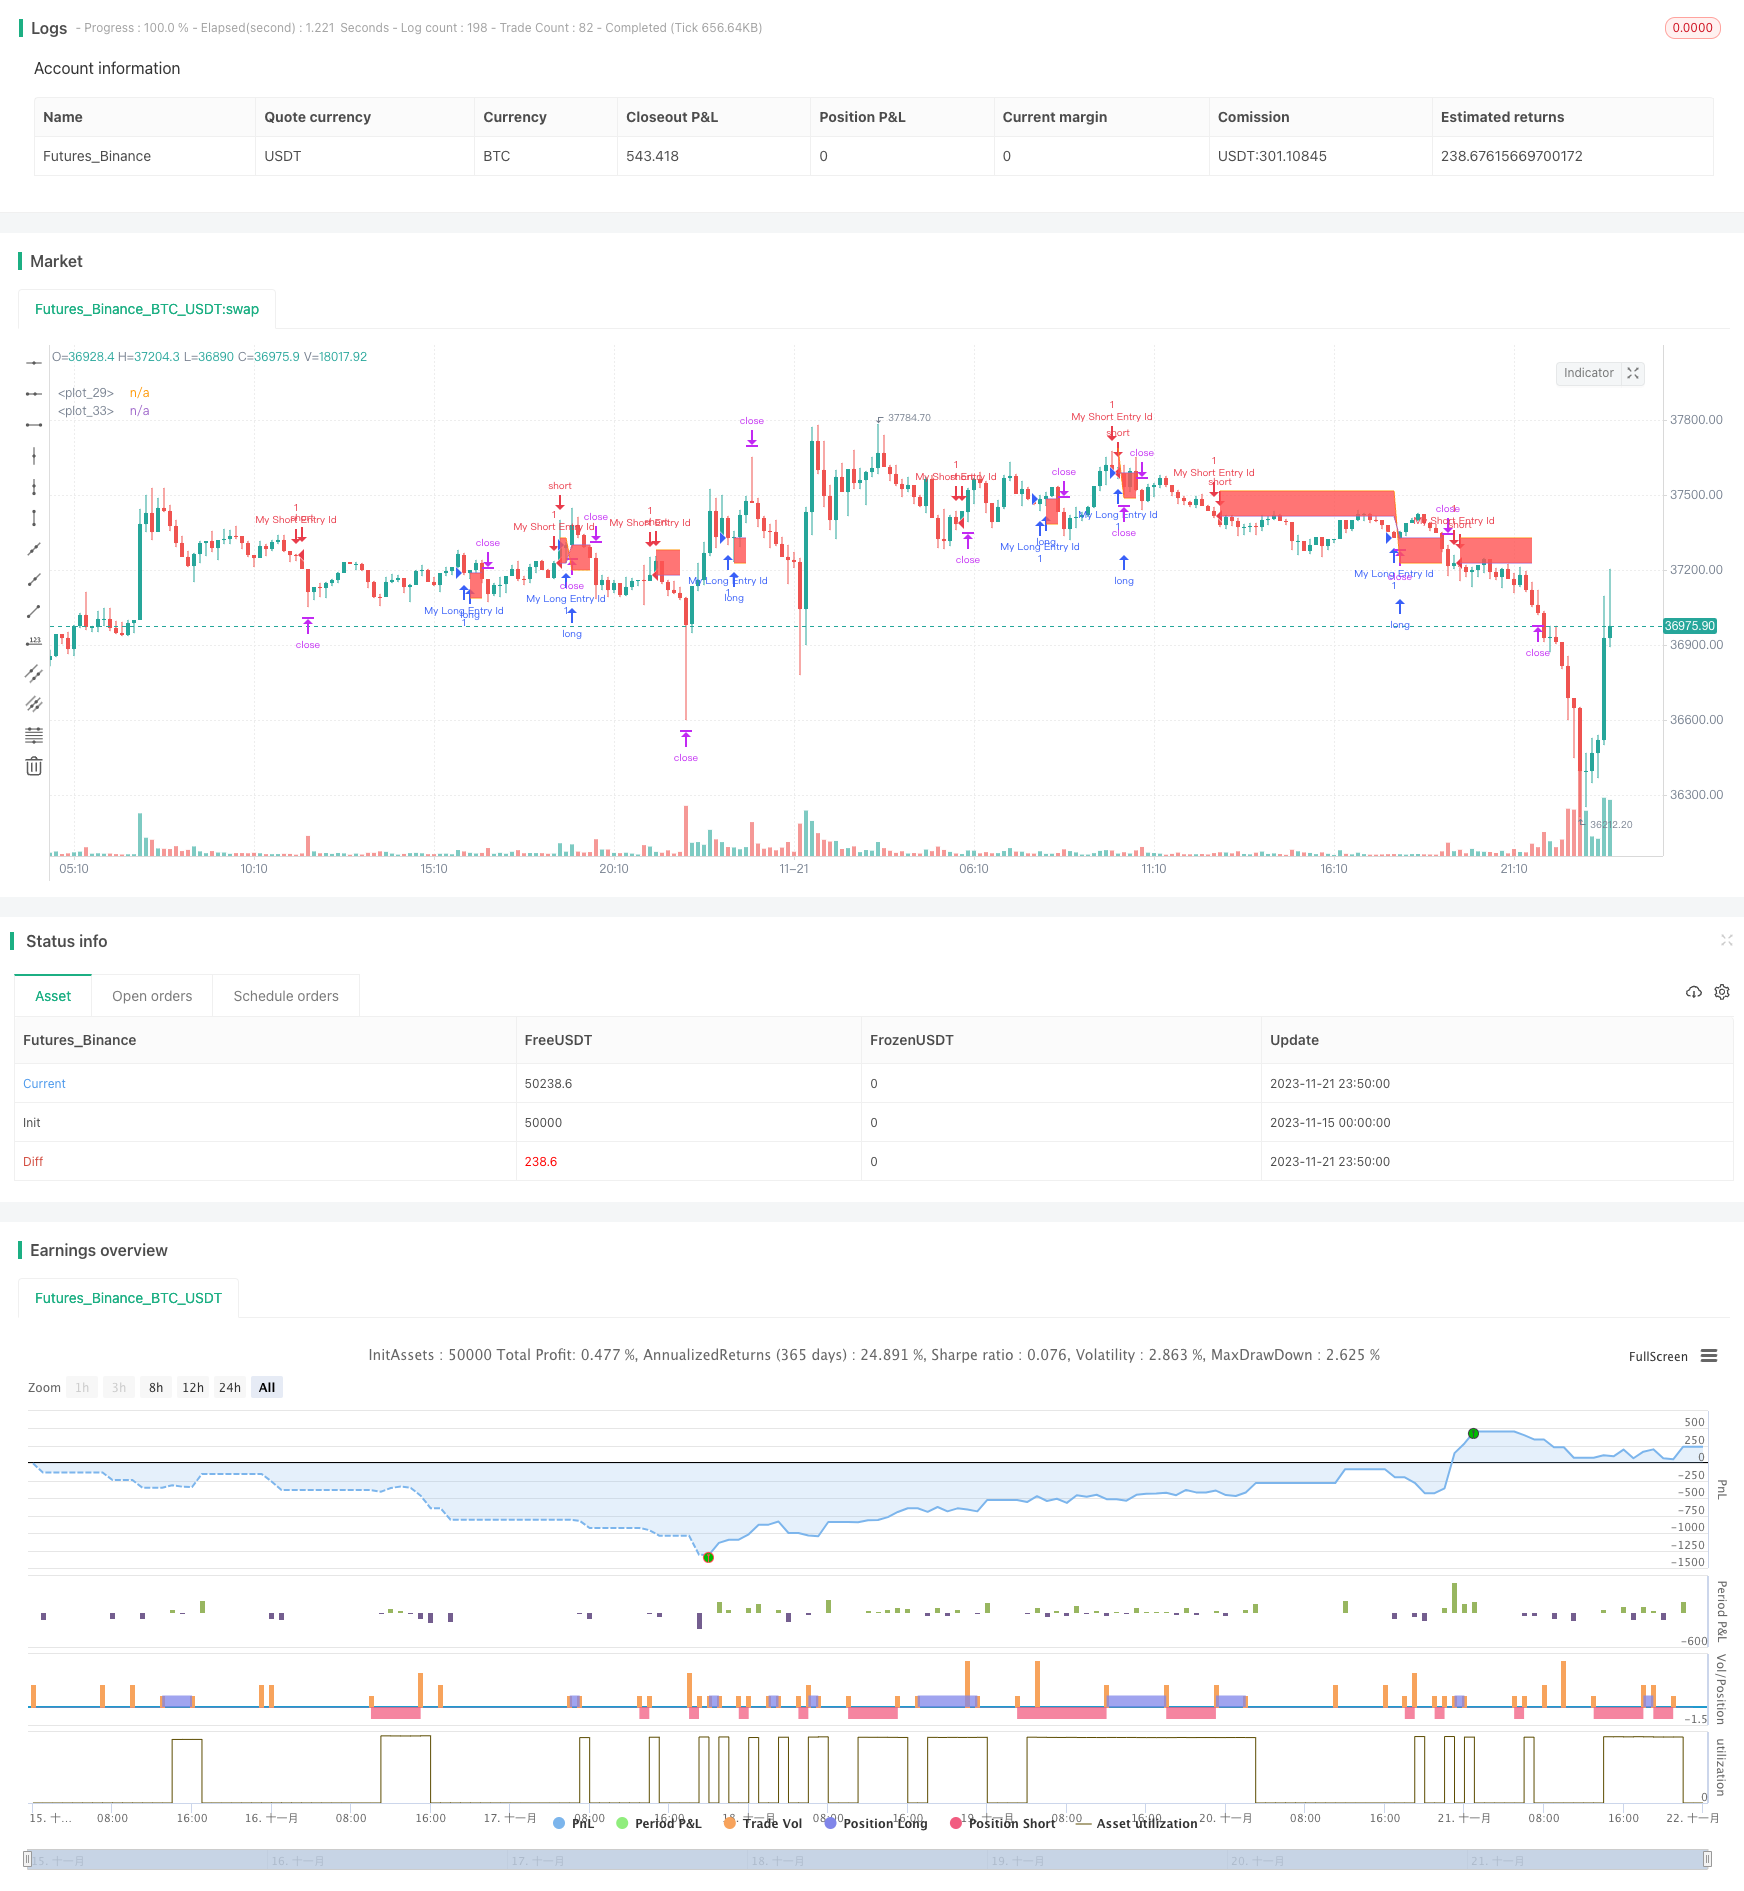
The core idea of this strategy is to use the input stop loss and take profit amounts to set reasonable stop loss and take profit tick levels, to manage the risk and reward of each trade.
Strategy Logic
The strategy first sets random entry signals, going long when SMA14 crosses over SMA28, and going short when SMA14 crosses under SMA28.
After entry, the strategy uses the moneyToSLPoints function to calculate the stop loss tick level based on the stop loss dollar amount input. Similarly, it also calculates the take profit tick level. This implements stop loss and take profit based on dollar amounts.
For example, if going long 100 contracts with each tick worth $10, and stop loss is set at $100, then the stop loss tick level would be calculated as 100/10/100 = 0.1 ticks.
Finally strategy.exit is used to set the stop loss and take profit exit points. The stop loss and take profit lines are also plotted for debugging purposes.
Advantage Analysis
The biggest advantage of this price-based stop loss and take profit strategy is that the parameters are intuitive. The relationship between risk and reward can be clearly seen to guide parameter selection.
Also, dollar-amount stops can better control actual risk exposure compared to fixed tick stops when market volatility changes.
Risk Analysis
There are some risks with this stop loss and take profit strategy:
-
If the stop loss is too wide, it’s easy to get caught on reversals. If the stop distance is too big, short term reversals become likely and can catch the trade.
-
If the take profit is too close, it may be hard to reach. If the take profit distance is very small, it would be hard for normal one-sided trends to reach it, making profits unlikely.
-
Appropriate contracts need to be chosen. If a high tick value contract like Crude Oil is used, the same dollar stop loss would translate to very little ticks, which can easily get stopped out on noise.
Optimization Directions
Some ways this strategy can be improved on:
-
The entry signal can be enhanced by combining trend, volatility, seasonality etc. to time entries better.
-
Appropriate stop/profit percentages can be chosen based on different products. Larger stops can be used in highly volatile commodities.
-
Stops can adapt to volatility. Widen when volatility rises and tighten when volatility falls.
-
Different stop/profit approaches can be used for different trading sessions. Tighter stops can be used during US session to reduce chance of being caught in whipsaws.
Conclusion
This strategy implements intuitive stop loss and take profit based on dollar amounts. Its advantages are intuitive parameters and capital control. Drawbacks are ease of being caught in reversals and missing profits. It can be improved by enhancing entries, optimizing stops/targets, choosing better products etc. to make it more stable.
/*backtest
start: 2023-11-15 00:00:00
end: 2023-11-22 00:00:00
period: 10m
basePeriod: 1m
exchanges: [{"eid":"Futures_Binance","currency":"BTC_USDT"}]
*/

// This source code is subject to the terms of the Mozilla Public License 2.0 at https://mozilla.org/MPL/2.0/
// © adolgov

// @description
//

//@version=4
strategy("Stop loss and Take Profit in $$ example", overlay=true)

// random entry condition

longCondition = crossover(sma(close, 14), sma(close, 28))
if (longCondition)
    strategy.entry("My Long Entry Id", strategy.long)

shortCondition = crossunder(sma(close, 14), sma(close, 28))
if (shortCondition)
    strategy.entry("My Short Entry Id", strategy.short)

moneyToSLPoints(money) =>
    strategy.position_size !=0 ? (money / syminfo.pointvalue / abs(strategy.position_size)) / syminfo.mintick : na

p = moneyToSLPoints(input(200, title = "Take Profit $$"))
l = moneyToSLPoints(input(100, title = "Stop Loss $$"))
strategy.exit("x", profit = p, loss = l)

// debug plots for visualize SL & TP levels
pointsToPrice(pp) =>
    na(pp) ? na : strategy.position_avg_price + pp * sign(strategy.position_size) * syminfo.mintick

pp = plot(pointsToPrice(p), style = plot.style_linebr )
lp = plot(pointsToPrice(-l), style = plot.style_linebr )
avg = plot( strategy.position_avg_price, style = plot.style_linebr )
fill(pp, avg, color = color.green)
fill(avg, lp, color = color.red)
- Bollinger Bands Breakout short-term trend following Strategy
- Buying dips with take profit and stop loss
- RSI Axial Moving Average Crossover Strategy
- Dual SMA Crossover Strategy
- Dual EMA and RSI Combination Strategy
- Speculation Gulf : Trend Follow Strategy Based on SAR
- ORIGINAL PRIMITIVE TREND TRACKING STRATEGY BASED ON MOVING AVERAGE
- The Bollinger Bands Stop Loss Strategy
- Trend Tracking Strategy Based on Multi-indicator
- Multiple Moving Average Dynamic Trend Strategy
- Timeframe Power Trading Strategy
- Bi-Directional Trend Tracking Moving Average Crossover Strategy
- Personalized Momentum Trading Strategy
- Moving Average Envelop Channel Trend Following Strategy
- Momentum Combined with Trend Judgment Multi-factor Quantitative Trading Strategy
- Momentum Breakout Strategy Based on Internal Amplitude Stop Loss
- Trend Trading Strategy Based on Golden Cross
- Trend Tracking Strategy Based on Channel Breakouts
- Bollinger Break Out Strategy with Pyramiding
- Momentum Tracking Strategy