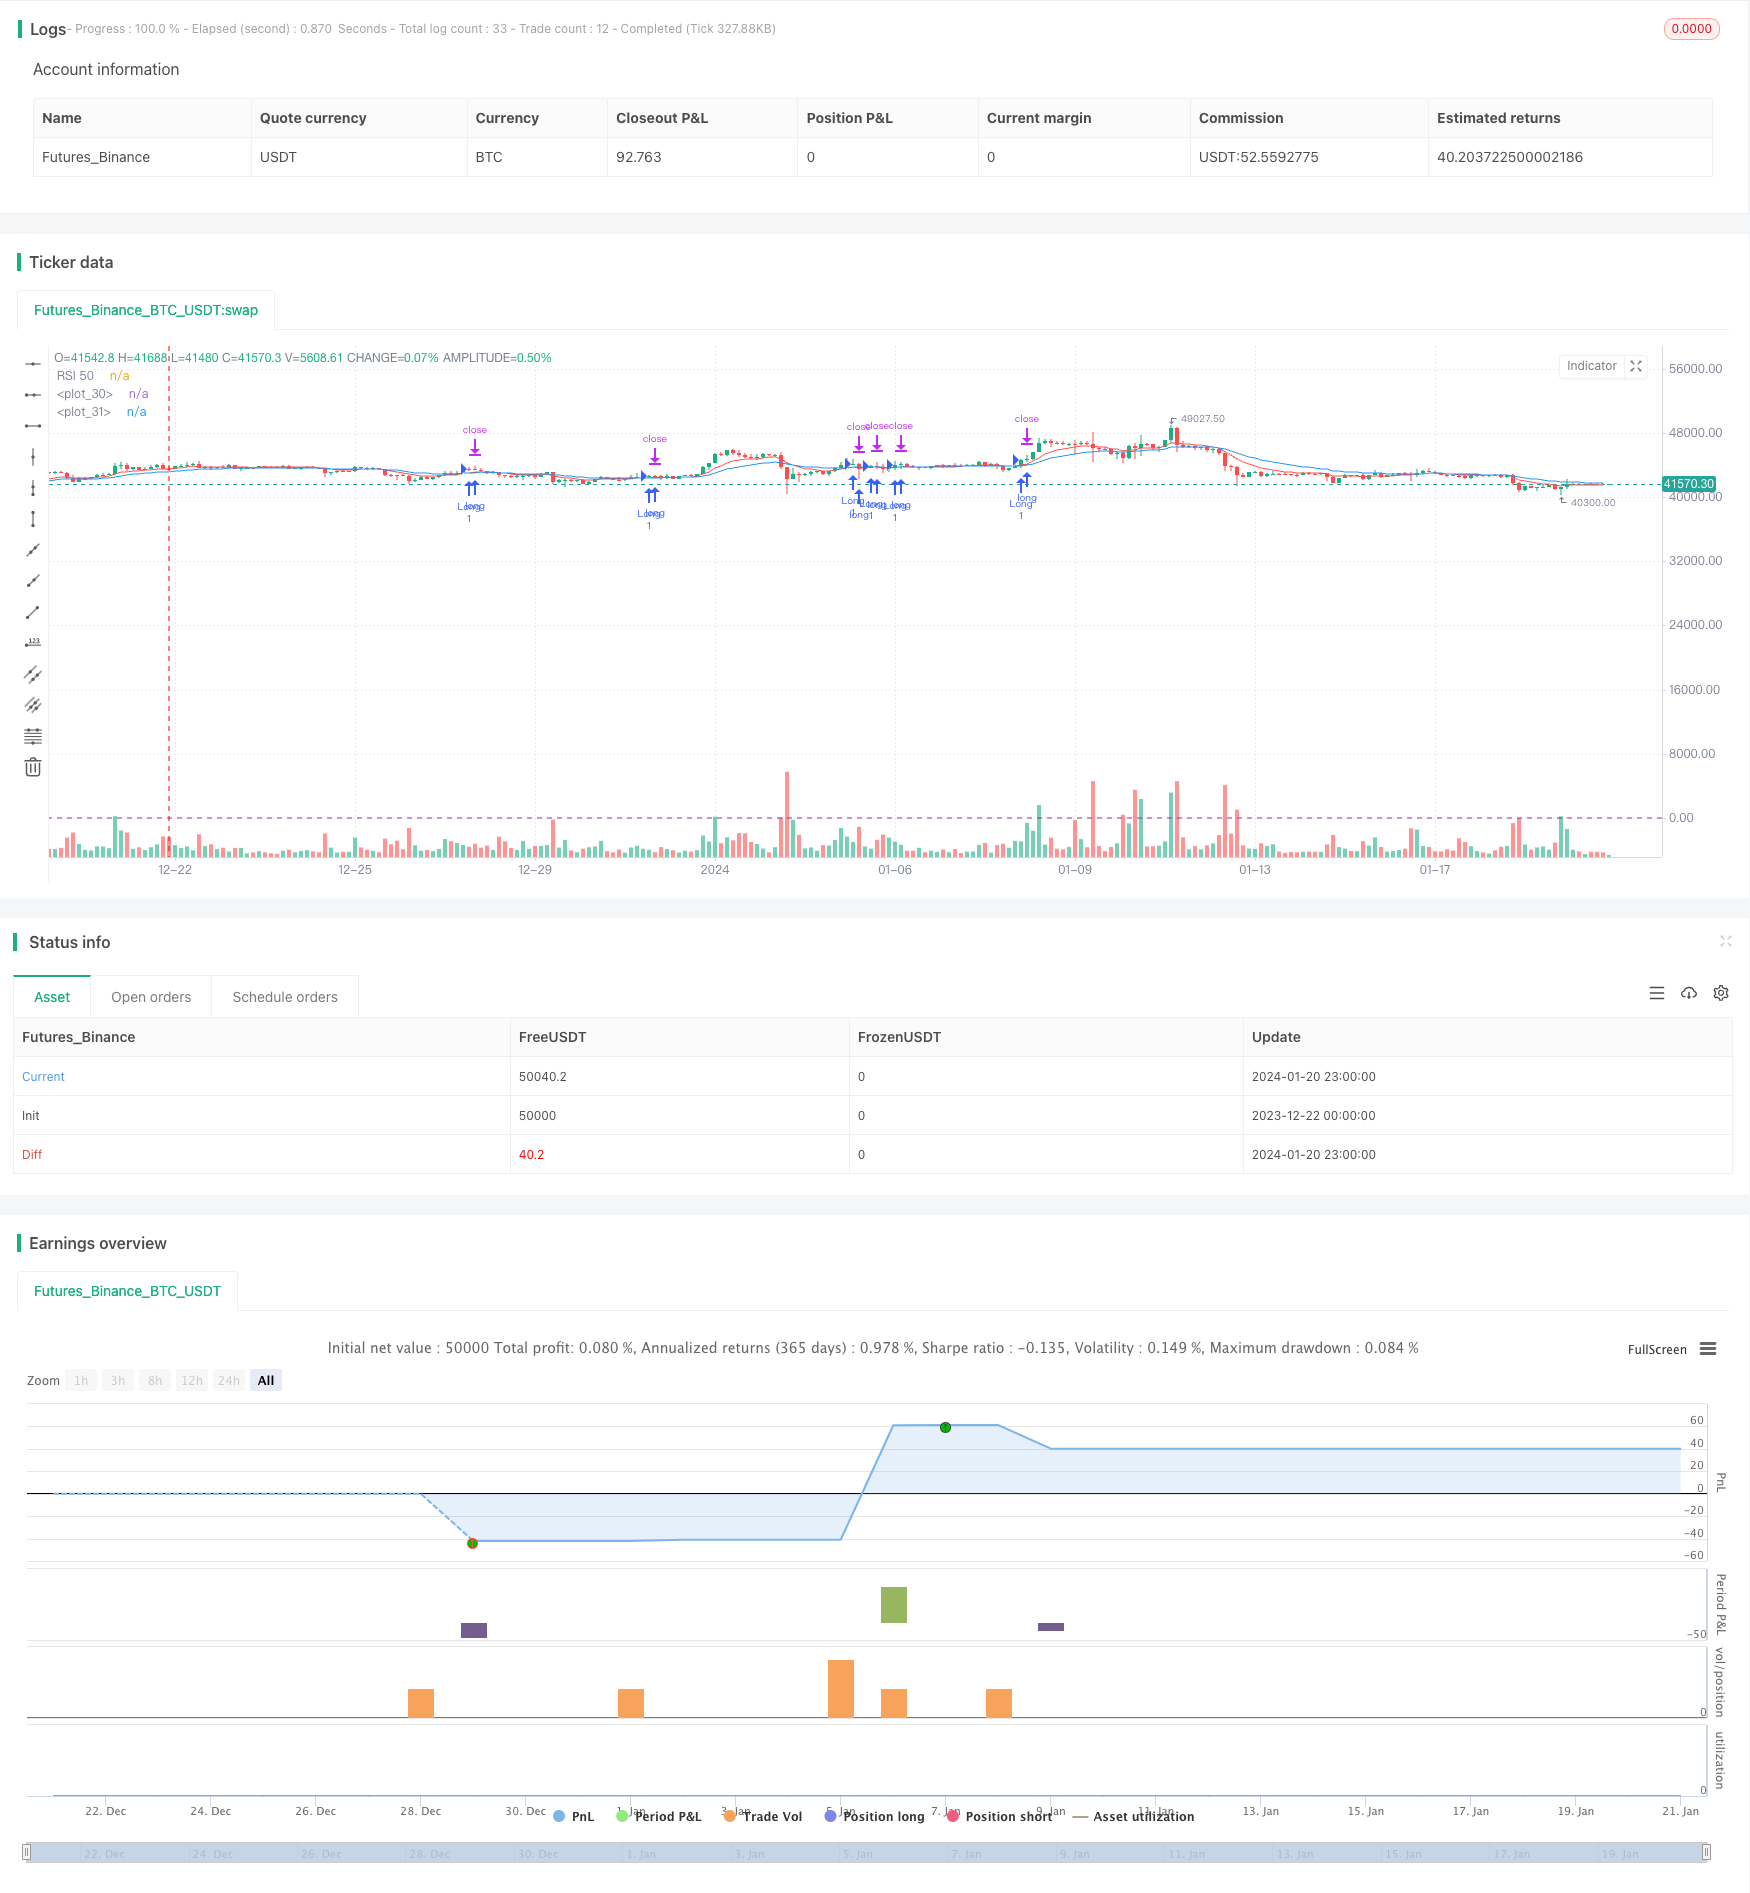
Overview
The strategy uses a combination of dual exponential moving average (EMA) crossovers and relative strength index (RSI) to identify potential trading opportunities in the markets. It is suited for traders looking to track bigger price moves and swings.
Strategy Logic
The core idea is to buy when the faster 9-week EMA moves up and crosses above the slower 21-week EMA, as this signals the market trend may be strengthening. Then if RSI is above 50, it confirms the buy signal as it means upward momentum is strong.
Specifically, a long entry signal is triggered when the 9-week EMA crosses above the 21-week EMA, and 14-week RSI is greater than 50. Positions are then sized for 2% account risk, with a 5% stop loss and 10% profit target. A 3% trailing stop also locks in profits.
The sell signal is based on opposite logic: if the 9-week EMA crosses below the 21-week EMA or if RSI drops below 50. This indicates the short-term trend has reversed down.
Advantages
- Dual indicators identify opportunities with higher quality signals
- RSI helps confirm trend and filter false breakouts
- Well-suited for tracking larger price swings
- Risk management with stop loss and take profit
- Trailing stop helps optimizes profit protection
Risks
- Fast EMA crossovers can generate more noise
- Possibility of false signals from RSI
- Risk reward ratio confined to 2:1
- Does not account for trading costs
- Many parameters need optimization like MA periods, RSI settings etc
This can be optimized by systematically testing combinations of these parameters. Additional filters in condition logic can reduce noisy trades. Considering fundamentals can provide more confirmation.
Enhancement Opportunities
- Test EMA period parameters for best mix
- Optimize RSI parameters to reduce false signals
- Add additional confirmation indicators like Bollinger Band Width
- Combine with fundamental analysis for higher quality signals
- Strategy can extend across multiple timeframes like intraday
Conclusion
The strategy leverages the power of EMA and RSI to identify potential opportunities within bigger trends. It provides clear risk management rules to effectively control risk per trade. Further testing and optimizing parameters can continue enhancing performance. It offers an effective way to trade larger cyclical swings in markets.
                    /*backtest
start: 2023-12-22 00:00:00
end: 2024-01-21 00:00:00
period: 3h
basePeriod: 15m
exchanges: [{"eid":"Futures_Binance","currency":"BTC_USDT"}]
*/

//@version=4
strategy("Weekly Swing Trading Strategy", overlay=true)

// Entry Indicators
shortEma = ema(close, 9)
longEma = ema(close, 21)
rsiValue = rsi(close, 14)

// Entry Condition
longCondition = crossover(shortEma, longEma) and rsiValue > 50
if (longCondition)
    strategy.entry("Long", strategy.long)

// Position Sizing (2% risk per trade)
riskPerTrade = 0.02
stopLossPercent = 0.05 // 5% stop loss
stopLossPrice = close * (1 - stopLossPercent)
strategy.exit("Stop Loss", "Long", stop=stopLossPrice)

// Profit Target and Trailing Stop
profitTargetPercent = 0.10 // 10% profit target
profitTargetPrice = close * (1 + profitTargetPercent)
trailStopPercent = 0.03 // 3% trailing stop
strategy.exit("Take Profit", "Long", limit=profitTargetPrice, trail_price=trailStopPercent, trail_offset=trailStopPercent)

// Exit Strategy
exitCondition = crossunder(shortEma, longEma) or rsiValue < 50 // Exit when EMAs cross or RSI drops below 50
strategy.close("Long", when=exitCondition)

plot(shortEma, color=color.red)
plot(longEma, color=color.blue)
hline(50, "RSI 50", color=color.purple)
- EMA Ribbon Strategy
- Precise Trend Reversal Moving Average Crossover Strategy
- Multi-EMA Bullish Trend Strategy
- S&P500 Hybrid Seasonal Trading Strategy
- Deviation-Based Trend Tracking Strategy
- RSI Divergence Trading Strategy
- Multi-Indicator Decision Tree Strategy: IMACD, EMA and Ichimoku
- MACD Double Optimization Trading Strategy
- Dual EMA Golden Cross Strategy
- Multi-timeframe RSI and Moving Average Trading Strategy
- EVWMA based MACD Trading Strategy
- Bollinger Bands Channel Breakout Mean Reversion Strategy
- Quantitative Trend Tracking Strategy Based on Multiple Technical Indicators
- RSI & CCI Combination Quantitative Trading Strategy
- Low Risk DCA Trend Trading Strategy
- Stochastic Momentum Strategy
- Momentum Oscillator Trend Tracking Strategy
- Zero Lag Overlapping Moving Average with Chandelier Exit Trading Strategy
- RSI 5 Momentum Trading Strategy
- Scaled Normalized Vector Strategy with Activation Functions, ver.4