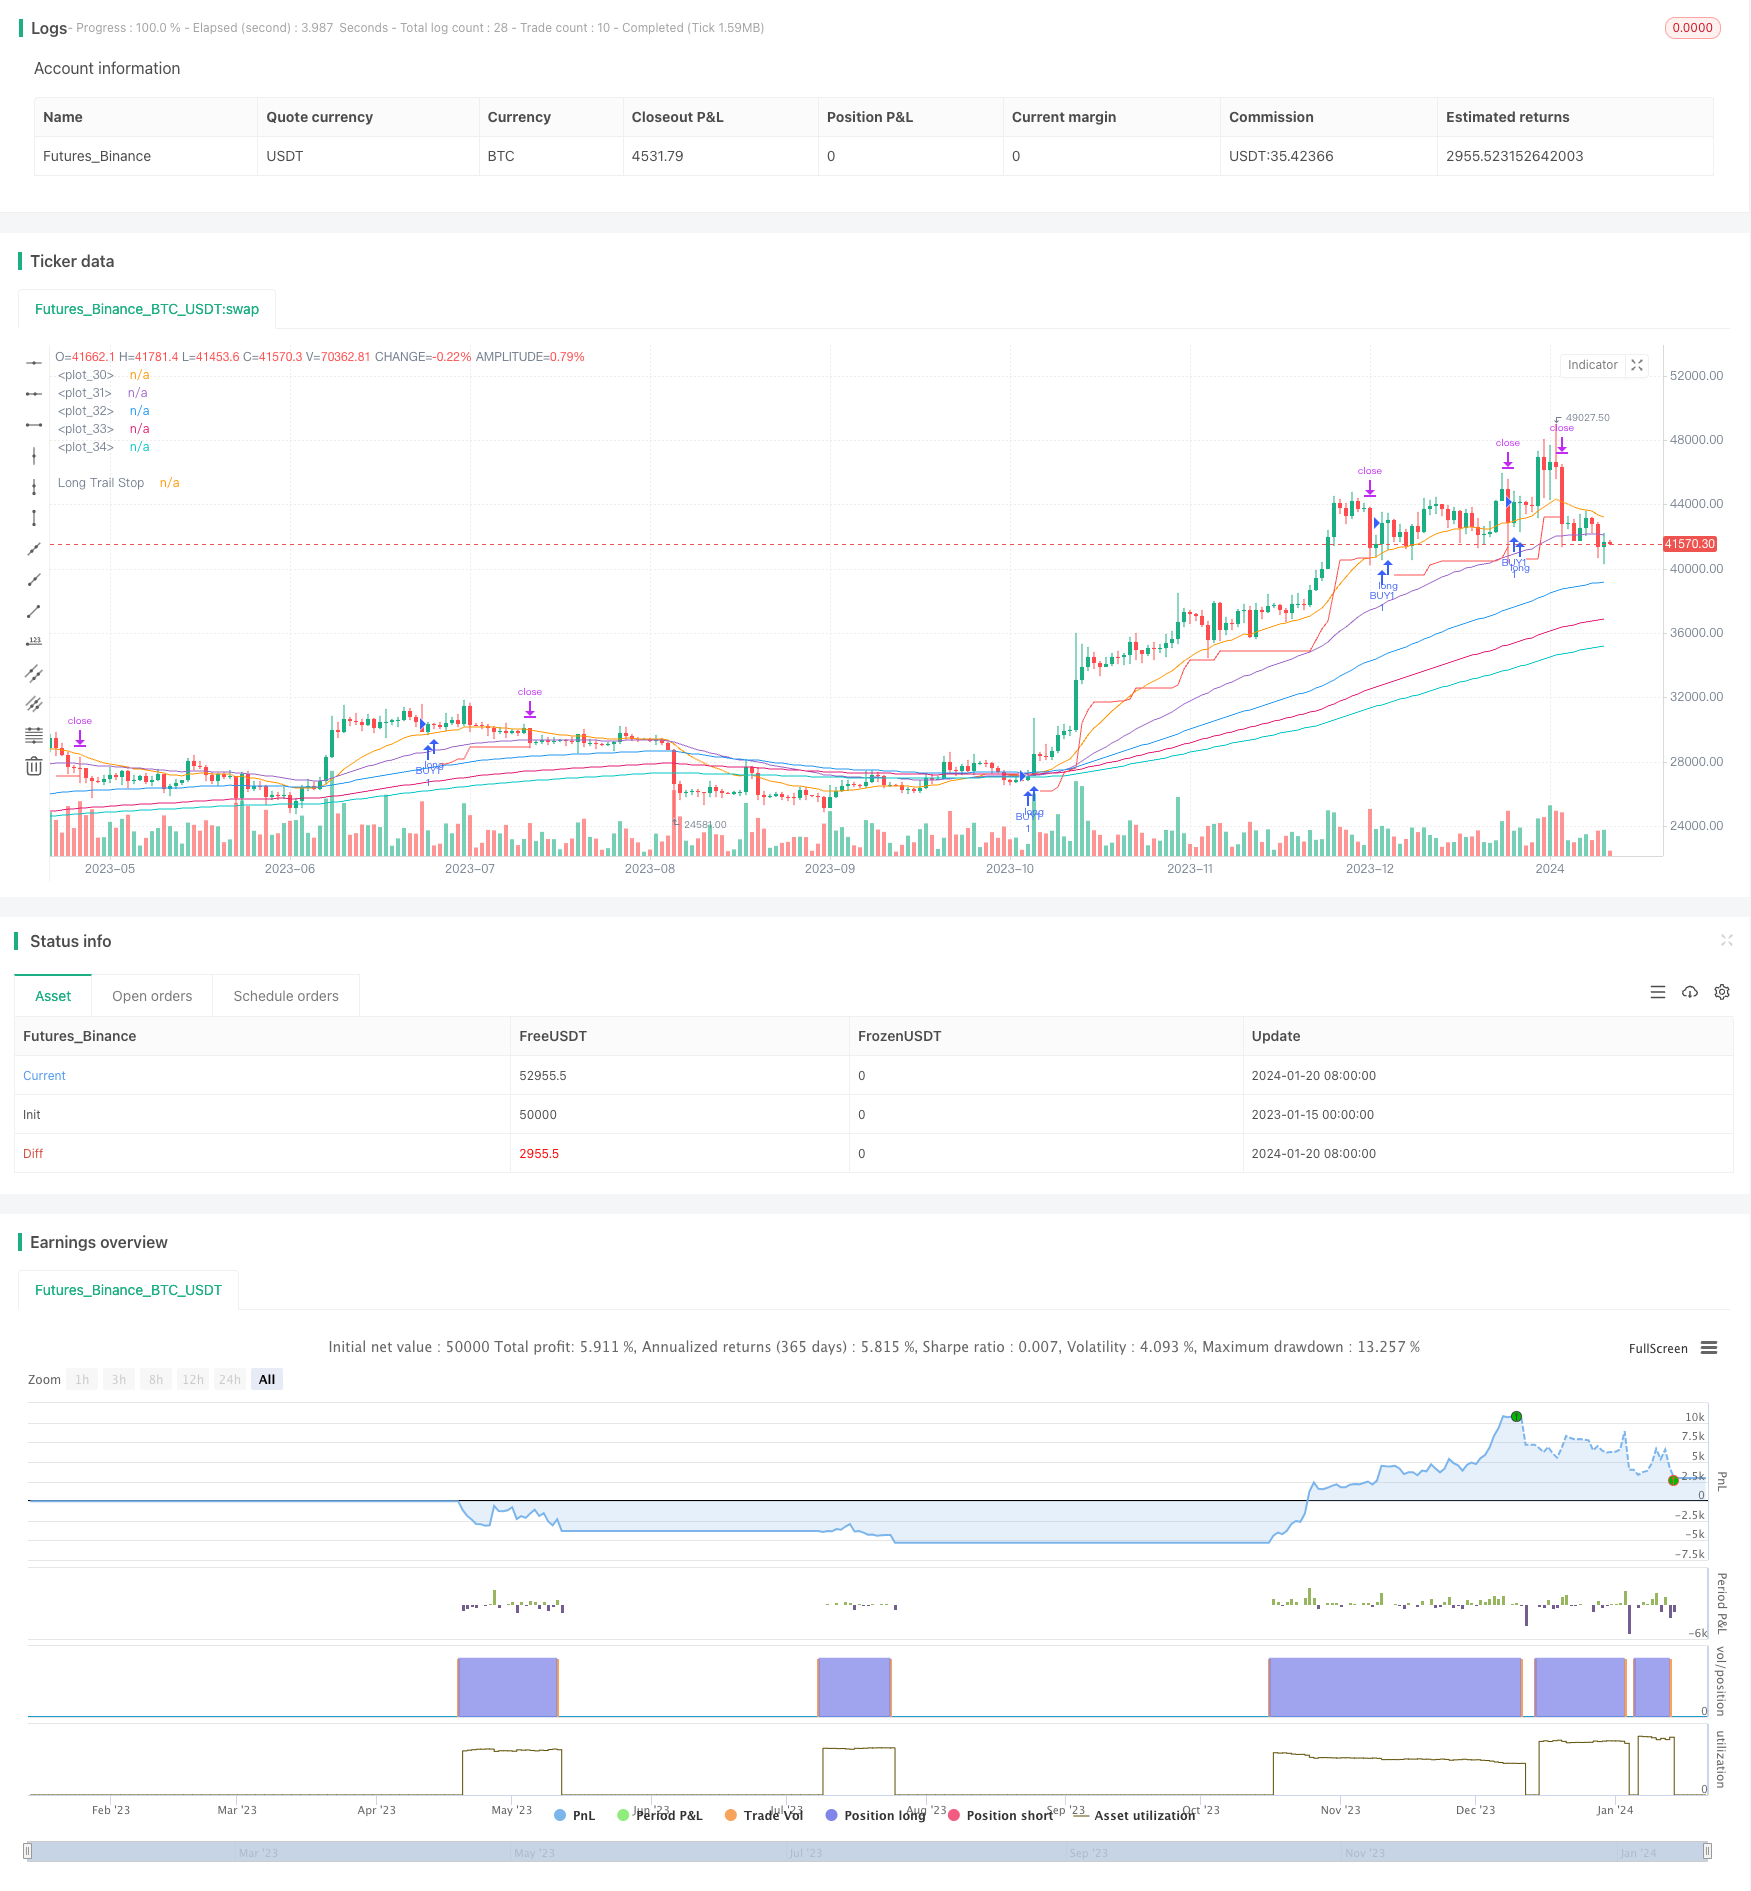
Multi-EMA Bullish Trend Strategy
Author: ChaoZhang, Date: 2024-01-22 12:04:05Tags:

Overview
The Multi-EMA Bullish Trend Strategy is a trend following strategy based on multiple exponential moving averages (EMA) of different periods for trend determination. It goes long when price breaks above 10-day EMA and other longer period EMAs are in bullish alignment; and uses 8% trailing stop loss to lock in profits.
Strategy Logic
The strategy employs 6 EMAs of periods 10, 20, 50, 100, 150 and 200 days. These EMAs are used to determine the current cyclical stage of the market. When shorter period EMAs (e.g. 10-day) cross over longer period ones (e.g. 20-, 50-day), it signals the market has entered the markup phase of a bull trend.
Specifically, the strategy will go long when the following conditions are met:
- 10-day EMA is higher than 20-day EMA
- 20-day EMA is higher than 50-day EMA
- 100-day EMA is higher than 150-day EMA
- 150-day EMA is higher than 200-day EMA
- Close price crosses over 10-day EMA
After opening long position, an 8% trailing stop loss is used to lock in profits. That means the position will be kept open as long as the price does not fall more than 8% from the entry price. Once the drawdown exceeds 8%, the position will be closed to stop loss.
In summary, the key idea of this strategy is to enter bull trend when confirmed by multiple EMA alignment, and use trailing stop loss to lock in profits.
Advantage Analysis
The Multi-EMA bull trend strategy has the following major strengths:
- It can effectively filter false breakouts and ensure catching the markup cycles, reducing unnecessary trades.
- The multiple EMA filters lower the chance of stop loss being hit, allowing safer holding of positions.
- The 8% trailing stop loss is neither too tight nor too loose, balancing profit-taking and loss-stopping.
- The strategy allows flexible parameter tuning for optimization across different products.
Risk Analysis
There are also some risks to note for this strategy:
- EMA sequence cannot guarantee trend direction for 100% cases, some whipsaws can still occur.
- The 8% trailing stop may give up some profits during huge trends.
- EMA systems have inherent laggingness, turning points confirmation can be slightly delayed.
To address these risks, we can optimize by adjusting EMA periods or incorporating auxiliary indicators for improved judgment.
Optimization Directions
Considering the characteristics of this strategy, future optimizations can focus on the following aspects:
- Test different EMA combinations and period sets to find optimal parameters.
- Add volatility index indicators to gauge trend strength for avoiding unnecessary entries.
- Include more filtering indicators like MACD, KDJ for bullish alignment confirmation.
- Employ machine learning algorithms for dynamic stop loss implementation.
Conclusion
Overall, the Multi-EMA Bull Trend Strategy is a robust and reliable trend following system, balancing trend determination and risk control. There is still great potential for improvement via parameter tuning and algorithm optimization. It is an effective strategy worth trying out and researching on.
/*backtest
start: 2023-01-15 00:00:00
end: 2024-01-21 00:00:00
period: 1d
basePeriod: 1h
exchanges: [{"eid":"Futures_Binance","currency":"BTC_USDT"}]
*/

//@version=5
strategy('SirSeff\'s EMA Rainbow', overlay=true)
// Testing Start dates
testStartYear = input(2000, 'Backtest Start Year')
testStartMonth = input(1, 'Backtest Start Month')
testStartDay = input(1, 'Backtest Start Day')
testPeriodStart = timestamp(testStartYear, testStartMonth, testStartDay, 0, 0)
//Stop date if you want to use a specific range of dates
testStopYear = input(2100, 'Backtest Stop Year')
testStopMonth = input(12, 'Backtest Stop Month')
testStopDay = input(30, 'Backtest Stop Day')
testPeriodStop = timestamp(testStopYear, testStopMonth, testStopDay, 0, 0)

testPeriod() =>
    time >= testPeriodStart and time <= testPeriodStop ? true : false
// Component Code Stop

//TSP
trailStop = input.float(title='Long Trailing Stop (%)', minval=0.0, step=0.1, defval=8) * 0.01

longStopPrice = 0.0
longStopPrice := if strategy.position_size > 0
    stopValue = close * (1 - trailStop)
    math.max(stopValue, longStopPrice[1])
else
    0

//PLOTS
plot(series=strategy.position_size > 0 ? longStopPrice : na, color=color.new(color.red, 0), style=plot.style_linebr, linewidth=1, title='Long Trail Stop', offset=1, title='Long Trail Stop')
plot(ta.ema(close, 20))
plot(ta.ema(close, 50))
plot(ta.ema(close, 100))
plot(ta.ema(close, 150))
plot(ta.ema(close, 200))

//OPEN
longCondition =  ta.ema(close, 10) > ta.ema(close, 20) and ta.ema(close, 20) > ta.ema(close, 50) and ta.ema(close, 100) > ta.ema(close, 150) and ta.ema(close, 150) > ta.ema(close, 200)
if longCondition and ta.crossover(close,ta.ema(close,10)) and testPeriod()
    strategy.entry("BUY1", strategy.long)

if longCondition and ta.crossover(ta.ema(close,10),ta.ema(close,20)) and testPeriod()
    strategy.entry("BUY2'", strategy.long)

//CLOSE @ TSL
if strategy.position_size > 0 and testPeriod()
    strategy.exit(id='TSP', stop=longStopPrice)
- Reversal RSI Trend Tracking ETF Trading Strategy
- Trend Tracking and Short-term Trading Strategy Based on ADX Indicator
- Momentum Trend Dual Strategy
- Dynamic CCI Support and Resistance Strategy
- QQE Momentum Trading Strategy
- The Gauss Wave Forecasting Strategy
- Dynamic Moving EMAs Combination Quant Strategy
- Donchian Channel Trend Following Strategy
- EMA Ribbon Strategy
- Precise Trend Reversal Moving Average Crossover Strategy
- S&P500 Hybrid Seasonal Trading Strategy
- Deviation-Based Trend Tracking Strategy
- RSI Divergence Trading Strategy
- Multi-Indicator Decision Tree Strategy: IMACD, EMA and Ichimoku
- MACD Double Optimization Trading Strategy
- Dual EMA Golden Cross Strategy
- Multi-timeframe RSI and Moving Average Trading Strategy
- Weekly Swing Trading Strategy
- EVWMA based MACD Trading Strategy
- Bollinger Bands Channel Breakout Mean Reversion Strategy